Impact Factor
- Issue 12; 2026
- Issue 11; 2026
- Issue 10; 2026
- Issue 9; 2026
- Issue 8; 2026
- Volume 16; 2026
- Advance Articles
- Past Issues
- Cover Images
- Cover Suggestion
- Index & Coverage
- Special Issues
Introduction
Materials and Methods
Results
Discussion
Abbreviations
Acknowledgements
Supplementary Material
References
International Journal of Biological Sciences
International Journal of Medical Sciences
 Global reach, higher impact

Theranostics 2019; 9(9):2618-2636. doi:10.7150/thno.32363 This issue Cite
Research Paper
Tumor-derived nanovesicles promote lung distribution of the therapeutic nanovector through repression of Kupffer cell-mediated phagocytosis
Xiaolan Qiu1*, Zhi Li1*, Xuedong Han1*, Linlin Zhen1, Chao Luo2, Minmin Liu1, Kun Yu3 ![]() , Yi Ren1
, Yi Ren1 ![]()
1. Department of Breast and Thyroid Surgery, The Affiliated Huai'an No. 1 People's Hospital of Nanjing Medical University, Huai'an, Jiangsu 223300, China
2. Department of Central Laboratory, The Affiliated Huai'an No. 1 People's Hospital of Nanjing Medical University, Huai'an, Jiangsu 223300, China
3. Department of Cardiology, The Affiliated Huai'an No. 1 People's Hospital of Nanjing Medical University, Huai'an, Jiangsu 223300, China
* These authors contributed equally to this work.
Received 2018-12-17; Accepted 2019-2-7; Published 2019-4-13
Abstract

Tumor-derived nanovesicles have been widely used as a biomarker or therapeutic target in various tumor types. However, these nanovesicles have limited use in therapy due to the risk of advancing tumor development.
Methods: Exosome-like nanovesicles (ENVs) were developed from metastatic breast cancer 4T1 cells-derived exosomes. The distribution of ENVs and their impact on macrophage-mediated phagocytosis were evaluated. The effect of ENVs pretreatment on anti-lung metastasis therapeutic effects of chemotherapeutic drugs delivered by DOTAP/DOPE liposomes in breast cancer-bearing mice was also examined.
Results: We demonstrated that, following intravenous injection in mice, ENVs were preferentially uptaken by Kupffer cells and repressed phagocytosis. The decreased uptake appeared to be due to the translocation of membrane nucleolin from the inner face of the plasma membrane to the cell surface and intercellular Ca2+ fluxes, leading to altered expression of genes involved in phagocytosis by macrophages. Mice pretreated with 4T1-derived ENVs led to the decreased uptake of DOTAP: DOPE liposomes (DDL) in the liver. Consequently, doxorubicin-loaded DDL transported to the lungs instead of the liver, effectively inhibiting breast cancer lung metastasis. Importantly, 4T1 cells exosome-derived ENVs had no detectable toxicity in vivo and low-risk to promote tumor growth and metastasis compared to 4T1 cells exosomes.
Conclusion: Our results suggested that pretreatment with 4T1 ENVs represents a strategy to escape Kupffer cell-mediated phagocytosis effectively targeting drug delivery vehicles to tumor metastasis, reducing the IC50 of the chemotherapeutic drugs, and avoiding adverse side effects.
Keywords: Tumor-derived nanovesicles, Breast cancer, Lung metastasis, Kupffer cells, Phagocytosis, Nucleolin, Cell surface, Ca2+ flux, and DOTAP/DOPE liposome
Introduction
Metastasis accounts for the majority of breast cancer deaths [1]. There is a critical need for developing effective new therapies against breast cancer metastasis [2]. Currently, chemotherapeutic agents including cisplatin, doxorubicin (Dox), and paclitaxel are widely used for the treatment of advanced breast cancer. However, these effective antiproliferative agents are limited by their toxicities [3], and direct and specific targeting of tumor cells has been elusive [4, 5].
Viral vectors have been used as carriers but suffer from their potential immunologic side effects and toxicity as well as size limitations [6]. Nanovesicles have been investigated for more than half a century, but their widespread applications in medical research and in the development of novel therapeutic modalities have been limited due to their instability, susceptibility to degradation, insufficient translatability, and immunostimulatory effects [7, 8]. Recent advances in the delivery of chemotherapeutic agents to tumor cells by contemporary biomaterials and nanotechnologies include protamine complexes, lipid nanoparticles, cationic polymeric nanoparticles, lipid-polymer hybrid nanoparticles, and gold nanoparticles [9-13]. However, several challenging issues remain unresolved, such as enzymatic degradation, uptake and elimination by macrophages, as well as poor specific tissue targeting.
Exosomes are cell-derived small extracellular vesicles containing RNAs and proteins. As intracellular communicators, exosomes are involved in immune response, neurodegenerative disorders, and tumor progression. Therefore, exosomes, as potential nanovesicles, have become the focus of exponentially growing interest [14]. However, most of the exosome studies are limited to the preclinical stage due to poor chemical and physical stability. The use of synthetic or polymeric components to deliver active molecules to target sites has contributed significantly to the treatment of diseases and some such products are in clinical trials [15]. The synthetic cationic lipid 1, 2-dioleoyl-3-trimethylammonium-propane (DOTAP), which forms liposomes when combined with phospholipids, is extensively used to encapsulate anti-tumor agents [16, 17].
Majority of exogenous nanoparticles preferentially go to the liver and are rapidly uptaken by macrophages [18]. Kupffer cells represent 80-90% of all tissue macrophages in the body are involved in the capture and clearance of foreign materials [19, 20]. A major challenge is to develop strategies that will allow nanoparticles to escape elimination by macrophages. Expression of “don't eat me” signal CD47 on exosome surface has been reported to effectively inhibit the function of phagocytic cells [21]. However, developing an easy strategy with less expensive materials is still a challenge. A recent study demonstrated that exosomes from peripheral blood can block the uptake of DOTAP nanovesicles loaded with chemotherapeutic agents by Kupffer cells, leading to the accumulation of nanovesicles in the lung and reducing breast cancer lung metastasis [22]. However, tumor-derived nanoparticles have the risk of advancing tumor development [23-25]. Horizontal information transfer by exosomes from the tumor to local or distant body sites facilitates tumor growth and metastasis. Allotransplantation of nanoparticles from healthy people poses the risk of allograft rejection [26]. These challenges limit extensive use of exosomes in the clinic. Thus, nanovesicles as a delivery strategy still require substantial improvement.
We generated exosome-like nanovesicles (ENVs) from exosomes released by tumor cells that were resistant to Kupffer cells uptake and could effectively carry chemotherapeutic drugs against tumor metastasis. Unlike tumor-derived exosomes, which can potentially promote tumor progression and metastasis, ENVs retain lipids of the exosomes and exclude other contents that might foster tumor advance and metastasis, thus effectively delivering their contents without adverse effects and serve as drug delivery vehicles. Furthermore, we report that tumor-derived ENVs inhibit phagocytosis by macrophages through reduction of nucleolin on the macrophage cell surface.
Materials and Methods
Mice
8- to 12- week old female BALB/c mice were purchased from the Jackson Laboratory (Bar Harbor, ME). All mice were housed under specific pathogen-free conditions. Animal care was performed following the Institute for Laboratory Animal Research (ILAR) guidelines, and all animal experiments were done in accordance with protocols approved by the Nanjing Medical University Institutional Animal Care and Use Committee (Nanjing, China).
Cells
Murine mammary metastatic carcinoma 4T1 cells, nonmetastatic tumor 67NR cells, murine macrophages RAW264.7, and murine hepatocytes H2.35 were obtained from the American Type Culture Collection (Manassas, VA, USA). 4T1, 67NR, and H2.35 cells were cultured in Dulbecco's modified Eagle's medium (DMEM) (Gibco). RAW264.7 cells were grown in RPMI 1640 (Gibco) medium, supplemented with 10% heat-inactivated fetal bovine serum (FBS), 100 U/mL penicillin, and 100 μg/mL streptomycin at 37 °C in 5% CO2.
Antibodies and reagents
The following rabbit anti-mouse antibodies purchased from Abcam were used for Western blotting: Nucleolin (ab22758), EGFR (ab52894), CD36 (ab133625), IFNγ (ab133566), TLR3 (ab62566), Fibrillarin (ab5821), Cytochrome C (ab133504), F4/80 (ab100790), β-actin (ab8227), and GAPDH (ab181602). The goat anti-rabbit lgG-Alexa Fluor 488 (Cat. # A27034) was purchased from Thermo Fisher for immunofluorescence. The FITC-F4/80 (Cat# 123108) antibodies purchased from Biolegend were used for flow cytometry.
Isolation, purification, and characterization of exosomes
To exclude nanovesicles contamination in the cell culture medium, FBS was centrifuged at 100,000 x g overnight at 4 ºC, and the supernatant was collected. To isolate exosomes from the cell culture medium, 1x10⁷ of 4T1 cells were grown in 10 mL of DMEM supplemented with 10% heat-inactivated nanovesicle-depleted FBS, 100 U/mL penicillin, and 100 μg/mL streptomycin at 37 ºC in 5% CO2 for 48 h. The medium was collected and centrifuged at 1,000 x g for 10 min, 2,000 x g for 20 min, 4,000 for 30 min and 10,000 x g for 1 h with supernatant retained each time. The exosomes were collected by centrifuging the samples at 100,000 x g for at least 2 h at 4 °C and further purified on a sucrose gradient (8, 30, 45 and 60% sucrose in 20 mM Hepes, 20 mM Tris-Cl, pH 7.2). Size distribution and concentration of exosomes were analyzed using a Zetasizer Nano ZS (Malvern Instrument, UK) and NanoSight NS300 (Westborough, MA) with flow speed at 0.03 mL per min. The isolated exosomes were further purified on a sucrose gradient (8, 30, 45, and 60% sucrose in 20 mM Tri-Cl, pH 7.2) followed by centrifugation at 100,000 x g for 1.5 h at 4 ºC. Purified exosomes were fixed and imaged under a Zeiss EM 900 electron microscope using a method as described. Size distribution of exosomes was analyzed at a flow rate of 0.03 mL per min using a Zetasizer Nano ZS (Malvern Instrument, UK).
Preparation of exosome-like nanovesicles (ENVs)
To prepare ENVs, the 4T1 exosome-derived lipids were obtained by extraction with chloroform and dried under vacuum. 200 nM of lipid was suspended in 200-400 μL of phosphate-buffered saline (PBS). After a bath sonication (FS60 bath sonicator, Fisher Scientific) at 4 ºC for 30 min, the pelleted ENVs were collected by centrifugation at 100,000 x g for 1 h at 4 ºC. Purified ENVs were fixed and imaged under a Zeiss EM 900 electron microscope. Briefly, isolated ENVs in PBS were fixed in 2% paraformaldehyde (Electron Microscopy Science, PA) in PBS for 2 h at room temperature followed 1% Glutaraldehyde (Electron Microscopy Science, PA) for 30 min at room temperature. 15 µL of fixed samples were put on 2% agarose with formvar/carbon-coated nickel grids on top and allowed to absorb for 5-10 min. The grids with adherent ENVs were fixed in 2% paraformaldehyde in PBS for 10 min followed by extensive washing in PBS. Negative contrast staining was performed with 1.9% methylcellulose and 0.3% uranyl acetate for 10 min. The grids with negatively stained ENVs were dried and examined for morphology and size in a Zeiss EM 900 electron microscope.
Incorporating doxorubicin into DOTAP/DOPE liposome
Cationic, 2-dioleoyl trimethylammonium propane (DOTAP) / 1, 2-dioleoyl-sn-glycerol-3-phosphoethanolamine (DOPE) liposomes (DDL) (50:50 mol/mol) from Avanti (Alabama) were mixed with doxorubicin (Dox) in chloroform and dried with a rotary evaporator. The dried lipids-complex was suspended in PBS and assembled into DDL/Dox by sonication (FS60 bath sonicator, Fisher Scientific) for 20 min. DDL with or without Dox was purified by centrifugation at 100,000 x g for 1 h.
Thin layer chromatography (TLC) and lipidomic analysis
Total lipid extraction of exosomes was performed using 1 part chloroform and 2.5 parts methanol. After centrifugation at 2,000 x g for 10 min, the lower organic phase was collected and dried under nitrogen (2 psi). Lipids extracted as described above were separated with a silica gel 60Å TLC plate (Whatman) and developed in a mixture of hexane/ethyl acetate/formic acid=55:40:5. For analysis of lipids extracted from ginger, ginger micro-particles, and GDN, TLC was developed with a mixture of toluene-ethyl acetate (3:1, v/v). Developed plates were initially air-dried. The lipid bands were visualized with iodine vapor and identified by mass spectrometry (MS).
Imaging of nanoparticles trafficking in vivo
To monitor ENVs and liposome trafficking in vivo, nanoparticles were first labeled using a near-infrared lipophilic carbocyanine dye-dioctadecyl-tetramethylindotricarbocyanine iodide (DiR, Invitrogen). In brief, nanoparticles were incubated with the DiR dye (40 µg ENVs or liposomes in 1 mL PBS) containing 3.5 µg/mL dye for 30 min at 37 °C. DiR dye-labeled nanoparticles were then washed twice with PBS. Each BALB/c mice (n=5) received 40 µg DiR-labeled nanoparticles administered intravenously via the tail-vein. The labeled nanoparticles in mice were visualized using a Carestream Molecular Imaging system (Carestream Health, Woodbridge, CT).
In vivo tumor growth, chemotherapy, and metastatic assays
To generate a breast tumor metastasis model, 1.0×10⁵ 4T1 cells were injected in the mammary fat pads of mice (n=5) in a volume of 50 µL of PBS. Tumors were measured every three days and volume was calculated using the previously described method [14]. For evaluating the effects of doxorubicin with or without pretreatment of 4T1 ENVs, five days after tumor injection, mice were injected via tail vein (intravenous (i.v.)) DDL with or without Dox (5mg/kg) twice weekly for eight doses. To measure the level of alanine aminotransferase (ALT) and aspartate aminotransferase (AST) as drug-related liver toxicity, 100 µL of serum was loaded on Piccolo® Lipid Panel Plus (Abaxis, Inc. Union City, CA) and the concentration of ALT and AST was automatically tested and calculated with Piccolo Xpress® chemistry analyzer (Abbott Point of Care Inc. Princeton, NJ).
Labeling nanoparticles with PKH26
Nanoparticles were labeled using PKH26 Fluorescent Cell Linker Kit (Sigma) in accordance with the manufacturer's instructions. Nanoparticles were suspended in 250-500 µL of diluent C with 2-4 µL of PKH26 and subsequently incubated for 30 min at room temperature. After centrifuging for 5 min at 13,000 x g at 4 ºC, labeled nanoparticles were resuspended for further experiments.
Quantitative Real-Time PCR for mRNA expression
Total RNA was isolated from cells and tissues using the mRNeasy mini kit (Qiagen). For analysis of gene mRNA expression, 1 µg of total RNA was reverse transcribed by SuperScript III reverse transcriptase (Invitrogen) using SsoAdvancedTM Universal SYBR Green Supermix (BioRad) and primers listed in Table S7 and quantitated. qPCR was performed using the BioRad CFX96 qPCR System with each reaction done in triplicate. Analysis and fold-changes were determined using the comparative threshold cycle (Ct) method. The change in mRNA expression was calculated as fold-change.
Liver macrophage depletion
Mice were injected intraperitoneally with approximately 110 mg/kg of clodronate liposomes (FormuMax Scientific Inc.) or an equal volume of PBS. The injection was repeated three days later and experiments were performed 1 day after the second injection.
Histological Analysis
Tissues were fixed with buffered 10% formalin solution (SF93-20; Fisher Scientific, Fair Lawn, NJ) overnight at 4 °C and dehydrated by immersing in a graded ethanol series, 70%, 80%, 95%, 100% ethanol for 40 min each. Tissues were embedded in paraffin and subsequently cut into ultra-thin slices (5 μm) using a microtome. Tissue sections were deparaffinized by xylene (Fisher) and rehydrated by decreasing concentrations of ethanol and PBS, stained with hematoxylin and eosin (H&E) and scanned with an Aperio ScanScope. For tissue immunofluorescent staining, slides were washed three times (5 min each) with PBST (PBS, 0.1% Tween 20). The tissue was permeabilized by incubating the slides in 1% Triton X-100 in PBS at 25 °C for 15 min and then washed three times in PBST. After blocking for 1 h at 25 °C in blocking buffer (PBS containing 10% bovine serum albumin (BSA)), slides were incubated overnight in a humidity chamber with anti-F4/80 polyclonal antibody (Thermo Fisher). Antibodies were diluted 1:50 in blocking buffer. Following three PBST washes, slides were incubated with Alexa 488-conjugated secondary antibody at a 1:500 dilution (Invitrogen). Slides were then washed and nuclei counterstained with DAPI.
Isolation of Kupffer cells
To isolate Kupffer cells from liver tissue, a 20-G catheter was inserted into the portal vein of anesthetized mice. The inferior vena cava was cut to allow the pre-warmed (37 °C) perfusion buffer (Ca2+-Mg2+free HBSS containing 0.5 mM EGTA, 10 mM HEPES and 4.2 mM NaHCO3; pH 7.2) to flow freely through the liver. The liver was perfused 7-10 mL/min until there was no evidence of blood in the spent perfusion medium. The liver was then perfused for 5 min with dissociation buffer (HBSS containing 10mM HEPES and 4.2 mM NaHCO3 supplemented with Type I collagenase (0.05%) and trypsin inhibitor (50 μg/mL); pH 7.5) pre-warmed at 37 °C. The perfused livers from mice were removed and gently pressed through nylon cell strainers (70 µM in diameter, Fisher Scientific) to obtain single-cell suspensions in RPMI-1640 containing 5% FBS. Hepatocytes were removed from liver-cell suspensions by colloidal silica particle (Percoll, Invitrogen) gradient centrifugation in phosphate-buffered saline. Erythrocytes in liver-cell suspensions were then removed using ammonium-chloride-potassium (ACK) lysis buffer (0.15 M NH4Cl, 10 mM KHCO3, 0.1 mM EDTA). To purify the obtained cell population further, selective adherence to plastic was used [27]. The cells were then seeded into 6-well plate at a density of 1-3 × 10⁷/well in DMEM and incubated for 2 h at 37 °C. Non-adherent cells were then removed from the dish by gently washing with PBS and the adherent cells were Kupffer cells.
Preparation of protein extracts from cells
At the appropriate time after treatment, cells were harvested and washed twice with cold PBS, and nuclear and cytoplasmic extracts were prepared according to the following procedure: Cells were incubated with 300 μl of ice-cold extraction buffer B (10 mM HEPES, pH 7.9, 1.5 mM MgCl2, 10 mM KCl, 1 mM phenylmethylsulfonyl fluoride, 1 μg/mL leupeptin, 1 μg/mL aprotinin) and lysed by three cycles of freeze-thaw. Samples were centrifuged at 12,000 x g for 1 min and cytoplasmic extracts were recovered as supernatant. The resultant pellets (nuclei) were resuspended in 100 μl of buffer C (20 mM HEPES, pH 7.9, 1.5 mM MgCl2, 420 mM KCl, 0.2 mM EDTA, 25% glycerol, 1 mM phenylmethylsulfonyl fluoride, 1 μg/mL leupeptin, 1 μg/mL aprotinin). Following 30 min of incubation at 4 °C, samples were centrifuged at 12,000 x g for 5 min and nuclear extracts were collected as supernatant. Extracts were either used immediately or stored at -80 °C. To obtain whole cell lysates, cells were mixed with 500 μl of radioimmunoprecipitation assay buffer (RIPA buffer) containing the complete protease inhibitor cocktail (Roche Diagnostics, Mannheim, Germany). The cell lysates were incubated for 30 min on a shaker at 4 °C, centrifuged at 12,000 x g for 10 min, and the supernatants were obtained for additional experiments. The concentration of extracted proteins was determined using the Coomassie Plus Protein Assay Reagent (Pierce).
Immunofluorescence for cell surface nucleolin
5×10³ of cells were plated in eight-well chamber slides (BD Falcon) and allowed to adhere overnight. After treatment with ENVs for the time indicated in figures, cells were washed with PBS and fixed using 3.7% paraformaldehyde (PFA) in PBS for 15 min at room temperature (RT). After washing with PBS, the cells were blocked with 5% normal goat serum in PBS for 1 h. Subsequently, the cells were incubated with 6.7 µg/mL (1:30) of anti-nucleolin IgG in PBS containing 2% normal rabbit serum overnight at 4 °C in a humid chamber, then incubated with Alexa Fluor 488 goat anti-rabbit lgG (Invitrogen) at 10 µg/mL (1:200) in PBS containing 5% BSA for 1 h at room temperature (keep out of light), and finally washed three times with PBS. The slides were mounted with ProLong Gold Antifade Reagent (Invitrogen, Carlsbad, CA) and visualized with a fluorescence microscope (Olympus, Tokyo, Japan).
FACS analysis of cell surface nucleolin
1×10⁶ RAW264.7 cells were washed in PBS and incubated in 50 µL of staining buffer (PBS with 2% FBS and 0.1% sodium azide) containing anti-nucleolin antibody at 40 µg/mL for 30 min on ice. Cells were washed with 2 mL of staining buffer and incubated with Alexa Fluor 488 goat anti-rabbit antibody (1:10) in 50 µL of staining buffer for 30 min on ice (protected from light). Normal rabbit lgG was used as the isotype antibody control. The cell pellet was washed in 2 mL of staining buffer twice and then incubated with propidium iodide (PI, Sigma, 1 µg/mL) in staining buffer for 10 min at 4 °C. After extensive washing, the cell pellet was suspended in 1 mL of staining buffer and processed for analysis by FACScalibur flow cytometry (BD). For each sample, 10,000 viable cells were gated following size (forwardscatter: FSC) and granularity (side scatter: SSC) parameters. Data were analyzed using FlowJo software (Tree Star Inc., Ashland, OR). Dead cells were excluded from analysis by gating on PI-negative cells (viable cells).
Biotinylation and Purification of cell surface proteins
The Cell Surface Protein Isolation Kit (Pierce, Rockford, IL) was used to label and purify cell surface proteins. For cell surface expression analysis, four T75 flasks of 90%-95% confluent RAW264.7 cells were washed two times with cold PBS and incubated with 10 mL of PBS containing 0.25 mg/mL EZ link Sulfo-NHS-SS-Biotin for 30 min at 4 °C. The biotinylation reaction was terminated by adding 500 µL of Quenching Solution. All four flasks of cells were scraped and transferred to a single 50 mL conical tube. Cells were washed two times with 5 mL TBS (0.1 M sodium phosphate, 0.15 M NaCl, pH7.2) and lysed in 500 µL of lysis buffer for 30 min on ice. To improve solubilization efficiency, cells were ultrasonicated twice on ice using a sonic dismembrator (550 Sonic Dismembrator, Fisher Scientific, Pittsburgh, PA) and vortexed every 5 min for 5 s. The lysates were centrifuged at 10,000 x g for 2 min at 4 °C and incubated with 500 µL of washed Immobilized NeutrAvidin Gel in the column for 60 min at room temperature with end-over-end mixing using a rotator. The flow-through was obtained by centrifuge column for 1 min at 1,000g. After washing three times, the bound biotinylated proteins were eluted from Immobilized NeutrAviding Gel using 400 µL of the Samples Buffer (62.5 mM Tris·HCl, pH 6.8, 1% SDS, 10% glycerol, 1 M DTT).
Western blot analysis
Samples were incubated in SDS-loading buffer at 95 °C for 5 min and separated by 8% sodium dodecyl sulfate-polyacrylamide gel electrophoresis (SDS-PAGE) followed by electroblotting to polyvinylidene difluoride membrane (Bio-Rad). After blocking nonspecific binding sites for 1 h in 5% nonfat dried milk in PBST (0.05% Tween 20 in PBS), the membrane was incubated for 1 h at room temperature or overnight at 4 °C with primary antibody. After three washes in PBST, the membrane was incubated with horseradish peroxidase-conjugated goat anti-mouse antibody for 45 min at room temperature, washed three times in PBST, and detected using enhanced chemiluminescence (ECL kit from Amersham Biosciences).
Flow cytometry analysis of intracellular Ca2+ in RAW264.7 cells
Flow cytometry analyses of Ca2+ in RAW264.7 cells were performed as described previously with slight modifications [28]. Briefly, untreated and treated RAW264.7 cells were trypsinized and resuspended at a density of 1×10⁵ cell/mL in DMEM medium containing 1% (V/V) FBS and 5 µM Fluo-4-AcetoxyMethyl ester (Fluo-4-AM) (Molecular Probes, OR) and incubated for 30 min at 37 °C in the dark. The cells were then centrifuged at 200 x g for 5 min, washed with the medium four times and resuspended in 1 mL of medium containing 1% FBS prior to FACS analysis. Relative intracellular Ca2+ was performed by measuring the fluorescence intensity of the calcium indicator in solutions complexed with calcium compared with the minimum fluorescence intensity obtained by incubating cells in the presence of 2mM EGTA. Fluo-4-AM is a lipophilic Ca2+ indicator that penetrates through the cytoplasmic membrane and is hydrolyzed by intracellular esterases to the hydrophilic dye Fluo-4 which has fluorescence excitation at 488. Dead cells are excluded from analysis by gating on PI-negative cells (viable cells).
Fluo-4 imaging of intracellular Ca2+ in RAW264.7 cells
5×10³ RAW264.7 Cells were plated in 8-well chamber slides (BD Falcon). After treatment with ENVs for 24 h, cells were washed and incubated for 45 min at room temperature with 2 µM Fluo-4-AM prepared in PBS containing 0.1% FBS and subsequently washed three times with PBS. The slides were mounted with ProLong Gold Antifade Reagent (Invitrogen, Carlsbad, CA), and visualized with a fluorescence microscope (Olympus, Tokyo, Japan).
Overexpression of nucleolin in RAW264.7 cells
Transduction of nucleolin CRISPR/dCas9 lentiviral activation particles (>1x10⁷IU/mL) (Santa Cruz, CA) was utilized to overexpress nucleolin in macrophage RAW264.7 cells according to the manufacturer's instructions. Briefly, 3x10⁵ cells were seeded in a 6-well culture plate with 1 mL of RPMI-1640 medium. After 24 h, cells were infected by adding 10 µL of the nucleolin activation lentiviral particles or control lentiviral activation particles to the culture and incubated for 24 h. The medium was replaced with standard medium and incubated for two more days for further analysis.
Nucleolin RNA Interference
One day prior to transfection, 1.0×10⁶ RAW264.7 cells were plated in T75 flask in 15 mL of DMEM without antibiotics. For each transfection, 180 pmol of nucleolin Stealth RNAi SelectTM (Cat# NCL-HSS181448, Invitrogen, Carlsbad, CA) or Stealth RNAi Negative Control (Cat# 12935-300, Invitrogen, Carlsbad, CA) was diluted in 1.5 mL of Opti-MEM (Invitrogen, Carlsbad, CA). In a separate tube, 30 μL of Lipofectamine RNAiMAX (Invitrogen, Carlsbad, CA) was diluted in 1.5 mL Opti-MEM. The diluted RNAi duplex and diluted Lipofectamine RNAiMAX were mixed gently and incubated for 20 min at room temperature. The RNAi duplex-RNAiMAX complexes were then added to each flask containing cells and medium. Cells were incubated at 37℃ in the presence of the transfection solution until ready to process for Western blotting 48 h post-transfection.
Electrophoresis and silver staining
Immunoprecipitated protein samples were incubated in 1×SDS-loading buffer at 95 °C for 5 min and separated on 10% polyacrylamide-SDS gels. Silver staining was performed as described previously [29] with the following modifications. The gel slab after electrophoresis was fixed in 50% methanol, 5% acetic acid, for 30 min with rotation. Then the gel was sensitized with 0.02% sodium thiosulfate for 2 min. After washing 3 times with distilled water for 5min per wash, the gel was incubated in 0.1% silver nitrate solution for 30-60 min at 4℃. After washing twice for 1 min per wash with distilled water, the gel was developed in 0.04% formalin, 2% sodium carbonate until the desired intensity of staining was achieved. Development was terminated with 1% acetic acid solution.
Protein identification by proteomic analysis by MALDI-TOF-MS
In-gel trypsin digestion was carried out as described [29] with the following modification. Briefly, protein bands were excised and incubated in 50 mM NH4HCO3/50% acetonitrile at room temperature for 15 min. The gel pieces were allowed to swell by incubating with 20 mM DTT in 0.1 M NH4HCO3 for 45 min at 56℃. After removing the DTT solution, the gel was incubated in 55 mM iodoacetamide in 0.1 M NH4HCO3 for 30 min in the dark. The gel was rinsed with 50 mM NH4HCO3 and incubated in 50 mM NH4HCO3/50% acetonitrile again to shrink. After drying in speedvac, an aliquot of 25 μg/mL sequencing-grade trypsin in 50 mM NH4HCO3 was added. After 45 min incubation on ice, the supernatant was discarded and replaced with 20 μl of 50 mM NH4HCO3. Digestion was carried out at 37℃ overnight and fragmented peptides were extracted from the gel with 5% formic acid/50% acetonitrile. To improve the ionization efficiency of MALDI-TOF-MS, ZipTipC18 (Millipore, Bedford, MA, USA) was used to purify peptides before MS analysis. Purification was according to the manufacturer's manual with no modification. The peptides were eluted with 2 μl of 5 mg/mL α-cyano-4-hydroxycinnamic acid in 50% acetonitrile/0.1% trifluoroacetic acid and applied directly onto the target and allowed to air dry. Peptide mass fingerprints were obtained by using a PE Biosystems MALDI-TOF mass spectrophotometer (Voyager DE-STR). The Mascot program (Matrix Science, http://www.matrixscience.com/search_form_select.html) was used to interpret MS spectra of protein digests.
Macrophage phagocytosis assay
Macrophage RAW264.7 cells were cultured at 37 °C in the presence of 10 µM cytochalasin D (phagocytosis inhibitor) or 4T1-derived ENVs at 0.1mg/mL for 1 h before the addition of green fluorescence (FITC)-labeled dextran for an additional 6 h. After washing with PBS, the cells were fixed with 2% paraformaldehyde in PBS for 20 min at 22 °C. The FITC positive bacteria were detected by flow cytometry using a BD FACSCalibur (BD Biosciences, San Jose, CA) and data were analyzed using FlowJo software (Tree Star Inc., Ashland, OR).
Quantification and statistical analysis
Unless otherwise indicated, all statistical analyses in this study were performed with SPSS 16.0 software. Data are presented as mean ± SD. The significance of mean values between two groups was analyzed using the Student's t-test. The differences between individual groups were analyzed by one- or two-way ANOVA test. The differences were considered significant when the p value was less than 0.05 or 0.01.
Results
Uptake of 4T1-derived ENVs by Kupffer cells
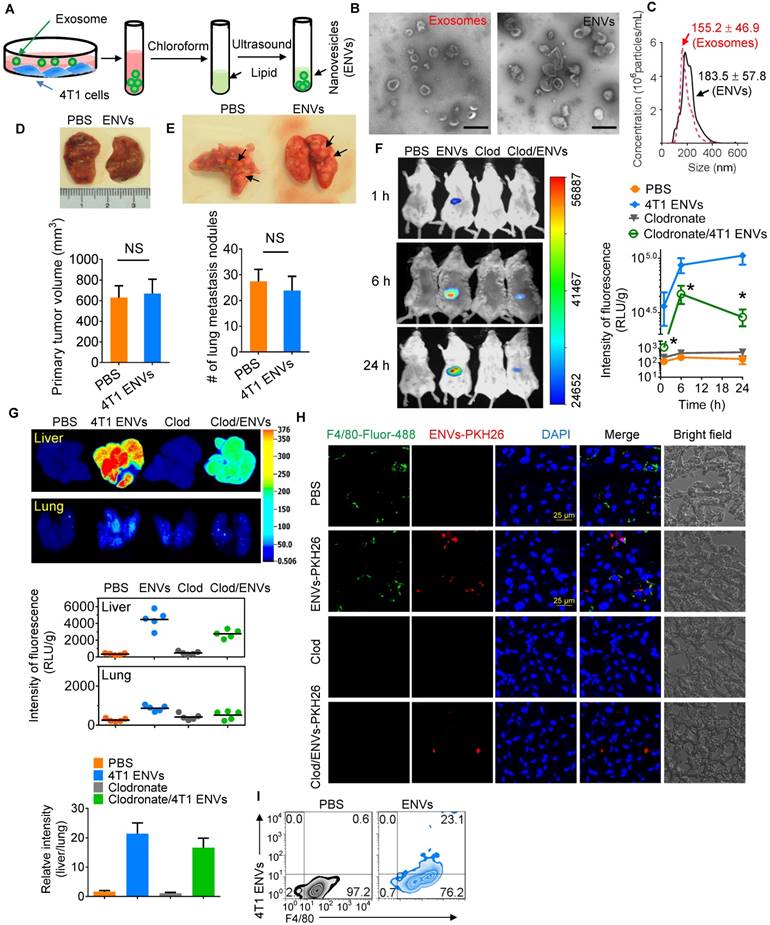
Recent evidence has indicated that serum-derived exosomes can block the biological activities of Kupffer cells leading to altered tissue distribution of the nanovectors [22]. To investigate whether tumor-derived nanovesicles contribute to tumor development, highly metastatic 4T1-derived exosomes were administered to 4T1 tumor-inoculated mice. We found that 4T1-derived exosomes promoted tumor metastasis to the lung (Supplementary Fig. 1A-B). To exclude the adverse effect of tumor-derived nanovesicles, lipids were extracted from 4T1-derived exosomes and designated as ENVs (Figure 1A). The morphology and size distribution of ENVs were evaluated using electron microscopy (Figure 1B) and NanoSight NS300 analysis (Figure 1C), respectively. Based on electron microscopic examination of an 8%/30% sucrose gradient purified band as well as size distribution 4T1-derived ENVs had a diameter of 183.5 ± 57.8 nm (means ± standard deviation of the mean (SD)). There was no evidence to suggest that 4T1 ENVs promoted 4T1 primary tumor growth (Figure 1D) or lung (Figure 1E) or liver metastasis (Supplementary Fig. 1C). Since recent evidence indicated that exogenous exosomes could be taken up by Kupffer cells in the liver, we administered 4T1 ENVs labeled with DiR dye by i.v. tail injection and analyzed the distribution using an in vivo imaging assay. The data demonstrated that a strong fluorescent signal of DiR+ENVs could be detected in the liver of mice 24 h after intravenous injection of ENVs (Figure 1F, G). To address whether ENVs were taken up by Kupffer cells, mice were treated with clodronate liposomes to deplete macrophages before the i.v. injection of ENVs (Supplementary Fig. 2A, B). Depletion of macrophages (Figure 1F, G) reduced the distribution of ENVs in the liver as was evident in histological sections (Figure 1H, Supplementary Fig. 2C). Fluorescence microscopy (Figure 1H) and fluorescence-activated cell sorting (FACS) (Figure 1I) revealed that ENVs were taken up by F4/80+ macrophages but not hepatocytes in the liver and very little of ENVs distributed to the lung (Figure 1F, G). Thus, these data indicated that 4T1-derived ENVs lacked the effect of 4T1-derived exosomes on tumor progression but could be recognized by Kupffer cells.
Uptake 4T1 exosome-like nanovesicles (ENVs) by Kupffer cells. (A) Schematic representation of 4T1 ENVs preparation from 4T1 exosomes. (B) Representative electron microscopic images of 4T1 exosomes (left) and 4T1 ENVs (right). Scale bar, 200 nm. (C) Size distribution of 4T1 exosomes and 4T1 ENVs using NanoSight NS300 (Westborough, MA) with flow speed at 0.03 mL per min. (D-E) Representative images of 4T1 breast primary tumors (D, top) and lungs (E, top, metastatic nodules indicated by arrows) from tumor-bearing BALB/c mice (n=5) at 21 d subjected to breast pad injection of 1x10⁶ 4T1 tumor cells along with 4T1 ENVs (0.5g/kg, body weight, n=5) or PBS via intravenous (i.v.) injection. Quantification of primary tumor volume and metastasis nodule numbers (> 1 μM) (D-E, bottom). NS, no statistical significance, paired t-test. (F) BALB/c mice were i.v. injected with DiR dye-labeled 4T1 ENVs (50 pmol per mouse, n=5) 24 h after administration of clodronate. Intensity of fluorescence of ENVs in mice before and after treatments showing representative images (left) and mean intensity of fluorescence presented (right, mean net intensity/sum intensity/area, clodronate/ENVs vs ENVs, * p<0.05, t-test). (G) Representative images of liver and lung from BALB/c mice receiving a single intravenous injection of 0.5 g/kg DiR dye-labeled 4T1 ENVs at 6 h (top); quantification of fluorescence density (middle); comparison of fluorescence intensities between the liver and lung (bottom). (H) PKH26-labeled (red) 4T1 ENVs located in liver Kupffer cells (F4/80+, green) from BALB/c mice treated with clodronate for 24 h following i.v. injection of ENVs, visualized with confocal microscopy, assessed 1 d after administration of clodronate. (I) 4T1 ENVs labeled with fluorescence PKH26 subjected to RAW264.7 cells for 24 h. After washing with PBS, 4T1 ENVs/PKH26-positive macrophage cells estimated by FACS. Numbers in quadrants indicate percent cells in each throughout. Data are representative of three independent experiments (error bars, s.e.m.). NS, no statistical significance, *P < 0.05 (two-tailed t-test).
4T1 ENVs suppress DOTAP: DOPE liposomes (DDL) uptake by Kupffer cells
Recently, DOTAP incorporated with DOPE (DOTAP: DOPE) has been widely used for delivering chemotherapeutic drugs to tumors [30]. To prevent the elimination of nanoparticles by macrophages before they reach the tumor, we pretreated mice with 4T1-derived ENVs prior to administering DDL (Figure 2A). We hypothesized that Kupffer cells' uptake of the 4T1-derived ENVs would leave fewer Kupffer cells available for the uptake of DDL. We first i.v. injected DDL into mice. The labeled DDL could be detected in the liver of mice as early as 1 h and lasted at least to 24 h after DDL injection (Figure 2B). This signal of DDL in liver was eliminated by chemical depletion of Kupffer cells by clodronate and was also reduced by 4T1 ENVs (Figure 2B, C). Both phenomena could be visualized with fluorescence-conjugated anti-F4/80 antibody by confocal microscopy (Figure 2C, Supplementary Fig. 3A).
4T1 ENVs repress uptake of DOTAP:DOPE liposomes (DDL) by Kupffer cells. (A) In vivo experimental schema. Clodronate (110 mg/kg, body weight) was administrated to mice by i.v. twice. 0.5 g/kg of 4T1 ENVs were i.v. injected at day post clodronate injection. DDL (50 mM/kg) was administered 24 h after 4T1 ENVs pretreatment. (B) BALB/c mice were i.v. injected with DiR dye-labelled DDL (n=5). Intensity of fluorescence of DDL in mice after treatments; representative images (left) and mean intensity of fluorescence are presented (right, mean net intensity/sum intensity/area, ENVs/DDL vs DDL, * p<0.05, t-test). (C) PKH26-labeled (red) DDL located in liver Kupffer cells (F4/80+, green) from BALB/c mice treated with clodronate for 24 h following i.v. injection of ENVs, visualized with confocal microscopy, assessed 1 d after administration of DDL. Data are representative of three independent experiments. (D) A representative image of liver and lung from BALB/c mice receiving a single intravenous injection of DiR dye-labeled DDL for 6 h (top); quantification of fluorescence density (bottom, left and middle); comparison of fluorescence intensities between the liver and lung (bottom, right). (E) PKH26-labeled (red) DDL located in liver Kupffer cells (F4/80+, green) from BALB/c mice treated with 4T1 ENVs for 24 h following i.v. injection of DDL, visualized with confocal microscopy, assessed 1 d after administration of DDL. Numbers in quadrants indicate percent cells in each throughout. Data are representative of three independent experiments (error bars, s.e.m.). *P < 0.05 and **P < 0.01 (two-tailed t-test).
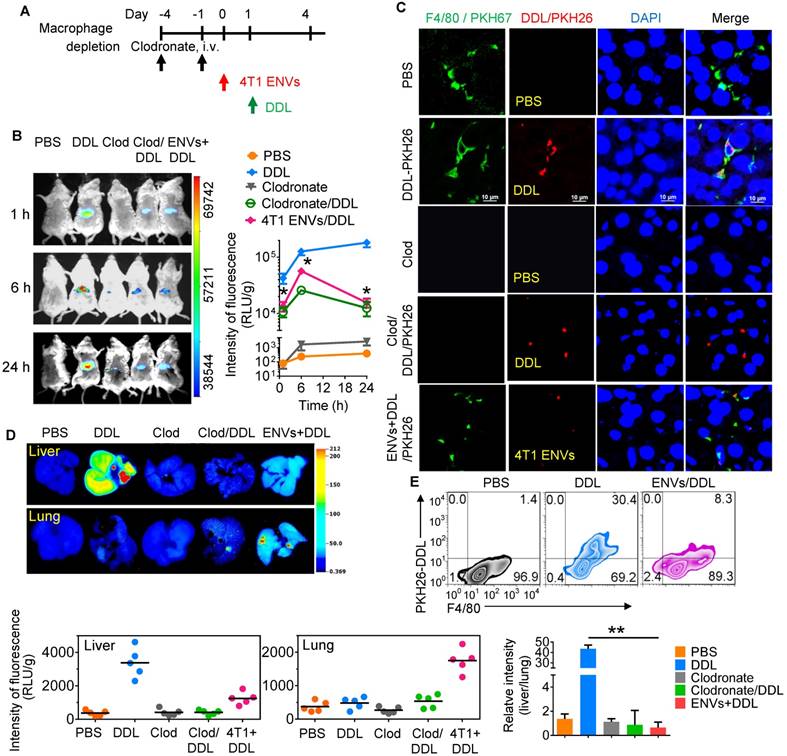
We next performed image analysis of the liver and lung by using the DiR dye-labeled DDL. Notably, we observed preferred accumulation of DDL in the liver but not the lung after i.v. administration. However, 4T1-derived ENVs decreased the distribution of DDL to the liver and apparently enhanced its distribution to the lung (Figure 2D). The uptake of DDL by F4/80+ Kupffer cells was reduced by 4T1 ENVs as confirmed by FACS (Figure 2E, Supplementary Fig. 3B, C). In vitro analysis also indicated that primary Kupffer cells pretreated with ENVs exhibited reduced phagocytosis of DDL (Supplementary Fig. 3D).
4T1-derived ENVs induce surface nucleolin of macrophage cells
Although our understanding of phagocytic uptake of nanoparticles by macrophages is relatively extensive, its underlying molecular mechanism remains obscure. To gain mechanistic insight into the biological effects of nanovesicles on macrophages, we performed comparative proteomic analysis to identify ENV-interacting surface proteins on macrophages. 4T1 ENVs were exposed to the RAW264.7 membrane protein extract and ENV-interacting proteins were collected by centrifugation and subjected to SDS-PAGE. A typical staining pattern of the 4T1 ENVs treated cell membrane extract on SDS-PAGE is shown in Supplementary Fig. 4A. Subsequently, in-gel digestion followed by MALDI-TOF mass spectrometry (MS) analysis was carried out for identification of the proteins from macrophage cell membranes that specifically bind to 4T1 ENVs. The analysis identified nucleolin as a potential protein induced by 4T1 ENVs (Supplementary Fig. 4B). We then estimated the expression of nucleolin in the total lysate of macrophages treated with highly metastatic 4T1 ENVs and nonmetastatic 67NR cells-derived ENVs by Western blotting (Figure 3A). There were no significant alterations of nucleolin expression in both 4T1 and 67NR ENVs treated macrophages. To investigate whether 4T1 ENVs altered distribution of nucleolin in nucleus and cytoplasm, 20 µg of nuclear and cytoplasmic extracts from RAW264.7 cells treated with 4T1 ENVs for 24 h were evaluated for nucleolin expression using Western blotting. The cytoplasmic marker GAPDH and nuclear marker fibrillarin were used to exclude the possibility of cross-contamination. Figure 3A shows that 4T1 ENVs did not alter the nuclear/cytoplasmic distribution of nucleolin.
4T1-derived ENVs induce surface nucleolin of macrophage cells. (A) Analysis of nucleolin in whole cell lysate, nuclear and cytoplasmic extracts of raw RAW264.7 cells (n=5) treated with 0.5g/kg (body weight) 4T1 ENVs (4T1) and 67NR cell-derived ENVs (67). 20 µg of extracts were analyzed by Western blotting (A, top) for nucleolin, then for β-actin (a control for equal loading). To assess the purity of the nuclear and cytoplasmic fractions, immunoblot analysis was done with anti-GAPDH as a cytoplasmic marker and anti-Fibrillarin as a nuclear marker. Quantification of results (A, bottom). (B) Western blot analysis of nucleolin on the cell surface of RAW264.7 macrophages and H2.35 hepatocytes treated with ENVs from 4T1 and 67NR cells at 6 h. (C) A representative Western blot analysis of cell surface nucleolin from RAW264.7 cells treated with ENVs from 4T1 and 67NR cells at 0 h, 1 h, 12 h, and 24 h. (D) RAW264.7 cells incubated with ENVs for 12 h. After partial fixation, cell surface nucleolin was investigated using mouse antibodies against nucleolin. Bound mouse antibodies were visualized by goat Alexa Fluor 488-conjugated anti-mouse antibodies. Experimental conditions are described under Material and Methods. (E) 1x10⁷ of RAW264.7 cells (top left) and H2.35 cells (top right) grown in complete medium were treated with 10 µg of 4T1 ENVs or 67NR ENVs for 0 h, 1 h, 12 h, 24 h, or 72 h. Cell surface nucleolin was analyzed by FACS as described in “Materials and Methods”. Dead cells were distinguished by excluding cells that had taken up PI, while other cellular debris were excluded by light-scatter gating. (bottom) Quantification of results at top. NS, no statistical significance, paired t-test. *P < 0.05 and **P < 0.01 (two-tailed t-test). Data are representative of three independent experiments (error bars, s.e.m.).
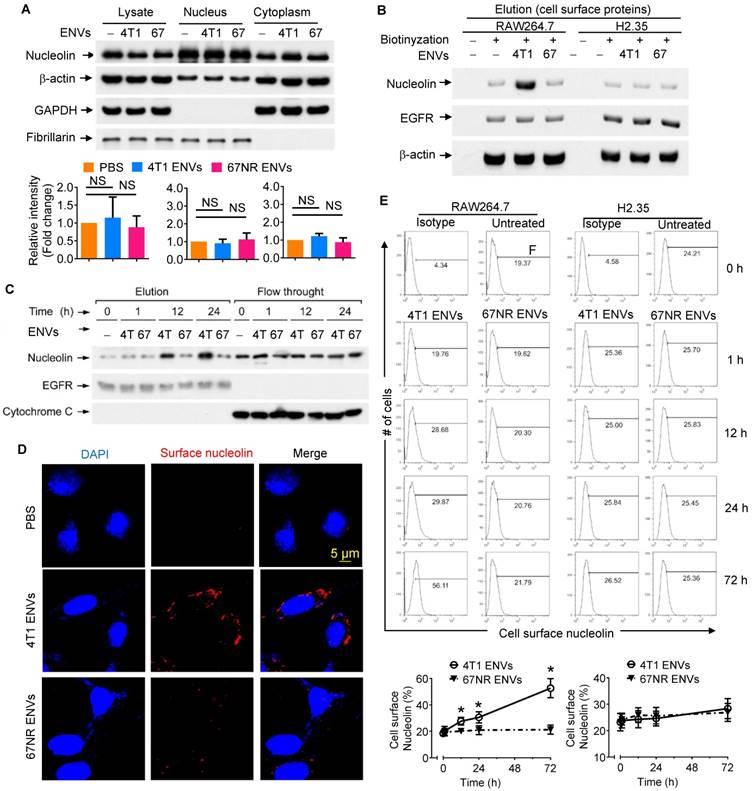
Although the altered distribution of nuclear/cytoplasmic nucleolin was not found, elevated expression of cell surface nucleolin on tumor-induced angiogenic vessels rather than mature vessels, led us to further assess systematically the distribution of cell surface nucleolin on 4T1 ENVs-treated RAW264.7 cells. Various strategies were employed to elucidate induction of cell surface nucleolin by 4T1 ENVs. Cell surface proteins were isolated from RAW264.7 macrophages with or without treatment with Sulfo-NHS-SS-Biotin. Collected fractions, including elution and flow-through, were analyzed by Western blotting. To prove that immobilized NeutrAvidin Gel separated biotinylated from nonbiotinylated proteins and to exclude the traces of cytoplasmic proteins, we probed the typical cell surface protein epidermal growth factor receptor (EGFR) and cytoplasmic protein cytochrome C in both flow-through and elution fractions of Avidin Gel pull-down (Supplementary Fig. 5). EGFR was identified in the elution fraction of cells treated with the biotin label. In contrast, EGFR was not present in the elution fraction of unlabeled cells; the unlabeled proteins were exclusively found in the flow-through. For the negative control, cytochrome C normally localized to the mitochondrial inter-membrane was identified in the flow-through, but not in the elution fraction of cells treated with the biotin label, demonstrating the specificity of the label for cell surface versus intracellular proteins. As shown by Western blotting (Supplementary Fig. 5A), only a minor fraction of the whole soluble cell lysate was biotinylated. The elevated expression of cell surface nucleolin on RAW264.7 cells treated with 4T1 ENVs for 24 h was verified by Western blotting (Figure 3B). Cell surface nucleolin was not altered on nonmetastatic 67NR ENVs-treated RAW264.7 cells or ENVs-treated hepatocytes H2.35 (Figure 3B). The expression of nucleolin was specifically altered by 4T1 ENVs in a time-dependent manner when RAW264.7 cells were treated by 4T1 ENVs (1 mM) for 0 h, 1 h, 12 h, and 24 h (Figure 3C). There was no evidence that ENVs affected nucleolin gene expression in RAW264.7 cells (Supplementary Fig. 5B) or distribution of nucleolin in hepatocytes H2.35 cells (Supplementary Fig. 6A-B).
To visualize the altered expression of cell surface nucleolin by immunofluorescence, RAW264.7 cells, exposed to 1 mM 4T1 ENVs and partially fixed with 3.7% PFA, were incubated with anti-nucleolin antibodies without permeabilization. An increased nucleolin signal on the cell surface was detected on 4T1 ENVs-treated cells but was absent on nonmetastatic 67NR ENV- treated cells (Figure 3D). These results were consistent with the cell surface biotinylation data shown in Figure 3B. We next analyzed the time-course of quantitative distribution of cell surface nucleolin on ENVs-treated cells by FACS analysis. As Figure 3E displays, treatment of RAW264.7 cells with 1 mM 4T1 ENVs significantly increased cell surface nucleolin in a time-dependent fashion. The earliest alteration was evident at 12 h after treatment and reached the maximum level 72 h after treatment. However, the amount of cell surface nucleolin was not altered on 67NR ENVs-treated control cells. We next determined whether the increased cell surface nucleolin originated from intracellular nucleolin, or whether nucleolin from the inner face of the plasma membrane translocated to the cell surface. To ascertain this, we isolated plasma membrane using differential centrifugation and sucrose gradient ultracentrifugation to measure the expression of nucleolin. As shown in Supplementary Fig. 6C, the expression of nucleolin on plasma membrane was not changed by treatment with 4T1 ENVs. These results indicated that the increased distribution of cell surface nucleolin on 4T1 ENVs-treated macrophages was due to the membrane nucleolin translocating from the inner face of the plasma membrane to the cell surface.
Intercellular Ca2+ fluxes induced by 4T1 ENVs are cell surface nucleolin dependent
Cell surface nucleolin has been previously shown to bind to the ectodomain of the receptor protein tyrosine phosphatase-sigma and to be involved in triggering Ca2+ entry. We hypothesized that increased expression of cell surface nucleolin by 4T1 ENVs might cause cell calcium fluxes. To test this idea, we measured fluorescence intensity by incubating cells with calcium indicator Fluo-4-AM using flow cytometry. Minimal fluorescence intensity obtained by incubating cells in the presence of 2 mM EGTA was subtracted as background.
As shown in the fluorescence histograms at various time points of 4T1 ENVs treatment (Figure 4A), Ca2+ flux was increased at 24 h after 4T1 ENVs treatment increasing the Ca2+ level from 14.09 ± 2.85 to about 29.69 ± 3.36 (p<0.05), then reached 36.40 ± 5.05 (p<0.05) at 72 h after treatment. In the controls consisting of PBS or ENVs-treated 67NR cells, no significant Ca2+ variations were observed (Figure 4A-B). In case of all statistic cells are from the gate of PI negative, it almost rule out the possibility of dead cell contamination due to intracellular fluorescence dye raising. Since the measurement of free cytosolic Ca2+ concentration using Fluo calcium indicators as Ca2+-sensitive dyes have been extensively used in different cell lines, we performed fluo-4 imaging of intracellular Ca2+ in RAW264.7 cells with fluorescence microscopy. As illustrated in Figure 4C, basal cytosolic Ca2+ signals in untreated cells were stable at low levels. However, treatment with 10 mM 4T1 ENVs for 24 h induced a significant cytosolic Ca2+ increase in RAW264.7cells. In contrast, the Ca2+ level was unchanged in the presence of control oligo 67NR ENVs. These results indicated that 4T1 ENVs caused Ca2+ entry into the RAW264.7 macrophage cells.
Intercellular Ca2+ fluxes induced by 4T1 ENVs are cell surface nucleolin dependent. (A) RAW264.7 cells incubated with 5 µM Fluo-4-AM treated with 4T1 ENVs or 67NR ENVs for 0 h, 24 h, and 72 h; the intracellular Ca2+ variations were visualized by Fluo-4-AM, an advanced fluorescent Ca2+ indicator using flow cytometry. (B) Quantification of results in A. 4T1 ENVs vs PBS, *p < 0.05. (C) Confocal microscopy showing variations of a typical fluorescence of intracellular Ca2+ imaging from RAW264.7 cells with fluorescent calcium indicator. (D) RAW264.7 cells were transfected with nucleolin siRNAs, control siRNAs, or incubated under the same conditions in the presence of transfection reagent for 48 h before treatment with 10 μM oligonucleotides. Then cell surface nucleolin was identified with biotinylation and Western blotting after 24 h treatment. EGFR was used as the loading control for isolated cell surface proteins (lower panels). The intensity of the cell surface nucleolin band in each sample was normalized to the corresponding EGFR band (bottom). (E) Cells were separated from the same experiment described above for analysis of intercellular Ca2+ with Fluo-4-AM by FACS. (F) TLC analysis of the lipid extracts from exosomes of 4T1 and 67NR cells. (G) RAW264.7 cells treated with lysophosphatidic acid (Lyso-PA) and vehicle as control. Analysis of nucleolin using Western blotting (top). Quantification of intensity (bottom). *P < 0.05 and **P < 0.01 (two-tailed t-test). Data are representative of three independent experiments (error bars, s.e.m.).
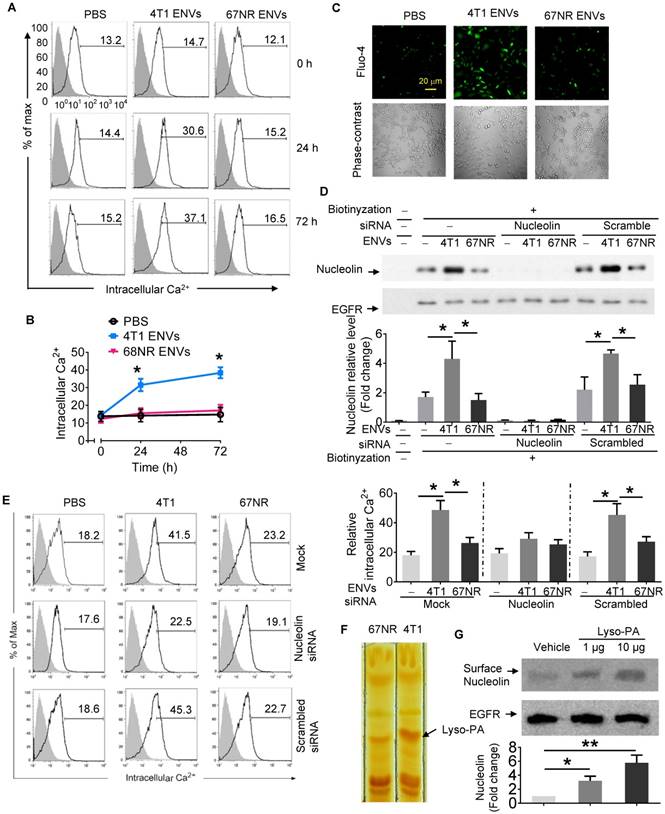
To determine whether induction of intercellular Ca2+ fluxes caused by 4T1 ENVs are nucleolin dependent, nucleolin was knocked down in RAW264.7 cells by transfecting the cells with nucleolin siRNA. Control cells were transfected with scrambled siRNA. Following transfection of nucleolin siRNA to knock down the expression of nucleolin, we analyzed the intercellular Ca2+ using Fluo-4-AM and cell surface nucleolin using biotinylation. Analysis of cell surface proteins indicated that, compared with control cells, nucleolin was significantly reduced in cells transfected with nucleolin siRNA (Figure 4D). As shown in Figure 4E, in addition to cell surface nucleolin, 4T1 ENVs could increase intercellular Ca2+ in RAW264.7 cells. However, intercellular Ca2+ in nucleolin knockdown cells didn't show a significant effect by 4T1 ENVs. No difference in the surface nucleolin expression or intercellular Ca2+ was observed in 67NR cells treated with 4T1 ENVs. These results suggested that the accumulation of cell surface nucleolin by 4T1 ENVs triggered Ca2+ entry into macrophage cells. To investigate the mechanism by which highly metastatic 4T1-derived ENVs but not nonmetastatic 67NR-derived ENVs induce cell surface nucleolin triggering intercellular Ca2+ flux, we compared lipid profiles from 4T1-derived ENVs and 67NR-derived ENVs using thin-layer chromatography (TLC) (Figure 4F). The lipid highly expressed in 4T1-derived ENVs was identified by mass spectrometry (MS) as lysophosphatidic acid (Lyso-PA). To determine whether Lyso-PA-induced cell surface nucleolin triggered Ca2+ flux, we treated macrophage cells with Lyso-PA and found that it could directly induce cell surface nucleolin (Figure 4G). Overexpression of nucleolin caused intracellular Ca2+ flux (Supplementary Fig. 6D, 6E). The decrease in nucleolin, on the other hand, inhibited the effect of 4T1 ENVs on phagocytosis by macrophages (Figure 5A).
4T1 ENVs repress phagocytosis of Kupffer cells by induction of cell surface nucleolin. (A) FITC-Dextran phagocytosis assay of RAW264.7 cells transfected with siNCL for 48 h and treated with cytochalasin D (phagocytosis inhibitor) 10 µM, 0.5g/kg 4T1 ENVs respectively. (B) Heat map depicting the expression of genes involved in phagocytosis in RAW264.7 cells using qPCR array; red and blue colors represent high and low levels of gene expression, respectively. (C) Selected genes from qPCR array verified with qPCR. (D) Expression of selected genes from qPCR array verified with Western blotting. (E) Macrophage RAW264.7 treated with ENVs (50 pmol per mouse, n=5) from 4T1 and 67NR cells. Cell viability was estimated with absorbance at 490 nm. (F) Representative dot plots of PI versus annexin V-FITC. RAW264.7 cells were incubated with 10 µM of 4T1 ENVs for 24 h, or 50 µM of hypochlorous acid (HOCl). Assessment of annexin V and propidium iodide (PI) was carried out by flow cytometry. Numbers in quadrants indicate percent cells in each throughout. (G) Fraction of the above treated cells was analyzed for cell surface nucleolin by flow cytometry. *P < 0.05 (two-tailed t-test). Data are representative of three independent experiments (error bars, s.e.m.).
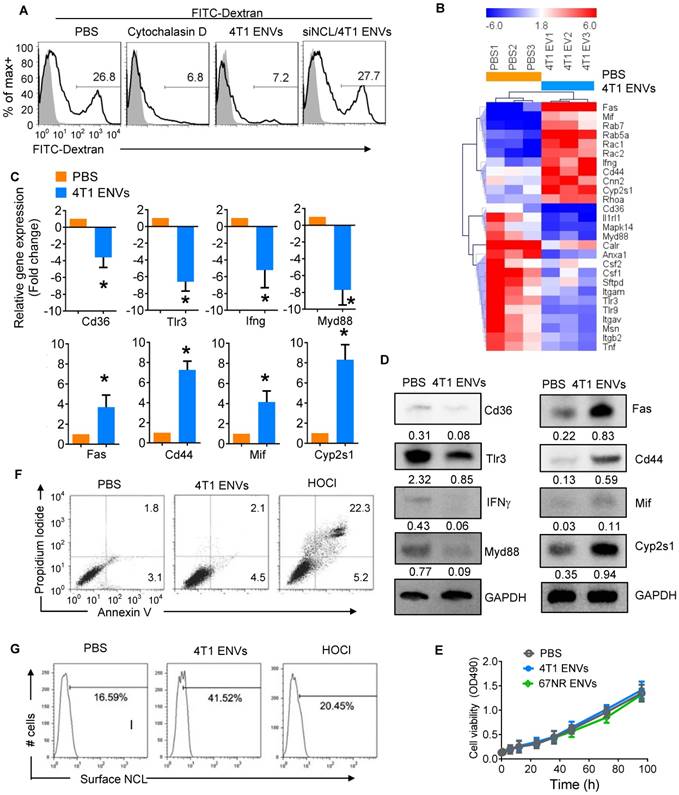
4T1 ENVs repress phagocytosis by macrophages mediated via cell surface nucleolin induction
We next assessed the effect of ENVs on phagocytic activity of RAW264.7 cells by monitoring FITC-Dextran uptake by FACS. We found that 26.8% of RAW264.7 cells were FITC-Dextran positive whereas the phagocytosis inhibitor cytochalasin D could inhibit the uptake of FITC-Dextran by RAW264.7 cells (Figure 5A). Similarly, 4T1 ENVs significantly inhibited phagocytosis of RAW264.7 and knockdown of nucleolin restored the phagocytic activity of RAW264.7 (Figure 5A). We further investigated the expression of genes involved in phagocytosis by RAW264.7 cells using qPCR array (Figure 5B). Notably, some of the genes involved in phagocytosis including CD36, TLR3, IFNγ, and Myd88 were decreased and genes involving pro-inflammatory cytokine release and apoptosis including Fas, CD44, MIF, and CYP2S1 were increased by treatment with 4T1 ENVs. These effects were confirmed both at transcript (Figure 5C) and protein (Figure 5D) levels. To examine the effect of ENVs on macrophage viability, we first compared the proliferation of RAW264.7 cells treated with 4T1 ENVs and 67NR ENVs and detected no significant impact on RAW264.7 proliferation (Figure 5E). We then assessed the population of apoptotic and necrotic RAW264.7 cells treated with 4T1 ENVs and hypochlorous acid (HOCl) using Annexin V-FITC and PI staining. HOCl caused macrophage cell death through destabilization of cytosolic calcium control [31]. As shown in Figure 5F, compared with PBS treatment, 4T1 ENVs-treated cells had no change in the population of apoptotic cells. In contrast, the increase from 2.1% to 22.3% (p<0.01) in the population of necrotic cells after 50 µM of HOCl treatment also showed a difference of 7.6% (p<0.05) in 4T1 ENVs-treated cells. We examined the cell surface nucleolin on 4T1 ENVs-treated and HOCl-treated necrotic cells by flow cytometry (Figure 5G). Interestingly, a remarkable increase in cell surface nucleolin expression was observed in 4T1 ENVs-treated cells (p<0.05), whereas only 20.45% of HOCl-induced apoptotic cells were cell surface nucleolin positive (p>0.05). These data suggested that upregulated cell surface nucleolin distribution is a characteristic of 4T1 ENVs anti-phagocytosis activity and represents another mechanism of apoptosis.
4T1 ENVs promote DDL distribution to the lung
Collectively, these features of 4T1 ENVs related to liver Kupffer cells prompted us to test if ENVs could be used as a vehicle for delivery of therapeutic agents to treat breast cancer lung metastasis through modulation of phagocytosis by Kupffer cells. We set out to determine whether 4T1 ENVs could enhance the anti-tumor effect of Dox delivered by DDL on lung metastasis of breast cancer.
To address this, we pretreated 4T1-bearing mice with 4T1 ENVs a day prior to the administration of Dox-loaded DDL (DDL/Dox) (Figure 6A). DiR staining of DDL/Dox indicated that DDL/Dox was preferably located in the liver and not the lung, however, 4T1 ENVs pretreatment significantly reduced the distribution of DDL/Dox in the liver and increased its accumulation in the lung (Figure 6B). In contrast, nonmetastatic breast cancer 67NR cell-derived ENVs did not regulate the distribution of DDL/Dox from the liver to the lung (Figure 6B). As is evident from Figure 6C-E, 4T1 ENVs pretreatment proportionally enhanced the therapeutic efficacy of DDL/Dox in reducing breast cancer lung metastasis as well as primary tumor growth. The 50% inhibitory concentration (IC50) has been used here to represent the concentration of a drug that is required for 50% inhibition of tumor size.
4T1 ENVs promote Dox-loaded DDL distribution to the lung. (A) In vivo experimental schema, day 1: 2x10⁵ 4T1 cells implanted into the mammary fat pad of BALB/c mice (n=5 each group). Day 7, 15, 23: pretreatment with 0.5 g/kg 4T1 ENVs by i.v. Day 8, 16, 24: i.v. injection of 50 mM/kg DDL carrying 0.5 µM Dox (DDL/Dox). Day 32: all mice were euthanized. Tumors and organs were collected, imaged, and fixed for histologic examination. (B) A representative image of the liver, lung from BALB/c mice receiving a single intravenous injection of 10 mg DiR dye-labeled DDL/Dox at 6 h (top). Quantification of fluorescence intensity (bottom). (C) Representative 4T1 breast primary tumor (left) and lung (right, metastatic nodules indicated by arrows). (D) Quantification of results of primary tumor weight and volume (E) Metastasis nodule number (> 1 μM). (F) Representative H&E-stained sections of the formalin-fixed, paraffin-embedded lung (400x magnification) from tumor-bearing BALB/c mice at 28 d subjected to breast pad injection of 4T1 tumor cells. Scale bars, 200 μM. (G) Survival of 4T1-bearing BALB/c mice pre-treated with 4T1 ENVs or PBS following i.v. injection of DDL/Dox. (H) Human breast cancer MDA-MB-231 cells (231)-derived ENVs inhibited phagocytosis by human macrophages. (I) Proposed model of 4T1 ENVs promoting DDL/Dox distribution to the lung. (J) Proposed model for the mechanism of 4T1 ENVs repressing phagocytosis by macrophages. *P < 0.05 and **P < 0.01. Each data point was measured in triplicate (error bars, s.e.m.).
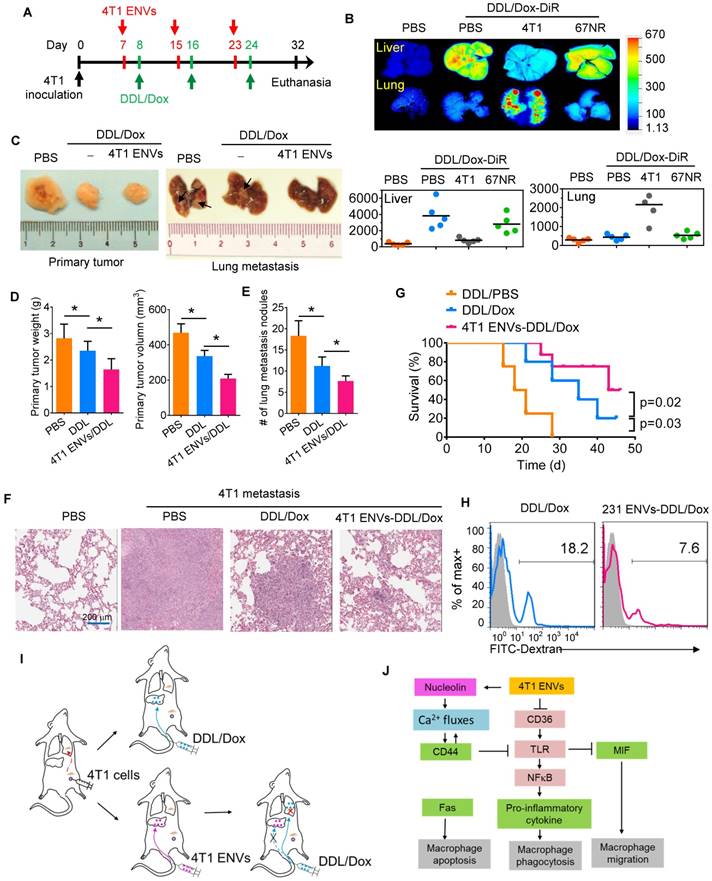
Our results indicated that the IC50 of DDL/Dox, when followed by 4T1 ENVs pretreatment, was significantly lower for lung metastasis nodules compared to treatment with DDL/Dox alone (Supplementary Fig. 7A). The metastatic burden in the lungs, as demonstrated by the H&E staining (Figure 6F), was moderately reduced by 4T1 ENVs-DDL/Dox treatment compared with DDL/Dox alone. Furthermore, DDL/Dox combined with 4T1 ENVs pretreatment significantly prolonged survival of mice with breast cancer compared with DDL/Dox administration alone (Figure 6G). We investigated serum levels of alanine aminotransferase (ALT) and aspartate aminotransferase (AST) and found that 4T1 ENVs pretreatment could reduce the liver damage caused by DDL (Supplementary Fig. 7B). Thus, these data showed that 4T1 ENVs enhanced the therapeutic efficacy of DDL/DOX for breast cancer by regulating phagocytosis-related gene expression in macrophages and by repressing liver Kupffer cell phagocytosis (Figure 6I) (Figure 6I).
Finally, we determined whether our findings in mice could be replicated in humans by using human breast cancer cells. We isolated ENVs from human breast cancer cell line, MDA-MB-231. Figure 6H shows that MDA-MB-231 cell-derived ENVs could inhibit phagocytosis of human peripheral blood-derived macrophages.
Discussion
Although chemotherapy is the primary treatment for advanced breast cancer the side effects on healthy tissues and organs limit the choice of specific drugs and effective doses [32]. To circumvent this problem, a variety of bioengineered nanovesicles have been developed for the delivery of chemotherapeutic drugs. Unlike liposomes and other synthetic nanoparticles as drug carriers, endogenous exosomes have attracted much attention due to low toxicity and cost-effectiveness. Exosomes can potentially be used for drug delivery as the encapsulating lipid bilayer prevents degradation and nuclease damage. as well as reduces chemotherapy-associated toxicity [33, 34]. Regardless of the synthetic or endogenous nature of nanoparticles and the route of administration, most of the nanoparticles are preferentially taken up and eliminated by macrophages.
In this study, we developed ENV nanovesicles from exosome-derived lipids using exosomes released from tumor cells. Tumor-derived exosomes are known to contain a variety of proteins mRNAs and miRNAs that are involved in cancer initiation, propagation, and metastasis [23-25]. The nanovesicles we developed contained lipids of tumor-derived exosomes, whereas the remaining contents of the exosomes, which may promote tumor development, were removed. On the other hand, liposomes including clodronate and propamidine may cause intracellular accumulation and irreversible metabolic damage resulting macrophage apoptosis [35]. Compared to these liposome-based reagents, endogenous ENVs have less immunologic rejection and toxicity, and also conserve the ability of phagocytosis repression without impacting the growth of macrophages. Thus, these 4T1-derived ENVs excluded potential tumor-advancing contents and only exhibited the properties of liver distribution and phagocytosis repression of macrophages. We further demonstrated that the nanovector DOTOP could escape the uptake and elimination by liver Kupffer cells and accumulate in the lung. It is also important to note that ENVs could reduce the IC50 of Dox for the treatment of breast cancer lung metastasis because the phagocytosis by Kupffer cells was inhibited. It is plausible that pretreatment with tumor-derived ENVs may reduce the dosage of chemotherapeutic drugs, thus alleviating toxicity and adverse effects.
Exosomes and other extracellular vesicles have generated a lot of attention for their potential applications in both diagnostics and therapeutics. A recent study has indicated that exosomes isolated from mouse peripheral blood reduce uptake of nanovectors by liver Kupffer cells, leading the nanovectors to be redirected to the lung [22]. However, these exosomes from peripheral blood are greatly limited in clinical use due to the potential risk of adverse effects. Numerous studies suggested that tumor-derived exosomes are involved in cancer progression and invasion-metastasis cascade. Tumor-derived exosomes can initiate the preliminary events of metastatic dissemination in the epithelial-mesenchymal transition program by secreting autocrine and paracrine signals within the neoplastic environment. A growing body of evidence indicates that tumor-derived exosomes instigate metastasis due to the enrichment of epithelial to mesenchymal transition-transducing signaling molecules such as tumor necrosis factor alpha, transforming growth factor beta, Ras, Rab, protein kinase B, interleukin-6, integrin-linked kinase, caveolin-1, platelet-derived growth factors, and β-catenin. Besides proteins, exosomes carry RNA, DNA and lipids, all of which can induce malignant changes and field cancerization [10, 36]. In the most recent years, the relevance of exosomes and miRNAs in many fields has been recognized. Tumor cells, by packing growth inhibitor miRNAs into exosomes through oncogenic major vault protein (MVP), potentially limit the proliferation of normal tissue cells and immune cells [14]. Tumor-derived exosomes carry oncogenic factors and can be detected in peripheral blood as potential biomarkers for cancer diagnosis and prognosis.
We derived nanovesicles ENVs with lipids from tumor 4T1 cells-derived exosomes without proteins and nucleic acids. The lipid bilayer membrane-encapsulated structure of exosomes from tumor cells avoids phagocytosis by macrophages by regulating translocation of cell surface nucleolin. In contrast, nonmetastatic 67NR cells could not affect phagocytosis by macrophages and cell surface expression of nucleolin. 4T1 ENVs inhibited macrophage phagocytic activity but had minimal effects on hepatocytes. Although the underlying mechanisms for the anti-phagocytic properties of 4T1 ENVs by macrophages are still not yet fully understood, its ability to reduce nucleolin and effective and specific internalization by macrophages provide preliminary insight into its unique mechanism. We first noted that the activity of 4T1 ENVs was correlated with their ability to bind a specific nuclear protein nucleolin, which shuttles between the cytoplasm and nucleus as well as localizes to the plasma membrane [29]. Furthermore, 4T1 ENVs, not 67NR ENVs, specifically induce cell surface nucleolin of macrophages. Expression of nucleolin on the cell surface has been reported for some types of cells and correlates with growth and metabolic activity of cells.
The mechanisms by which binding of 4T1 ENVs to nucleolin may have a biological impact on the physiology of cells need to be clarified. In this study, we have shown that 4T1 ENVs elevated cell surface nucleolin and increased intracellular Ca2+. However, there was no significant change in nucleolin expressed in the cytoplasm or the nucleus. Furthermore, knockdown of nucleolin blocked the intracellular Ca2+ entry flux and phagocytosis regulation by 4T1 ENVs indicating that alteration of intracellular Ca2+ and phagocytosis in 4T1 ENVs-treated macrophages were mediated by cell surface nucleolin. Surface nucleolin-triggered Ca2+ entry was identified in cancer cells and surface nucleolin has been found to serve as a receptor for a variety of ligands [28]. Taken together, these observations suggest that nucleolin is expressed on macrophage cells and play a role in Ca2+ entry and functions as a receptor for ligands in tumor 4T1 cell-derived ENVs-treated cells. Although the detailed mechanism by which 4T1 ENVs repress phagocytosis of macrophage cells due to induction of Ca2+ flux is not clear, we found that 4T1 ENVs may regulate expression of genes involved in phagocytosis by macrophages. CD36, toll-like receptor (TLR)3, interferons (IFN)γ, and MyD88 were reduced by 4T1 ENVs. In contrast, Fas (CD95), CD44, macrophage migration inhibitory factor (MIF), and cytochrome P450 2S1 (CYP2S1) were induced by 4T1 ENVs.
Phagocytosis of apoptotic cells by macrophages is impaired by bushfire smoke extract (BSFE) consistent with its effect on the expression of CD36 [37]. A maximum of 70% inhibition of the phagocytic activity of macrophages was achieved by combining anti-CD36 with either anti-αv or phosphatidylserine (PS) liposomes [38]. CD36 and oxidized LDL also trigger pro-inflammatory effects by activating NFκB signaling [39] by releasing reactive oxygen species and inhibiting macrophage migration [40]. TLR3 activation enhances bacterial uptake [41] and lgG-opsonized sheep red blood cell phagocytosis [42] by macrophages. Reduction of TLR3 by 4T1 ENVs can be explained by induction of CD44 activated by Ca2+ flux which resulted in increased CD44 ectodomain cleavage leading to the release of CD44 intracellular domain fragment [43, 44]. CD44 also serves as positive feedback in Ca2+ fluxes [45]. Consequently, induction of CD44 by 4T1 ENVs inhibits NFκB pathway through downregulation of TLR expression. CD44 induced by 4T1 ENVs plays a role in inflammation and suppresses proinflammatory cytokine production upon ligation of TLRs [46]. Signal transduction in the TLR pathways is mediated by MyD88, which plays a critical role for macrophages in innate immunity and ultimately activates NFκB and several of the IFN regulatory factors [47]. These data appear to support the activation of NFκB by ENVs in macrophages. Phagocytosis of macrophages is also regulated by Fas [48]. Fas-activated serine/threonine kinase (FASTK) negatively regulates phagocytosis of bacteria by macrophages [49]. Although FAS induced by ENVs is involved in cell apoptosis, our data suggest that ENVs do not induce apoptosis of macrophages which can be explained by the reduction of CD36, another apoptosis-related protein [50]. Macrophage migration inhibitory factor (MIF) is considered as an inhibitor of random migration of macrophages involved in inflammatory regulation and macrophage apoptosis [51, 52]. Moreover, repression of phagocytosis by 4T1 ENVs provides an opportunity for therapeutic nanoparticles to escape macrophage uptake and accumulate in target organs of tumor metastasis. Also, by reducing the IC50 of the chemotherapeutic drug, 4T1 ENVs reduce adverse effects and toxicity as well as decrease the risk of tumor progression.
In conclusion, our study revealed that metastatic breast cancer 4T1 cell-derived ENVs specifically altered the distribution of cell surface nucleolin leading to repression of phagocytosis by Kupffer cells. Pretreating with 4T1 ENVs protected therapeutic drugs from elimination by Kupffer cells enhancing therapeutic efficacy and reducing potential adverse effects of chemotherapeutic drugs. We also provided insight into the mechanism of inhibition of phagocytosis enabled by translocation of membrane nucleolin from the inner surface of the plasma membrane to the cell surface resulting in activation of Ca2+ flux into macrophages. We developed drug delivery vehicles that protected therapeutic agents from being phagocytosed by Kupffer cells and enabling efficient targeting of tumor metastasis without adverse side effect.
Abbreviations
ENVs: Exosome-like nanovesicles; DDL: Cationic, 2-dioleoyl trimethylammonium propane (DOTAP) / 1, 2-dioleoyl-sn-glycerol-3-phosphoethanolamine (DOPE) liposomes; IC50: 50% inhibitory concentration; Dox: doxorubicin; DiR: dye-dioctadecyl-tetramethylindotricarbocyanine iodide; DAPI: 4',6-diamidine-2-phenylindole dihydrochloride; ACK: ammonium-chloride-potassium; PFA: paraformaldehyde; Fluo-4-AM: Fluo-4-AcetoxyMethyl ester; HOCl: hypochlorous acid; MVP: major vault protein; BSFE: bushfire smoke extract; PS: phosphatidylserine; FASTK: Fas-activated serine/threonine kinase; MIF: migration inhibitory factor; i.v.: intravenously.
Acknowledgements
This work was supported by a grant from the Huai'an International Collaborative Project, HAC201621 (P20GM113226-6174).
Authors' contributions
Y.R, K.Y. designed the study, analyzed, interpreted data, and prepared the manuscript; X.Q., Z.L., C.L., and X.H. performed experiments and interpreted data; L.Z. did histological analysis and prepared nanoparticles; M.L. performed protein analysis.
Supplementary Material
Supplementary figures.
Competing Interests
The authors have declared that no competing interest exists.
References
1. Center MM, Jemal A, Lortet-Tieulent J, Ward E, Ferlay J, Brawley O. et al. International variation in prostate cancer incidence and mortality rates. Eur Urol. 2012;61:1079-92
2. Senkus E, Kyriakides S, Ohno S, Penault-Llorca F, Poortmans P, Rutgers E. et al. Primary breast cancer: ESMO Clinical Practice Guidelines for diagnosis, treatment and follow-up. Ann Oncol. 2015;26(Suppl 5):v8-30
3. Burridge PW, Li YF, Matsa E, Wu H, Ong SG, Sharma A. et al. Human induced pluripotent stem cell-derived cardiomyocytes recapitulate the predilection of breast cancer patients to doxorubicin-induced cardiotoxicity. Nat Med. 2016;22:547-56
4. Liedtke C, Rody A. New treatment strategies for patients with triple-negative breast cancer. Curr Opin Obstet Gynecol. 2015;27:77-84
5. Hernandez-Aya LF, Gonzalez-Angulo AM. Adjuvant systemic therapies in breast cancer. Surg Clin North Am. 2013;93:473-91
6. Breckpot K, Aerts JL, Thielemans K. Lentiviral vectors for cancer immunotherapy: transforming infectious particles into therapeutics. Gene Ther. 2007;14:847-62
7. Vozel D, Ursic B, Krek JL, Stukelj R, Kralj-Iglic V. Applicability of extracellular vesicles in clinical studies. Eur J Clin Invest. 2017;47:305-13
8. Chen G, Huang AC, Zhang W, Zhang G, Wu M, Xu W. et al. Exosomal PD-L1 contributes to immunosuppression and is associated with anti-PD-1 response. Nature. 2018;560:382-6
9. Wu D, Zhang Y, Xu X, Guo T, Xie D, Zhu R. et al. RGD/TAT-functionalized chitosan-graft-PEI-PEG gene nanovector for sustained delivery of NT-3 for potential application in neural regeneration. Acta Biomater. 2018;72:266-77
10. Teng Y, Ren Y, Sayed M, Hu X, Lei C, Kumar A. et al. Plant-Derived Exosomal MicroRNAs Shape the Gut Microbiota. Cell Host Microbe. 2018;24:637-52 e8
11. Sonnichsen C, Reinhard BM, Liphardt J, Alivisatos AP. A molecular ruler based on plasmon coupling of single gold and silver nanoparticles. Nat Biotechnol. 2005;23:741-5
12. Ohta S, Glancy D, Chan WC. DNA-controlled dynamic colloidal nanoparticle systems for mediating cellular interaction. Science. 2016;351:841-5
13. Li P, Liu D, Miao L, Liu C, Sun X, Liu Y. et al. A pH-sensitive multifunctional gene carrier assembled via layer-by-layer technique for efficient gene delivery. Int J Nanomedicine. 2012;7:925-39
14. Teng Y, Ren Y, Hu X, Mu J, Samykutty A, Zhuang X. et al. MVP-mediated exosomal sorting of miR-193a promotes colon cancer progression. Nat Commun. 2017;8:14448
15. Campani V, De Rosa G, Misso G, Zarone MR, Grimaldi A. Lipid Nanoparticles to Deliver miRNA in Cancer. Curr Pharm Biotechnol. 2016;17:741-9
16. Lechanteur A, Furst T, Evrard B, Delvenne P, Hubert P, Piel G. PEGylation of lipoplexes: The right balance between cytotoxicity and siRNA effectiveness. Eur J Pharm Sci. 2016;93:493-503
17. Feng Q, Liu Y, Huang J, Chen K, Huang J, Xiao K. Uptake, distribution, clearance, and toxicity of iron oxide nanoparticles with different sizes and coatings. Sci Rep. 2018;8:2082
18. Litzinger DC, Brown JM, Wala I, Kaufman SA, Van GY, Farrell CL. et al. Fate of cationic liposomes and their complex with oligonucleotide in vivo. Biochim Biophys Acta. 1996;1281:139-49
19. Gregory SH, Wing EJ. Neutrophil-Kupffer cell interaction: a critical component of host defenses to systemic bacterial infections. J Leukoc Biol. 2002;72:239-48
20. Teng Y, Mu J, Hu X, Samykutty A, Zhuang X, Deng Z. et al. Grapefruit-derived nanovectors deliver miR-18a for treatment of liver metastasis of colon cancer by induction of M1 macrophages. Oncotarget. 2016;7:25683-97
21. Kamerkar S, LeBleu VS, Sugimoto H, Yang S, Ruivo CF, Melo SA. et al. Exosomes facilitate therapeutic targeting of oncogenic KRAS in pancreatic cancer. Nature. 2017;546:498-503
22. Wang QL, Zhuang X, Sriwastva MK, Mu J, Teng Y, Deng Z. et al. Blood exosomes regulate the tissue distribution of grapefruit-derived nanovector via CD36 and IGFR1 pathways. Theranostics. 2018;8:4912-24
23. Wee I, Syn N, Sethi G, Goh BC, Wang L. Role of tumor-derived exosomes in cancer metastasis. Biochim Biophys Acta Rev Cancer. 2018;1871:12-9
24. Shtam T, Naryzhny S, Samsonov R, Karasik D, Mizgirev I, Kopylov A. et al. Plasma exosomes stimulate breast cancer metastasis through surface interactions and activation of FAK signaling. Breast Cancer Res Treat. 2018 DOI: 10.1007/s10549-018-5043-0
25. Kia V, Paryan M, Mortazavi Y, Biglari A, Mohammadi-Yeganeh S. Evaluation of exosomal miR-9 and miR-155 targeting PTEN and DUSP14 in highly metastatic breast cancer and their effect on low metastatic cells. J Cell Biochem. 2018 DOI: 10.1002/jcb.27850
26. Marino J, Babiker-Mohamed MH, Crosby-Bertorini P, Paster JT, LeGuern C, Germana S. et al. Donor exosomes rather than passenger leukocytes initiate alloreactive T cell responses after transplantation. Sci Immunol. 2016;1:aaf8759
27. Li PZ, Li JZ, Li M, Gong JP, He K. An efficient method to isolate and culture mouse Kupffer cells. Immunol Lett. 2014;158:52-6
28. Losfeld ME, Khoury DE, Mariot P, Carpentier M, Krust B, Briand JP. et al. The cell surface expressed nucleolin is a glycoprotein that triggers calcium entry into mammalian cells. Exp Cell Res. 2009;315:357-69
29. Teng Y, Girvan AC, Casson LK, Pierce WM Jr, Qian M, Thomas SD. et al. AS1411 alters the localization of a complex containing protein arginine methyltransferase 5 and nucleolin. Cancer Res. 2007;67:10491-500
30. Kim SS, Rait A, Kim E, DeMarco J, Pirollo KF, Chang EH. Encapsulation of temozolomide in a tumor-targeting nanocomplex enhances anti-cancer efficacy and reduces toxicity in a mouse model of glioblastoma. Cancer Lett. 2015;369:250-8
31. Yang YT, Whiteman M, Gieseg SP. HOCl causes necrotic cell death in human monocyte derived macrophages through calcium dependent calpain activation. Biochim Biophys Acta. 2012;1823:420-9
32. Ansari L, Shiehzadeh F, Taherzadeh Z, Nikoofal-Sahlabadi S, Momtazi-Borojeni AA, Sahebkar A. et al. The most prevalent side effects of pegylated liposomal doxorubicin monotherapy in women with metastatic breast cancer: a systematic review of clinical trials. Cancer Gene Ther. 2017;24:189-93
33. Simons M, Raposo G. Exosomes-vesicular carriers for intercellular communication. Curr Opin Cell Biol. 2009;21:575-81
34. Syn N, Wang L, Sethi G, Thiery JP, Goh BC. Exosome-Mediated Metastasis: From Epithelial-Mesenchymal Transition to Escape from Immunosurveillance. Trends Pharmacol Sci. 2016;37:606-17
35. van Rooijen N, Sanders A, van den Berg TK. Apoptosis of macrophages induced by liposome-mediated intracellular delivery of clodronate and propamidine. J Immunol Methods. 1996;193:93-9
36. Valadi H, Ekstrom K, Bossios A, Sjostrand M, Lee JJ, Lotvall JO. Exosome-mediated transfer of mRNAs and microRNAs is a novel mechanism of genetic exchange between cells. Nat Cell Biol. 2007;9:654-9
37. Hamon R, Tran HB, Roscioli E, Ween M, Jersmann H, Hodge S. Bushfire smoke is pro-inflammatory and suppresses macrophage phagocytic function. Sci Rep. 2018;8:13424
38. Fadok VA, Warner ML, Bratton DL, Henson PM. CD36 is required for phagocytosis of apoptotic cells by human macrophages that use either a phosphatidylserine receptor or the vitronectin receptor (alpha v beta 3). J Immunol. 1998;161:6250-7
39. Janabi M, Yamashita S, Hirano K, Sakai N, Hiraoka H, Matsumoto K. et al. Oxidized LDL-induced NF-kappa B activation and subsequent expression of proinflammatory genes are defective in monocyte-derived macrophages from CD36-deficient patients. Arterioscler Thromb Vasc Biol. 2000;20:1953-60
40. Park YM, Febbraio M, Silverstein RL. CD36 modulates migration of mouse and human macrophages in response to oxidized LDL and may contribute to macrophage trapping in the arterial intima. J Clin Invest. 2009;119:136-45
41. Deng T, Feng X, Liu P, Yan K, Chen Y, Han D. Toll-like receptor 3 activation differentially regulates phagocytosis of bacteria and apoptotic neutrophils by mouse peritoneal macrophages. Immunol Cell Biol. 2013;91:52-9
42. Pinheiro CDS, Monteiro APT, Dutra FF, Bozza MT, Peters-Golden M, Benjamim CF. et al. Short-Term Regulation of FcgammaR-Mediated Phagocytosis by TLRs in Macrophages: Participation of 5-Lipoxygenase Products. Mediators Inflamm. 2017;2017:2086840
43. Pan Y, Han C, Wang C, Hu G, Luo C, Gan X. et al. ADAM10 promotes pituitary adenoma cell migration by regulating cleavage of CD44 and L1. J Mol Endocrinol. 2012;49:21-33
44. Okamoto I, Kawano Y, Murakami D, Sasayama T, Araki N, Miki T. et al. Proteolytic release of CD44 intracellular domain and its role in the CD44 signaling pathway. J Cell Biol. 2001;155:755-62
45. Galandrini R, Piccoli M, Frati L, Santoni A. Tyrosine kinase-dependent activation of human NK cell functions upon triggering through CD44 receptor. Eur J Immunol. 1996;26:2807-11
46. Kawana H, Karaki H, Higashi M, Miyazaki M, Hilberg F, Kitagawa M. et al. CD44 suppresses TLR-mediated inflammation. J Immunol. 2008;180:4235-45
47. Lai JF, Zindl CL, Duffy LB, Atkinson TP, Jung YW, van Rooijen N. et al. Critical role of macrophages and their activation via MyD88-NFkappaB signaling in lung innate immunity to Mycoplasma pneumoniae. PLoS One. 2010;5:e14417
48. Segawa K, Suzuki J, Nagata S. Constitutive exposure of phosphatidylserine on viable cells. Proc Natl Acad Sci U S A. 2011;108:19246-51
49. Garcia Del Rio A, Delmiro A, Martin MA, Cantalapiedra R, Carretero R, Durantez C. et al. The Mitochondrial Isoform of FASTK Modulates Nonopsonic Phagocytosis of Bacteria by Macrophages via Regulation of Respiratory Complex I. J Immunol. 2018;201:2977-85
50. Seimon TA, Nadolski MJ, Liao X, Magallon J, Nguyen M, Feric NT. et al. Atherogenic lipids and lipoproteins trigger CD36-TLR2-dependent apoptosis in macrophages undergoing endoplasmic reticulum stress. Cell Metab. 2010;12:467-82
51. El Bounkari O, Bernhagen J. MIF and autophagy: a novel link beyond "eating". Cell Res. 2012;22:950-3
52. Javeed A, Zhao Y, Zhao Y. Macrophage-migration inhibitory factor: role in inflammatory diseases and graft rejection. Inflamm Res. 2008;57:45-50
Author contact
![]() Corresponding authors: Dr. Yi Ren, Department of Breast and Thyroid Surgery, The Affiliated Huai'an No. 1 People's Hospital, Nanjing Medical University, Huai'an, Jiangsu 223300, China. E-mail address: Yi Ren (only_renyicom) or Kun Yu (huaianyukuncom)
Corresponding authors: Dr. Yi Ren, Department of Breast and Thyroid Surgery, The Affiliated Huai'an No. 1 People's Hospital, Nanjing Medical University, Huai'an, Jiangsu 223300, China. E-mail address: Yi Ren (only_renyicom) or Kun Yu (huaianyukuncom)