Impact Factor
- Issue 12; 2026
- Issue 11; 2026
- Issue 10; 2026
- Issue 9; 2026
- Issue 8; 2026
- Volume 16; 2026
- Advance Articles
- Past Issues
- Cover Images
- Cover Suggestion
- Index & Coverage
- Special Issues
1. Introduction
2. Patients and methods
3. Results
4. Discussion
Abbreviations
Supplementary Material
Acknowledgements
References
International Journal of Biological Sciences
International Journal of Medical Sciences
 Global reach, higher impact

Theranostics 2019; 9(9):2595-2605. doi:10.7150/thno.32376 This issue Cite
Research Paper
Radiomic features from PSMA PET for non-invasive intraprostatic tumor discrimination and characterization in patients with intermediate- and high-risk prostate cancer - a comparison study with histology reference
Constantinos Zamboglou1,7,8* ![]() , Montserrat Carles2*, Tobias Fechter2, Selina Kiefer3,7, Kathrin Reichel4, Thomas F. Fassbender5, Peter Bronsert3,7, Goeran Koeber6, Oliver Schilling3,7, Juri Ruf5, Martin Werner3,7, Cordula A. Jilg4, Dimos Baltas2,7, Michael Mix5, Anca L. Grosu1,7
, Montserrat Carles2*, Tobias Fechter2, Selina Kiefer3,7, Kathrin Reichel4, Thomas F. Fassbender5, Peter Bronsert3,7, Goeran Koeber6, Oliver Schilling3,7, Juri Ruf5, Martin Werner3,7, Cordula A. Jilg4, Dimos Baltas2,7, Michael Mix5, Anca L. Grosu1,7
1. Department of Radiation Oncology, Medical Center - University of Freiburg, Faculty of Medicine. University of Freiburg, Germany
2. Division of Medical Physics, Department of Radiation Oncology, Medical Center - University of Freiburg, Faculty of Medicine. University of Freiburg, Germany
3. Institute for Surgical Pathology, Medical Center - University of Freiburg, Faculty of Medicine. University of Freiburg, Germany
4. Department of Urology, Medical Center - University of Freiburg, Faculty of Medicine. University of Freiburg, Germany
5. Department of Nuclear Medicine, Medical Center - University of Freiburg, Faculty of Medicine. University of Freiburg, Germany
6. Institute of Medical Biometry and Statistics, Medical Center—University of Freiburg, Faculty of Medicine. University of Freiburg, Germany
7. German Cancer Consortium (DKTK). Partner Site Freiburg, Germany
8. Berta-Ottenstein-Programme, Faculty of Medicine, University of Freiburg, Germany
* Authors contributed equally
Received 2018-12-18; Accepted 2019-3-10; Published 2019-4-13
Abstract

Purpose: To evaluate the performance of radiomic features (RF) derived from PSMA PET for intraprostatic tumor discrimination and non-invasive characterization of Gleason score (GS) and pelvic lymph node status.
Patients and methods: Patients with prostate cancer (PCa) who underwent [68Ga]-PSMA-11 PET/CT followed by radical prostatectomy and pelvic lymph node dissection were prospectively enrolled (n=20). Coregistered histopathological gross tumor volume (GTV-Histo) in the prostate served as reference. 133 RF were derived from GTV-Histo and from manually created segmentations of the intraprostatic tumor volume (GTV-Exp). Spearman´s correlation coefficients (ρ) were assessed between RF derived from the different GTVs. We additionally analyzed the differences in RF values for PCa and non-PCa tissues. Furthermore, areas under receiver-operating characteristics curves (AUC) were calculated and uni- and multivariate analyses were performed to evaluate the RF based discrimination of GS 7 and ≥8 disease and of patients with nodal spread (pN1) and non-nodal spread (pN0) in surgical specimen. The results found in the latter analyses were validated by a retrospective cohort of 40 patients.
Results: Most RF from GTV-Exp showed strong correlations with RF from GTV-Histo (86% with ρ>0.7). 81% and 76% of RF from GTV-Exp and GTV-Histo significantly discriminated between PCa and non-PCa tissue. The texture feature QSZHGE discriminated between GS 7 and ≥8 considering GTV-Histo (AUC=0.93) and GTV-Exp (prospective cohort: AUC=0.91 / validation cohort: AUC=0.84). QSZHGE also discriminated between pN1 and pN0 disease considering GTV-Histo (AUC=0.85) and GTV-Exp (prospective cohort: AUC=0.87 / validation cohort: AUC=0.85). In uni- and multivariate analyses including patients of both cohorts QSZHGE was a statistically significant (p<0.01) predictor for PCa patients with GS ≥8 tumors and pN1 status.
Conclusion: RF derived from PSMA PET discriminated between PCa and non-PCa tissue within the prostate. Additionally, the texture feature QSZHGE discriminated between GS 7 and GS ≥8 tumors and between patients with pN1 and pN0 disease. Our results support the role of RF in PSMA PET as a new tool for non-invasive PCa discrimination and characterization of its biological properties.
1. Introduction
Extracting mathematically quantitative features (radiomic features, RF) from medical images has gained interest over the past decade [1]. Radiomic features may be used as imaging biomarkers to predict treatment outcomes and to characterize tumor biology non-invasively.
For patients with primary prostate cancer (PCa) first studies postulated that RF derived from magnetic resonance imaging (MRI) can be used to differentiate between malignant and non-malignant prostatic tissue [2] and enable PCa to be assigned a Gleason score (GS). Gnep et al. showed that RF derived from MR images are associated with biochemical control after radiotherapy for primary PCa [3] . However, MR imaging is known to have poor sensitivity in small (<0.5 ml) intraprostatic tumors and may suffer from false-positivity in benign prostatic hyperplasia [4]. Additionally, a meta-analysis reported a pooled sensitivity of 0.39 for MRI in pelvic lymph node staging of PCa patients using histology as the gold-standard [5].
Radioactive-labelled tracers targeting the prostate specific membrane antigen (PSMA) have been proposed for positron emission tomography (PET) examinations among patients with primary PCa. Our group [6, 7], in agreement with the findings of other investigators [8, 9] concluded that PSMA PET may have higher sensitivities (up to 75%) and specificities (up to 95%) than MRI for intraprostatic tumor detection. Whether RF derived from PSMA PET allow discrimination between PCa and non-PCa tissue is not known. The correlation of PSMA PET signal in terms of standardized uptake values (SUV) with the GS is currently debatable. Rowe et al. used prostatectomy as the reference and detected a positive correlation between [18F]-labeled PSMA tracer uptake and the GS [10]. Hoffmann et al. reported that the PSMA signal enables distinguishing between GS 7a and 7b PCa [11]. On the contrary, four studies using prostatectomy as the reference did not observe a significant correlation between SUV values in PSMA PET images and the GS [8, 12-14]. Although these previous publications have investigated the correlation between GS and SUV, the correlation between GS and more sophisticated PET image features has not yet been evaluated. First studies analyzed the value of PSMA PET in detection of lymph nodes metastases in patients with primary PCa [15, 16]. Maurer et al. reported a sensitivity of 0.66 and a specificity of 0.99 for PSMA PET in lymph node detection [17]. Leeuwen et al. observed a similar sensitivity (0.64) by comparing PSMA PET with histology reference [18]. Whether image features derived from PSMA PET imaging in the primary intraprostatic lesion may identify patients with positive lymph node involvement is not known.
The aim of our study was to investigate the possibility of intraprostatic tumor discrimination and characterization by means of PSMA PET derived RF. Patients with hybrid PSMA PET and computer tomography (CT) imaging prior prostatectomy and lymphadenectomy were enrolled in a prospectively designed study. The performance of RF derived from manually and automatically created intraprostatic tumor segmentations on PSMA PET scans was examined. The segmentation of the coregistered histopathological information after prostatectomy served as reference. In a first step we investigated the intraindividual correlations of RF extracted from the different segmentations. In a second step, we evaluated the feasibility of RF based PCa discrimination. Finally, correlations between RF and the GS or lymph node status were assessed and validated with a second patient cohort.
2. Patients and methods
2.1. Patients
Between February 2014 and July 2018, 20 patients were prospectively enrolled in this study. Inclusion criteria were histopathologically proven primary adenocarcinoma of the prostate, pre-therapeutic [68Ga]-PSMA-11 PET/CT and intended radical prostatectomy. Exclusion criteria were neoadjuvant androgen deprivation therapy, >3 months' time gap between PSMA PET/CT scan and operation and previously performed transurethral resection of the prostate. Written informed consent was obtained from each patient, and the institutional review board approved the prospective analysis in this study.
To obtain a retrospective validation cohort, we randomly selected 40 patients who received [68Ga]-PSMA-11 PET/CT scans prior to prostatectomy at our medical centre during the same time period as the prospectively enrolled patients. The same exclusion criteria were used as for the prospective cohort. The institutional review board approved the retrospective analysis in this study and a written informed consent was waived.
Please see supplementary Table 1 and 2 for detailed patients' characteristics of the prospective and retrospective study cohorts, respectively.
2.2. PET/CT Imaging
For both cohorts the same protocol was used. Details of our radiolabelling protocol of [68Ga]-PSMA-11 can be found in Zamboglou et al. [19]. The patients had to fast for at least 4 hours before the administration of the radiopharmaceutical (median activity in mega Becquerel: 206 MBq, range: 114-251 MBq) and were asked to void before starting the PET scan. One hour post injection, patients underwent the whole body PET scan. PET/CT whole body acquisition protocols were performed on three different systems from Philips (The Netherlands): 21 patients in GEMINI TF TOF 64 (TF64), 35 in GEMINI TF 16 Big Bore (BB) and four patients in Vereos (V). All scanners fulfilled the requirements indicated in the European Association of Nuclear Medicine (EANM) imaging guidelines and obtained EANM Research Ltd. (EARL) accreditation during acquisition. The transverse spatial resolutions at one cm from the central axis of the scanner are 4.8 mm for TF64 and BB [20] and 4.2 mm for V [21]. PET data were corrected for randoms as well as for scatter and attenuation, based on the corresponding CT dataset. The reconstruction methods for all scanners were a LOR-based ordered-subset iterative time-of-flight algorithm using spherical coordinates (BLOB) with three iterations, 33 subsets and a relaxation parameter for smoothing of 0.35 for TF64 and BB and three iterations with seven subsets without any smoothing for V. All systems resulted in a PET image with a voxel size of 2 x 2 x 2 mm3. Images were normalized to decay corrected injected activity per kg body weight (SUV [g/ml]). The acquisition time per bed position ranged from two to three min and the overlap in the axial field of view (FOV) was of 53% for GEMINI systems and 43% for V.
2.3. Histopathology and PET/CT image coregistration
The 3D distribution of PCa in the prostatectomy specimen served as ground truth and was obtained using a published, in-house coregistration protocol [7, 12]. After formalin fixation, the resected prostate underwent an ex-vivo CT scan using a customized localizer. To ensure equal cutting angles of the tissue specimens and ex-vivo CT slices, whole-mount step sections were cut every 4 mm using an in-house cutting device. Subsequent, all tissue specimens were paraffin embedded and sliced using a Leica microtom. Staining with hematoxylin and eosin was performed via routine protocols and one of two experienced pathologists segmented PCa tissue and classified the PCa lesions according to GS. Histology slices were registered on ex-vivo CT images and PCa segmentations were transferred onto the CT images. The contours were interpolated by 2 mm expansion in both Z-axis directions to create a model of the 3D distribution of PCa in histology. In analogy to Souvatzoglou et al. [22] only PCa lesions with a diameter above 5 mm were included for further analysis. Taking into account the non-linear transformations of the prostatic gland after resection, ex-vivo CT (including histology information) was initially registered on in-vivo CT (from PSMA PET/CT scans) by manual coregistration by allowing non-rigid deformations. The alignment of in-vivo CT and PET scan was based on the hardware coregistration of the hybrid PET/CT scanners. In 4 of the 20 patients a misalignment between PET and CT images occurred (up to 2 cm) and a manual adaption was performed using rigid registration. For better orientation, the prostatic gland was segmented on CT and PET images.
The internal validation cohort was selected retrospectively and thus no co-registration between PET images and histopathology information was possible. The GS for this patient cohort was derived from the histopathology report after prostatectomy.
The lymph node involvement after prostatectomy (pN status) for both cohorts was retrospectively derived from the histopathology report. The median number of resected lymph nodes was 21 (range: 5-73) and in 11 of 60 patients less than 15 lymph nodes were resected.
2.4. Image segmentations
Image analysis was conducted via MITK 2016.11 [23] and 3D Slicer v4 [24]. Intraprostatic tumor segmentation was performed in three different ways (Figure 1):
Image segmentations. Hematoxylin & eosin stained whole-mount prostate tissue slice with PCa marked in blue from patient 17 (A). In B the corresponding axial PSMA PET/CT image is shown. In C-E the respective PET image is presented including the GTVs: GTV-Histo is blue (C), GTV-Exp is green (D) and GTV-40% is red (E). The windowing level in images C-E is minimum-maximum: 0-5 SUV
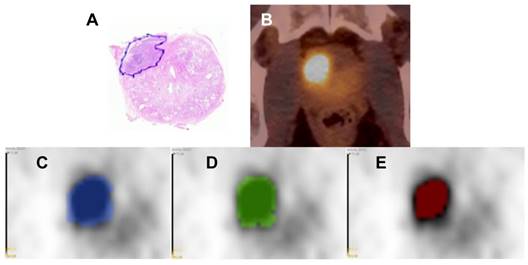
- Based on PSMA PET images the gross tumor volume was delineated concertedly by two experienced nuclear medicine physicians using window levels from 0-5 SUV (GTV-Exp).
- Any focal uptake higher than local background was considered to represent PCa. GTV-40% was created semi-automatically by applying a threshold of 40% of the intraprostatic SUVmax as proposed by Thomas et al. [25].
- GTV-Histo resulted from the coregistration of the histopatology with PET image, as described in the previous section.
Non-PCa tissue was defined as the subtraction volumes between the prostatic gland in CT scans and the three respective GTVs from each patient, resulting in NonGTV-Exp, NonGTV-40% and NonGTV-Histo. All 6 segmentations were created in all patients from the prospective study cohort and for the validation cohort only manually delineated contours (GTV-Exp_val) were considered.
2.5. Radiomic feature extraction
In each contour, 133 RF were analyzed. They were subdivided into two categories: first order statistics and second or higher order statistics, i.e. texture features (TF). The RF were computed using an in-house software based on MATLAB® (The MathWorks Inc., Natick, MA). Definition of RF was done according to the Image biomarker standardization initiative (please see https://arxiv.org/abs/1612.07003 and [26]), using the 3D version for TF computation. MITK was employed to validate histogram based statistics. In addition, validation of geometric features and TF was done with an open source code [28]. For RF selection, the main criterions were (i) to maximize the robustness and (ii) to minimize the redundancy. For these reasons in TF computation: (i) TF were derived from 3D matrices (instead of averaged 2D-planes of the 3D-volumes) [27] and (ii) SUV values of the voxels within the contour were discretized with a fixed bin width (W=0.05) [28, 29], resulting in different numbers of bins (from 18 to 1141) depending on the range of SUV values in the contour. TF were derived from five matrices: the 3D version of the gray-level co-occurrence matrix (GLCM [30, 31]); the gray-level run length matrix (GLRLM [32, 33]), the gray-level size zone matrix (GLSZM [32, 33]) and the neighborhood gray tone difference matrix (NGTDM [34]). In addition, we applied on the voxel intensities within the contour: (i) A Wavelet band-pass filtering (WBPF) with a weight ratio 1:2 between band-pass sub-bands and other sub-bands and (ii) an equal-probability quantization algorithm (Q), by using the function of MATLAB® histeq [28]. In supplementary material 1 the RF used in this study are listed.
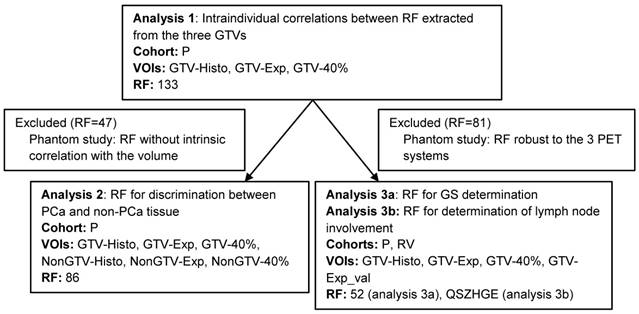
To avoid misinterpretation of the results two selection criteria for RF were defined. The first one was based on the RF robustness to the different PET/CT systems (BB, TF and V) and the second on the interdependency of RF with volume. In Figure 2 a schedule of the RF selection procedure is shown. Detailed description of the experimental set-up and analysis can be found in supplemental material 2.
Workflow of analyses based on RF. Due to the fact that all RF for analysis 1 were computed on the same image it was performed with all 133 RF. In our prospective study cohort NonGTV volumes were significantly larger than their corresponding GTVs. Likewise, analysis 2 was only conducted with RF with no interdependency with volume. Analysis 3a was performed only with RF robust to the three different PET/CT systems. Analysis 3b was performed considering the TF QSZHGE. Abbreviations: RF: radiomic features, VOI: volume of interest, P: prospective study cohort, RV: retrospective validation cohort, GTV: gross tumor volume, QSZHGE: quantization algorithm + short zones high gray-level emphasis
2.6. Statistical analyses
Statistical analyses were performed in R software v.3.4.4 and SPSS v.24 (IBM, USA). PSMA PET derived RF were summarized using descriptive statistics. To compare two different groups the Wilcoxon matched-pairs signed rank test for pairwise testing (analysis 1) or two-tailed Mann-Whitney U test for non-pairwise testing (analyses 2 and 3) were used. This was due to the fact that most of the variables (>90%) were not normally distributed in Shapiro-Wilk normality test. The correlation between RF derived from the different volumes of interest as well as their correlation with GS (7a vs. 7b vs. ≥8) were assessed by calculating Spearman correlation coefficient (ρ). Furthermore, the area under the receiver-operating characteristic curve (AUC-ROC) for GS prediction (7 versus ≥8) and nodal status prediction (pN0 versus pN1) by PSMA PET derived RF was evaluated. Finally, both cohorts were pooled to perform uni- and multivariate binary logistic regression analyses to examine the association between clinical parameters which can be obtained non-invasively and GS (7 versus ≥8) or nodal status prediction (pN0 versus pN1). Due to our small sample size and the strong influence of the significant TF on the classification, ordinary logistic regression resulted in overly large coefficients and standard errors. Accordingly, we fit a Firth's logistic regression model which accounts for the nearly perfect separation and considerably reduced the size of the coefficients and confidence intervals [35]. For better comparability during regression analyses, metric variables were centered and divided by two standard deviations as proposed by Gelman [36]. The p-values wer adjusted for multiple testing by controlling the false discovery rate with Benjamini and Hochberg's method [37] and p<0.05 was considered to be statistically significant.
3. Results
3.1. Analysis 1: Intraindividual correlations between RF extracted from the three GTVs
Patients of the prospective study cohort had a median volume of GTV-Histo, GTV-Exp, and GTV-40% of 7.3 (range: 0.2-121.2) ml, 6.3 (range: 0-87.7) ml, and 2.7 (range: 0-26.6) ml, respectively. No statistically significant differences between the volumes of GTV-Histo and GTV-Exp were observed (p>0.05), but GTV-40% was statistically significantly smaller (p<0.05) than GTV-Histo in pairwise comparison.
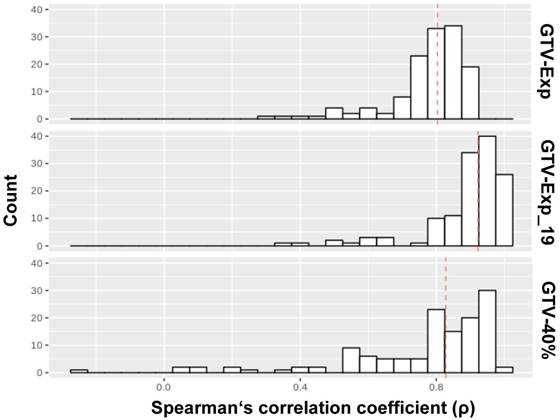
In Figure 3, the results of intraindividual correlations between RF extracted from GTV-Histo with RF extracted from GTV-Exp and GTV-40% are shown. RF extracted from GTV-Exp and GTV-40% had median ρ values of 0.8 (86% RF with ρ>0.7) and 0.83 (74% RF with ρ>0.7), respectively. Considering lesions (n=19) which were only visible by applying a threshold of 40% of intraprostatic SUVmax, the median p for GTV-Exp was increased up to 0.92. Please see supplementary material 1 for a detailed listing of correlations for all RF.
Correlation analysis between RF from different volumes. The distributions of ρ values for the correlation of RF extracted from GTV-Histo with GTV-40%, GTV-Exp and GTV-Exp_19 (19 lesions), respectively, are shown. The analysis for GTV-PET was performed twice: first, considering all lesion segmented by the readers (numer of lesions: 25) and second considering only lesions which were visible by applying a threshold of 40% of intraprostatic SUVmax (number of lesions: 19). The red dotted lines indicate the median values
3.2. Analysis 2: RF for discrimination of PCa and non-PCa tissue
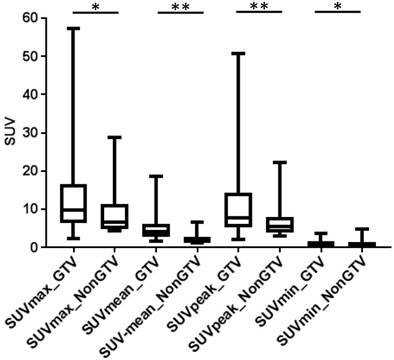
In analysis 2 only RF with no dependency on the volume were considered (n= 86) and most RF showed significant differences between PCa and non-PCa: 76% for GTV-Histo, 81% for GTV-Exp and 64% for GTV-40%. For all three segmentation methods, SUV-related features (min, max, peak and mean) had statistically significant different values between PCa and non-PCa tissue. Please see Figure 4 for SUV-related feature based PCa discrimination considering histology information. The performances of all RF for PCa and non-PCa discrimination are listed in supplementary material 1.
SUV related values in GTV-Histo vs NonGTV-Histo. Box-plots: the middle line in the box represents the median and the upper and lower ends of the box represent the 75th and 25th percentile, respectively. The minimum and maximum values are also shown. * p<0.05, ** p<0.01
3.3. Analysis 3a: Correlation of RF with GS
3.3.1. Prospective Cohort
Only RF with comparable results in all three PET/CT systems were considered in analysis 3a (n=52). For GTV-Exp the correlation between RF and GS (7a vs 7b vs ≥ 8) were evaluated and only 4 TF showed a strong correlation (ρ≥0.7 and p<0.05). In addition, these 4 features showed statistically significant differences between GS 7 and GS ≥ 8 PCa in Mann-Whitney U test (p<0.05) and AUC values >0.9 for discrimination of PCa with GS 7 and GS ≥ 8. The results for the 4 TF are summarized in Supplementary Table 3. Between all four TF very strong correlations (ρ≥0.98 and p<0.01) were observed. However, the TF quantization algorithm + short zones high gray-level emphasis (QSZHGE) performed slightly better than the other three.
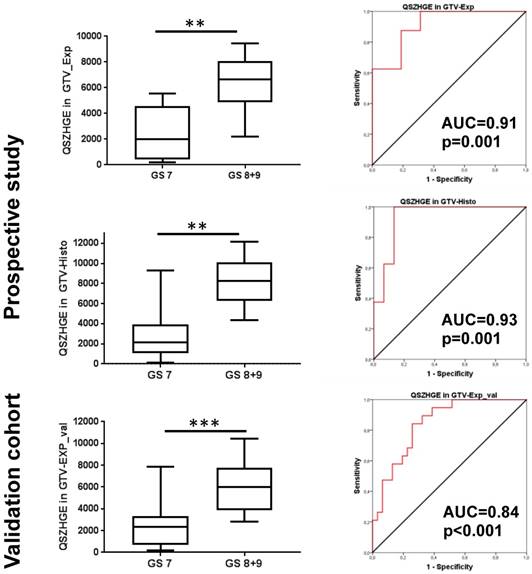
For GTV-Histo similar findings were observed: all 4 TF had strong correlation (ρ≥0.65 and p<0.05) with the GS (7a vs 7b vs ≥ 8) and all 4 TF had statistically significantly different values for PCa with GS 7 and GS ≥ 8 (p<0.05) and ROC-AUC values >0.9 (p<0.01) for discrimination of PCa with GS 7 and GS ≥ 8. Please see exemplary Figure 5 for correlation of TF QSZHGE and the GS. For GTV-40% however, no RF had a strong correlation (ρ≥0.6 and p<0.05) with the GS.
QSZHGE for discrimination between GS 7 and ≥ 8 in different GTVs and cohorts. In the left Box-plots are shown: the middle line in the box represents the median and the upper and lower ends of the box represent the 75th and 25th percentile, respectively. The minimum and maximum values are also shown. In the right ROC-AUC curves are shown: the red line represents the respective ROC curve and the black line represents the chance line. Abbreviations: AUC = area under the curve, ** p<0.01, *** p<0.01 Q: quantization algorithm, QSZHGE: quantization algorithm + short zones high gray-level emphasis
3.3.2. Retrospective validation Cohort
QSZHGE performance was validated for GTV-Exp_val in a second patient cohort and statistically significant differences between GS 7 and GS ≥ 8 PCa (p<0.001) were observed. In ROC analysis the AUC for discrimination between GS 7 and GS ≥ 8 PCa was 0.84 (95% CI: 0.74-0.95, p<0.001) (Figure 5).
3.3.3. Pooled analysis
Both cohorts were pooled and results of uni- and multivariate logistic regression analyses are presented in Table 1a. In univariate analysis, non-invasively obtainable parameters QSZHGE, cT stage on PSMA PET, and PSA serum values differentiate between GS 7 and GS ≥ 8 PCa. Since these coefficients are comparable regarding their numerical size, we see that QSZHGE has a much stronger effect on GS classification than cT stage and PSA. In multivariate analysis, including all three potential predictors, only QSZHGE (OR=23.5, p<0.01) predicted statistically significant PCa with GS ≥ 8.
Differentiation between GS 7 and GS > 7 PCa (pooled cohorts)
| Univariate analysis | Multivariate analysis | |||||
|---|---|---|---|---|---|---|
| Parameter | OR | 95% CI | p-value | OR | 95% CI | p-value |
| PSA (<20 vs ≥ 20 ng/ml) | 2.87 | (1.077.95) | 0.04 | 0.89 | (0.21-3.42) | 0.87 |
| cT stage (cT2 vs cT3) | 4.6 | (1.73-12.96) | <0.01 | 3.65 | (1-15.1) | 0.05 |
| QSZHGE (metric) | 23.56 | (6.34-119.5) | <0.01 | 21.11 | (5.12-124.79) | <0.01 |
3.4. Analysis 3b: Correlation of QSZHGE with nodal status
3.4.1. Prospective Cohort
Since it is well known that positive lymph node involvement increases with the GS [38, 39] only the TF QSZHGE derived from the intraprostatic tumor mass was considered for pN0 versus pN1 discrimination. For GTV-Exp (p=0.003) and GTV-Histo (p=0.007) statistically significant differences in QSZHGE values between patients with pN0 and pN1 disease were observed, respectively. For GTV-Exp and GTV-Histo ROC-AUC was 0.87 and 0.85 (both p<0.01), respectively, for pN0 and pN1 discrimination. For GTV-40% QSZHGE had again no statistically significant differences between patients with pN0 and pN1 disease.
3.4.2. Retrospective validation Cohort
QSZHGE performance was validated for GTV-Exp_val in a second patient cohort and statistically significant differences in patients with pN1 and pN0 status (p<0.001) were found. In ROC analysis the AUC for discrimination between pN1 and pN0 was 0.85 (95% CI: 0.74-0.96, p<0.001).
3.4.3. Pooled analysis
Both cohorts were pooled and results of uni- and multivariate logistic regression analyses are presented in Table 1b. In univariate analysis, all non-invasively obtainable parameters discriminated between patients with pN0 and pN1 disease. In multivariate analysis, including all three potential predictors, QSZHGE (OR=16.9, p<0.01) and cT stage (OR=8, p=0.01) predicted statistically significant patients with pN1 disease.
Differentiation between pN0 and pN1 status (pooled cohorts)
| Univariate analysis | Multivariate analysis | |||||
|---|---|---|---|---|---|---|
| Parameter | OR | 95% CI | p-value | OR | 95% CI | p-value |
| PSA (<20 vs ≥ 20 ng/ml) | 6.5 | (2.33-19.58) | <0.01 | 2.76 | (0.7-11.02) | 0.14 |
| cT stage (cT2 vs cT3) | 7.97 | (2.87-24.16) | <0.01 | 5.35 | (1.45-22.83) | 0.01 |
| QSZHGE (metric) | 19.97 | (5.6-94.84) | <0.01 | 16.94 | (3.9-108.31) | <0.01 |
Multivariate analyses were performed with cT stage and QSZHGE as metric variables. Abbreviations: OR = Odds ratio, CI = confidence interval, PSA = prostate specific antigen, cT stage was defined based on PET images, QSZHGE: quantization algorithm + short zones high gray-level emphasis.
4. Discussion
The results of our study prove that PSMA PET RF derived from the intraprostatic tumor mass discriminate PCa from non-PCa tissue, intermediate-risk (GS 7) from high-risk PCa (GS ≥8) and patients with pelvic lymph node involvement. All observations were validated by coregistered histology information and the RF based GS and nodal status discrimination was further tested on an internal validation cohort. In the following, we discuss our results in detail.
Several studies observed an excellent performance of PSMA PET for intraprostatic GTV detection and segmentation [40]. In line with this, our study found no significant differences between the median volumes of GTV-Histo and GTV-Exp. Furthermore, we observed a very strong correlation between most RF from GTV-Exp and RF from GTV-Histo (analysis 1) which can be explained by the high spatial overlap between GTV-Histo and GTV-Exp. Median volume of GTV-40% was significantly smaller than median volume of GTV-Histo suggesting that the prostatic tumor mass may be underestimated by applying a 40% threshold of intraprostatic SUVmax for GTV delineation [12].
In analysis 2, we analyzed whether RF from PSMA PET discriminate between PCa and non-PCa tissue and 76% and 81% of RF from GTV-Histo and GTV-Exp, respectively, had statistically significant differences between PCa and non PCa tissue. Only 64% of RF from GTV-40% discriminated between PCa and non-PCa tissue. Interestingly, all SUV-based features showed statistically significantly different values between PCa and non-PCa considering histology information. Again, this can be explained by very good performance of PSMA PET in intraprostatic GTV detection and manual GTV segmentation based on PSMA PET images. Future studies should analyze whether the RF which discriminated between PCa and non-PCa tissue in our study may be implemented in workflows for computer-based GTV detection and delineation. This could further improve the robustness of PSMA based GTV delineation to guide focal therapy regimen [41] or targeted biopsies [42] enabling more personalized treatment approaches in patients with primary PCa.
In analysis 3a we tested the relation between RF from PSMA PET and GS in prostatectomy specimen. Considering the expert contours (GTV-Exp) in the prospective cohort we observed that 4 TF had a strong correlation with GS. All of them showed statistically significant differences between PCa with GS 7 and GS ≥8 and ROC-AUC values >0.9 enabling non-invasive discrimination between intermediate (GS 7) and high-risk PCa (GS≥8). Considering the ground truth (GTV-Histo) similar results for all 4 TF were observed. On a retrospective validation cohort consisting of 40 patients we could further reproduce these findings: TF QSZHGE from GTV-Exp discriminated GS 7 and GS ≥8 PCa (AUC=0.84). This discrimination has an impact on clinical decision making as it defines intermediate- and high-risk PCa patients which influences for example the duration of androgen deprivation therapy during radiation therapy [43]. One should mention that GS before primary therapy is based on biopsy tissue. Due to intratumoral heterogeneity the GS on biopsy cores and prostatectomy specimen are disconcordant in 20-60% of the patients [44, 45]. Additionally, prostate biopsy is leading to increases in hospitalization rates due to adverse side effects [46]. In this study non-invasively obtainable clinical parameters were included into a multivariate analysis testing GS 7 from GS ≥8 discrimination and TF QSZHGE from PSMA PET remained as the only statistically significant variable. Additionally, a QSZHGE cut-off value of 3320 (median) correctly discriminated in 77% of PCa lesions GS 7 from GS ≥8 in our study. Thus, our data suggests that TF QSZHGE derived from PSMA PET could serve as an alternative for non-invasive GS characterization in the future. For a better understanding of our results, we would like to provide a possible explanation of the biological nature of QSZHGE. Several groups detected a correlation between PSMA expression (immunohistochemistry) in PCa tissue and the corresponding GS [47, 48] . However, in our study we could not find a strong correlation between SUVmean values in GTV-Exp or GTV-Histo and GS. This finding may be explained by intratumoral heterogeneity in PSMA expressing cells. Mannweiler et al. reported that even highly PSMA positive cases of any Gleason score also frequently contained larger areas with PSMA-negative cells [49]. Additionally, Acosta et al. found areas with significant tumor necrosis in PCa with Gleason pattern 5 [50]. The TF SZHGE quantifies the amount and the signal intensity of small areas with high PSMA expression within the tumor. Most probably, SZHGE correlates with the GS by considering only regions with high PSMA expression and by not being affected from non-PSMA expressing and necrotic areas within the tumor. However, SZHGE was not robust on different PET scanners (see supplementary materal 1.2). By applying an equal-probability quantization algorithm (Q) on the voxel intensities within the segmentations, comparable QSZHGE values between different PET scanners were observed.
In analysis 3b we proved that the TF QSZHGE discriminated between patients with pN0 and pN1 disease in both study cohorts (ROC-AUC values ≥0.85). This result is not surprising because the GS consistently correlates with the risk of lymph node disease [38, 39]. According to current literature, PSMA PET has a sensitivity of 66% in detection of positive lymph nodes [17, 18]. In our study, PSMA PET reached a sensitivity of 65% in detection of positive lymph nodes. Whereas, the TF QSZHGE derived from the primary intraprostatic tumor with a cut-off value of 3320 (median) had a sensitivity of 85%. Thus, it is very likely that the implementation of TF QSZHGE may increase the robustness of statistical models [51] predicting lymph node invasion in patients with primary PCa.
Whether the cut-off value obtained in our study may be exported to a different data set from another institute is not clear. Model development based on RF analysis poses unique challenges due to the dependence of RF on different factors. RF analysis performed on PET images is hampered by interinstitutional differences in PET scanners, in acquisition protocols or the reconstruction settings [52] and in the definition of TF matrices [52, 53]. Previous studies reported also a strong dependence of RF from the applied segmentation method [31, 54]. In this study we used three different approaches for GTV segmentation. RF from manually delineated contours and from histology reference correlated with clinical parameters (GS and nodal status), whereas no RF derived from GTV-40% had a strong correlation. This observation may be explained by the underestimation of the real PCa volume by this segmentation method. Several studies observed a significant interobserver variability when MRI was used for intraprostatic GTV segmentation [55, 56]. If this issue affects also PSMA PET-based manual GTV segmentation was not examined yet. Thus, future studies should evaluate the most robust segmentation approach for RF extraction from PSMA PET images.
In the following, we discuss the limitations of our study. A known problem in pathology-imaging correlation studies is the uncertainty in the accuracy of coregistration. Non-linear shrinkage of the prostate occurs during histopathological preparation. We accounted for this issue by implementing non-rigid registration between in- and ex-vivo CT images. A second source of inaccurate coregistration is a potential discrepancy in slice angles between imaging and pathological specimens. We accounted for this by using ex-vivo CT scans in a localizer and a customized cutting device for the prostatectomy specimen. Likewise, all tissue slices had the same cutting angel as the ex-vivo CT slices. Second, we only included patients scheduled for prostatectomy to obtain histopathology information from surgical specimen and we included only 1 patient with low-risk (GS 6) PCa. Thus, it remains unclear whether PSMA PET derived RF can discriminate PCa from non-PCa tissue (analyses 1 and 2) in patient cohorts including more patients with low-risk GS. However, the usage of PSMA PET/CT imaging in patients with low-risk PCa is most probably not constructive. Third, different PET/CT scanners were used for this study. We accounted for this issue through phantom studies and by only using features with robustness regarding the scanning system for correlation studies with clinical parameters. It should be mentioned that also differences in time per bed position could have an impact on RF variability. In our study we found differences in time per bed position from 2-3 min between the three scanning systems. Using heterogeneous phantoms, we found that these differences had no statistically significant impact on RF. Furthermore, SZHGE was previously shown to be reproducible in patients with PET examinations using a time per bed position of 2 min [57]. Fourth, due to the elaborate pathology-imaging co-registration protocol, the sample size in our study is small (60 patients with 74 lesions). This issue creates statistical uncertainty, which explains the large confidence intervals of the firth logistic regression model. The retrospective character of the validation cohort is another limitation, since no coregistration between prostatectomy specimen and PET images was performed and the GS was derived from histopathology reports. This issue may explain the differences in ROC-AUC values between the prospective and the validation cohort. Finally, the question whether RF from PSMA PET may discriminate between pN0 and pN1 disease (analysis 3b) was not part of the initial trial protocol. Thus, the lymphadenectomy was not conducted similarly in all patients, which explains the variability in the number of resected lymph nodes (range: 5-73).
To conclude, our study identified a cluster of 4 highly correlated TF which showed comparable results in analyses 1-3a (supplementary material 1.2 and supplementary Table 3). Since the TF QSZHGE correlated decently better with the GS in the prospective study cohort (considering GTV-Exp and GTV-histo) than the other three TF, it should be recommended for future studies. QSZHGE was robust against the used PET scanning system and segmentation volume. Furthermore, QSZHGE discriminated between PCa and non-PCa tissue, intermediate- from high-risk GS and patients with pN0 and pN1 disease. Future studies should investigate, whether QSZHGE is also correlating with distinct mutations in the tumor which may link to aggressiveness [58].
Considering the limitations of our study, future work should further validate the ability of the TF QSZHGE to characterize PCa non-invasively. We emphasize that QSZHGE values derived from our patient cohorts have been provided as a proof of concept and the optimal thresholds should be further investigated [59].
Abbreviations
RF: Radiomic features; PCa: prostate cancer; GS: Gleason score; MRI: magnetic resonance imaging; PSMA: prostate specific membrane antigen; PET: positron emission tomography; SUV: standardized uptake value; CT: computed tomography; MBq: mega bequerels; EANM: European Association of Nuclear Medicine; GTV: gross tumor volume; TF: texture features; GLCM: gray-level co-occurrence matrix; GLRLM: gray-level run length matrix; GLSZM: gray-level size zone matrix; NGTDM: neighborhood gray tone difference matrix; WBPF: wavelet band-pass filtering; Q: equal-probability quantization algorithm; AUC-ROC: receiver-operating characteristic curve; OR: Odds ratio. Please see supplementary material for all abbreviations of RF.
Supplementary Material
Supplementary material and tables.
Acknowledgements
We would like to thank Colin Nolden for proofreading the manuscript. We would like to thank Sam Doerken for his skillful support in performing the regression analyses.
Competing Interests
The authors have declared that no competing interest exists.
References
1. Sanduleanu S, Woodruff HC, de Jong EEC. et al. Tracking tumor biology with radiomics: A systematic review utilizing a radiomics quality score. Radiother Oncol. 2018;127:349-60
2. Wibmer A, Hricak H, Gondo T. et al. Haralick texture analysis of prostate MRI: utility for differentiating non-cancerous prostate from prostate cancer and differentiating prostate cancers with different Gleason scores. Eur Radiol. 2015;25:2840-50
3. Gnep K, Fargeas A, Gutierrez-Carvajal RE. et al. Haralick textural features on T2 -weighted MRI are associated with biochemical recurrence following radiotherapy for peripheral zone prostate cancer. J Magn Reson Imaging. 2017;45:103-17
4. Bonekamp D, Jacobs MA, El-Khouli R. et al. Advancements in MR imaging of the prostate: from diagnosis to interventions. Radiographics. 2011;31:677-703
5. Hovels AM, Heesakkers RAM, Adang EM. et al. The diagnostic accuracy of CT and MRI in the staging of pelvic lymph nodes in patients with prostate cancer: a meta-analysis. Clin Radiol. 2008;63:387-95
6. Zamboglou C, Thomann B, Koubar K. et al. Focal dose escalation for prostate cancer using (68)Ga-HBED-CC PSMA PET/CT and MRI: a planning study based on histology reference. Radiat Oncol. 2018;13:81
7. Zamboglou C, Drendel V, Jilg CA. et al. Comparison of 68Ga-HBED-CC PSMA-PET/CT and multiparametric MRI for gross tumour volume detection in patients with primary prostate cancer based on slice by slice comparison with histopathology. Theranostics. 2017;7:228-37
8. Eiber M, Weirich G, Holzapfel K. et al. Simultaneous 68Ga-PSMA HBED-CC PET/MRI Improves the Localization of Primary Prostate Cancer. Eur Urol. 2016;70:829-836
9. Rhee H, Thomas P, Shepherd B. et al. Prostate Specific Membrane Antigen Positron Emission Tomography May Improve the Diagnostic Accuracy of Multiparametric Magnetic Resonance Imaging in Localized Prostate Cancer as Confirmed by Whole Mount Histopathology. J Urol. 2016;196:1261-7
10. Rowe SP, Gage KL, Faraj SF. et al. F-18-DCFBC PET/CT for PSMA-Based Detection and Characterization of Primary Prostate Cancer. J Nucl Med. 2015;56:1003-10
11. Hoffmann MA, Miederer M, Wieler HJ. et al. Diagnostic performance of (68)Gallium-PSMA-11 PET/CT to detect significant prostate cancer and comparison with (FEC)-F-18 PET/CT. Oncotarget. 2017;8:111073-83
12. Zamboglou C, Schiller F, Fechter T. et al. (68)Ga-HBED-CC-PSMA PET/CT Versus Histopathology in Primary Localized Prostate Cancer: A Voxel-Wise Comparison. Theranostics. 2016;6:1619-28
13. Rahbar K, Weckesser M, Huss S. et al. Correlation of Intraprostatic Tumor Extent with 68Ga-PSMA Distribution in Patients with Prostate Cancer. J Nucl Med. 2016;57:563-7
14. Donato P, Roberts MJ, Morton A. et al. Improved specificity with Ga-68 PSMA PET/CT to detect clinically significant lesions "invisible" on multiparametric MRI of the prostate: a single institution comparative analysis with radical prostatectomy histology. Eur J Nucl Med Mol Imaging. 2019;46:20-30
15. Zschaeck S, Lohaus F, Beck M. et al. PSMA-PET based radiotherapy: a review of initial experiences, survey on current practice and future perspectives. Radiat Oncol. 2018:13
16. Gorin MA, Rowe SP, Patel HD. et al. Prostate Specific Membrane Antigen Targeted (18)F-DCFPyL Positron Emission Tomography/Computerized Tomography for the Preoperative Staging of High Risk Prostate Cancer: Results of a Prospective, Phase II, Single Center Study. J Urol. 2018;199:126-32
17. Maurer T, Gschwend JE, Rauscher I. et al. Diagnostic Efficacy of (68)Gallium-PSMA Positron Emission Tomography Compared to Conventional Imaging for Lymph Node Staging of 130 Consecutive Patients with Intermediate to High Risk Prostate Cancer. J Urol. 2016;195:1436-42
18. van Leeuwen PJ, Emmett L, Ho B. et al. Prospective evaluation of 68Gallium-prostate-specific membrane antigen positron emission tomography/computed tomography for preoperative lymph node staging in prostate cancer. BJU Int. 2017;119:209-15
19. Zamboglou C, Wieser G, Hennies S. et al. MRI versus (68)Ga-PSMA PET/CT for gross tumour volume delineation in radiation treatment planning of primary prostate cancer. Eur J Nucl Med Mol Imaging. 2016;43:889-97
20. Surti S, Kuhn A, Werner ME. et al. Performance of Philips Gemini TF PET/CT scanner with special consideration for its time-of-flight imaging capabilities. J Nucl Med. 2007;48:471-80
21. Rausch I, Ruiz A, Valverde-Pascual I. et al. Performance evaluation of the Philips Vereos PET/CT system according to the NEMA NU2-2012 standard. J Nucl Med. 2018 [Epub ahead of print]
22. Souvatzoglou M, Weirich G, Schwarzenboeck S. et al. The sensitivity of [11C]choline PET/CT to localize prostate cancer depends on the tumor configuration. Clin Cancer Res. 2011;17:3751-9
23. Wolf I, Vetter M, Wegner I. et al. The medical imaging interaction toolkit. Med Image Anal. 2005;9:594-604
24. Fedorov A, Beichel R, Kalpathy-Cramer J. et al. 3D Slicer as an image computing platform for the Quantitative Imaging Network. Magn Reson Imaging. 2012;30:1323-41
25. Thomas L, Kantz S, Hung A. et al. (68)Ga-PSMA-PET/CT imaging of localized primary prostate cancer patients for intensity modulated radiation therapy treatment planning with integrated boost. Eur J Nucl Med Mol Imaging. 2018;45:1170-8
26. Vallieres M, Zwanenburg A, Badic B. et al. Responsible radiomics research for faster clinical translation. J Nucl Med. 2018;59:189-193
27. Hatt M, Tixier F, Pierce L. et al. Characterization of PET/CT images using texture analysis: the past, the present.. any future? Eur J Nucl Med Mol Imaging. 2017;44:151-65
28. Vallieres M, Freeman CR, Skamene SR. et al. A radiomics model from joint FDG-PET and MRI texture features for the prediction of lung metastases in soft-tissue sarcomas of the extremities. Phys Med Biol. 2015;60:5471-96
29. Carles M, Bach T, Torres-Espallardo I. et al. Significance of the impact of motion compensation on the variability of PET image features. Phys Med Biol. 2018;63:065013
30. El Naqa I, Grigsby P, Apte A. et al. Exploring feature-based approaches in PET images for predicting cancer treatment outcomes. Pattern Recognit. 2009;42:1162-71
31. Hatt M, Majdoub M, Vallieres M. et al. F-18-FDG PET Uptake Characterization Through Texture Analysis: Investigating the Complementary Nature of Heterogeneity and Functional Tumor Volume in a Multi-Cancer Site Patient Cohort. J Nuc Med. 2015;56:38-44
32. Chu A, Sehgal CM, Greenleaf JF. Use of Gray Value Distribution of Run Lengths for Texture Analysis. Pattern Recognit. 1990;11:415-9
33. Xu DH, Kurani AS, Furst JD. et al. Run-length encoding for volumetric texture. Proceedings of the Fourth IASTED International Conference on Visualization, Imaging, and Image Processing. 2004:534-9
34. Amadasun M, King R. Textural Features Corresponding to Textural Properties. IEEE Trans Syst Man Cybern Syst. 1989;19:1264-74
35. Heinze G, Schemper M. A solution to the problem of separation in logistic regression. Stat Med. 2002;21:2409-19
36. Gelman A. Scaling regression inputs by dividing by two standard deviations. Stat Med. 2008;27:2865-73
37. Benjamini Y, Hochberg Y. Controlling the False Discovery Rate - a Practical and Powerful Approach to Multiple Testing. J R Stat Soc Series B Stat Methodol. 1995;57:289-300
38. Wilczak W, Wittmer C, Clauditz T. et al. Marked Prognostic Impact of Minimal Lymphatic Tumor Spread in Prostate Cancer. Eur Urol. 2018;74:376-86
39. Swanson GP, Thompson IM, Basler J. Current status of lymph node-positive prostate cancer - Incidence and predictors of outcome. Cancer. 2006;107:439-50
40. Zschaeck S, Lohaus F, Beck M. et al. PSMA-PET based radiotherapy: a review of initial experiences, survey on current practice and future perspectives. Radiat Oncol. 2018;13:90
41. Zamboglou C, Thomann B, Koubar K. et al. Focal IMRT dose escalation for prostate cancer using PSMA PET/CT and MRI: a planning study. Radiother Oncol. 2018;127:S426-S7
42. Meyer AR, Joice GA, Allaf ME. et al. Integration of PSMA-targeted PET imaging into the armamentarium for detecting clinically significant prostate cancer. Curr Opin Urol. 2018;28:493-8
43. Mottet N, Bellmunt J, Bolla M. et al. EAU-ESTRO-SIOG Guidelines on Prostate Cancer. Part 1: Screening, Diagnosis, and Local Treatment with Curative Intent. Eur Urol. 2017;71:618-29
44. Divrik RT, Eroglu A, Sahin A. et al. Increasing the number of biopsies increases the concordance of Gleason scores of needle biopsies and prostatectomy specimens. Urol Oncol. 2007;25:376-82
45. San Francisco IF, DeWolf WC, Rosen S. et al. Extended prostate needle biopsy improves concordance of Gleason grading between prostate needle biopsy and radical prostatectomy. J Urol. 2003;169:136-40
46. Loeb S, Carter HB, Berndt SI. et al. Complications after prostate biopsy: data from SEER-Medicare. J Urol. 2011;186:1830-4
47. Bravaccini S, Puccetti M, Bocchini M. et al. PSMA expression: a potential ally for the pathologist in prostate cancer diagnosis. Sci Rep. 2018;8:4254
48. Marchal C, Redondo M, Padilla M. et al. Expression of prostate specific membrane antigen (PSMA) in prostatic adenocarcinoma and prostatic intraepithelial neoplasia. Histol Histopathol. 2004;19:715-8
49. Mannweiler S, Amersdorfer P, Trajanoski S. et al. Heterogeneity of prostate-specific membrane antigen (PSMA) expression in prostate carcinoma with distant metastasis. Pathol Oncol Res. 2009;15:167-72
50. Acosta AM, Al Rasheed MRH, Rauscher GH. et al. Tumor necrosis in radical prostatectomies with high-grade prostate cancer is associated with multiple poor prognostic features and a high prevalence of residual disease. Human Pathol. 2018;75:1-9
51. Briganti A, Larcher A, Abdollah F. et al. Updated Nomogram Predicting Lymph Node Invasion in Patients with Prostate Cancer Undergoing Extended Pelvic Lymph Node Dissection: The Essential Importance of Percentage of Positive Cores. Eur Urol. 2012;61:480-7
52. Traverso A, Wee L, Dekker A. et al. Repeatability and Reproducibility of Radiomic Features: A Systematic Review. Int J Radiat Oncol Biol Phys. 2018;102:1143-58
53. Leijenaar RTH, Nalbantov G, Carvalho S. et al. The effect of SUV discretization in quantitative FDG-PET Radiomics: the need for standardized methodology in tumor texture analysis. Sci Rep. 2015:5
54. Orlhac F, Soussan M, Maisonobe JA. et al. Tumor texture analysis in 18F-FDG PET: relationships between texture parameters, histogram indices, standardized uptake values, metabolic volumes, and total lesion glycolysis. J Nucl Med. 2014;55:414-22
55. Steenbergen P, Haustermans K, Lerut E. et al. Prostate tumor delineation using multiparametric magnetic resonance imaging: Inter-observer variability and pathology validation. Radiother Oncol. 2015;115:186-90
56. Rischke HC, Nestle U, Fechter T. et al. 3 Tesla multiparametric MRI for GTV-definition of Dominant Intraprostatic Lesions in patients with Prostate Cancer-an interobserver variability study. Radiat Oncol. 2013;8:183
57. Tixier F, Hatt M, Le Rest CC. et al. Reproducibility of tumor uptake heterogeneity characterization through textural feature analysis in 18F-FDG PET. J Nucl Med. 2012;53:693-700
58. Kesch C, Radtke JP, Wintsche A. et al. Correlation between genomic index lesions and mpMRI and Ga-68-PSMA-PET/CT imaging features in primary prostate cancer. Sci Rep. 2018:8
59. Carles M, Torres-Espallardo I, Alberich-Bayarri A. et al. Evaluation of PET texture features with heterogeneous phantoms: complementarity and effect of motion and segmentation method. Phys Med Biol. 2017;62:652-68
Author contact
![]() Corresponding author: Constantinos Zamboglou, Department of Radiation Oncology, University Medical Center Freiburg, Germany, Robert-Koch Straße 3, D-79106 Freiburg. Telephone: +4976127094620; Telefax: +497612709582039670; Email: constantinos.zambogloude
Corresponding author: Constantinos Zamboglou, Department of Radiation Oncology, University Medical Center Freiburg, Germany, Robert-Koch Straße 3, D-79106 Freiburg. Telephone: +4976127094620; Telefax: +497612709582039670; Email: constantinos.zambogloude