Theranostics
13.3
Impact Factor
- Current Issue
- Advance Articles
- Volume 16; 2026
- Volume 15; 2025
- Volume 14; 2024
- Volume 13; 2023
- Volume 12; 2022
- Archive
- Cover Images
- Cover Suggestion
- Special Issues
Top
Introduction
Results and Discussion
Conclusions
Materials and Methods
Acknowledgements
Supplementary Material
References
Introduction
Results and Discussion
Conclusions
Materials and Methods
Acknowledgements
Supplementary Material
References
International Journal of Biological Sciences
International Journal of Medical Sciences
 Global reach, higher impact

Theranostics 2019; 9(7):1851-1863. doi:10.7150/thno.32438 This issue Cite
Research Paper
Fully Automated, Label-Free Isolation of Extracellular Vesicles from Whole Blood for Cancer Diagnosis and Monitoring
Vijaya Sunkara1,2*, Chi-Ju Kim1,2*, Juhee Park2, Hyun-Kyung Woo1,2, Dongyoung Kim2, Hong Koo Ha3, Mi-Hyun Kim4, Youlim Son5, Jae-Ryong Kim5, Yoon-Kyoung Cho1,2 ![]()
1. Department of Biomedical Engineering, School of Life Sciences, Ulsan National Institute of Science and Technology (UNIST), Ulsan 44919, Republic of Korea;
2. Center for Soft and Living Matter, Institute for Basic Science (IBS), Ulsan 44919, Republic of Korea;
3. Department of Urology, Pusan National University Hospital, Pusan National University School of Medicine, Busan 49241, Republic of Korea;
4. Department of Internal Medicine, Pusan National University Hospital, 179, Gudeok-ro, Seo-Gu, Busan 49241, Republic of Korea;
5. Department of Biochemistry and Molecular Biology, Smart-aging Convergence Research Center, College of Medicine, Yeungnam University, Daegu 42415, Republic of Korea.
*These authors contributed equally to this work.
Received 2018-12-20; Accepted 2019-2-9; Published 2019-3-7
Citation:
Sunkara V, Kim CJ, Park J, Woo HK, Kim D, Ha HK, Kim MH, Son Y, Kim JR, Cho YK. Fully Automated, Label-Free Isolation of Extracellular Vesicles from Whole Blood for Cancer Diagnosis and Monitoring. Theranostics 2019; 9(7):1851-1863. doi:10.7150/thno.32438. https://www.thno.org/v09p1851.htm
Other stylesAbstract

Extracellular vesicles (EVs) that circulate in body fluids possess significant potential for disease diagnosis. Their use in clinical settings, however, has been limited owing to lack of simple and robust isolation methods. To rectify this problem, a centrifugal device for automatic, fast, and efficient isolation of EVs from whole-blood, called Exodisc-B is presented in this paper.
Methods: The device comprises a built-in chamber to facilitate plasma separation and two nanoporous filters—one for removing larger particles and the other for enriching EVs. The performance of the device in comparison to ultracentrifugation (UC) was evaluated by analyzing the yield, purity, protein and RNA content of the isolated EVs. Additionally, the EV protein marker expressions were measured by ELISA and statistically analyzed to differentiate prostate cancer patients from healthy donors.
Results: Compared with the UC technique, the proposed device is capable of isolating at least an order of magnitude higher number of EVs with about 30-fold higher mRNA count within 40 min. Sandwich ELISA of EV-specific membrane proteins—CD9-CD81—confirmed that Exodisc-B can isolate EVs from a volume of whole blood as low as 30 µL with a capture efficiency exceeding 75%. The device also facilitates temporal monitoring of tumor progression within live mouse xenograft models over a period of 13 weeks while using minimal volumes of weekly collected blood samples. Further, in ELISA analyses of multiple cancer-related proteins, such as prostate-specific antigen (PSA), prostate-specific membrane antigen (PSMA), epithelial cell adhesion molecule (EpCAM), epidermal growth factor receptor 1 (EGFR1), and heat shock protein 90 (HSP90), extracted from EVs isolated from human plasma, 43 patients were differentiated from 30 healthy donors.
Conclusion: The results demonstrated the ability of Exodisc-B to provide a rapid, sensitive, and point-of-care-type method for extracting intact EVs from small volumes of clinical blood samples for disease diagnosis and monitoring.
Keywords: extracellular vesicles, liquid biopsy, lab-on-a-disc, size-based filtration, ELISA
Introduction
Extracellular vesicles (EVs), which are cell-driven nanoscale vesicles that carry bioactive molecules such as proteins and nucleic acids, play an important role in several biological functions [1-4]. Interest in the use of EVs as biomarkers in liquid biopsy for precision medicine has recently increased because of their abundance in most body fluids and their ability to provide disease-specific molecular information, thereby reflecting the real-time physiological status of patients [5-9]. In particular, EVs hold significant promise for use as less-invasive biomarkers for cancer diagnosis and monitoring [10-13]. Unlike tissue samples, which are comparatively more invasive, prone to sampling errors owing to inherent spatial heterogeneity, unable to report temporal changes, and can only be obtained in limited quantities, circulating EVs provide collective information regarding cancers and can be repeatedly obtained from body fluids, thereby making real-time longitudinal monitoring of tumor progression and patient response to therapies more affordable [14-17]. However, a lack of fast, efficient, and robust EV-isolation techniques remains a major obstacle to widespread use of EV analysis as a routine test in research and clinical laboratories.
Currently, ultracentrifugation (UC) is the most widely used method for isolating EVs that involves multiple, time-consuming, and labor-intensive high-speed centrifugation steps to remove cells, cellular debris, and apoptotic bodies. However, high centrifugal forces generated during the isolation process may cause EV fusion and alter their structure and function [18, 19]. Several alternatives to the UC process have been proposed to facilitate better EV isolation via the use of immunoaffinity capture [20, 21], precipitation reagents [22], ultrafiltration [23], and microfluidics [24, 25]. Each of these techniques possesses its own advantages and disadvantages. For example, immunoaffinity capture can only isolate those EVs that contain the specific antibody used in their capture. Consequently, it is strongly dependent upon the sensitivity and the specificity of the antibody used, which may not provide consistent results considering the heterogeneity of EV population and the batch to batch variability. Similarly, the method involving the use of precipitation reagents requires less expensive equipment because of its reduced centrifugation speed requirements. However, polymer impurities imposed during the concerned process are highly unacceptable in many of the subsequent analysis procedures. EV-isolation methods employing ultrafiltration membranes require a large sample volume but return EVs with poor yields [26]. The use of microfluidic platforms suffers from relatively long processing times, incompatibility with downstream analyses, and a requirement for sophisticated fabrication steps. As can be inferred from the above discussion, currently available methods for EV isolation are not sufficiently mature to be considered acceptable for use in research and/or clinical applications, because their underlying protocol requires complicated manual operation, long processing times, and relatively large sample volumes. Furthermore, the quality of the enriched EVs samples is far from consistent.
Blood is the most commonly used specimen for health monitoring and disease diagnosis. At present, UC is the most widely used method for EV isolation from blood-plasma samples as well as cell cultures, although significant concerns have been raised as regards poor yield, impurity, and reproducibility issues [27, 28]. The major technical challenge with regard to UC stems from the complexity of blood plasma samples, which contain not only EVs, but also cells, lipoprotein particles, and proteins. In addition, the rather high viscosity and density of plasma samples tend to impede the otherwise quick and efficient isolation protocols. During high-speed centrifugation, protein aggregates are generated and co-precipitated along with EVs and lipoprotein particles of a similar size and density, thereby resulting in poor quantitative and qualitative performance during downstream analysis. Therefore, there is a critical and urgent need for a reliable method of isolating EVs from blood samples.
To realize robust and efficient isolation of intact EVs, a fully integrated centrifugal microfluidic device, called Exodisc, has previously been demonstrated to enrich EVs from urine and cell-culture supernatant within 30 min [29]. Exodisc can isolate EVs at relatively low g-force values (less than 500 g) via sequential and tangential flow-filtration processes involving the use of two nanofilters with pore diameters measuring 600 nm and 20 nm, positioned such that the direction of flow through the membrane remains perpendicular to that of the centrifugal pumping force. The results of subsequent quantitative analyses, including nanoparticle-tracking analysis (NTA), enzyme-linked immunosorbent assay (ELISA), and real-time polymerase chain reaction (PCR) of mRNA confirmed that a process incorporating Exodisc results in concentration and purity of isolated EVs that are significantly higher than those of the UC process [29].
In this study, Exodisc-B and Exodisc-P—which are optimized for EV isolation from blood and plasma samples, respectively, were developed. Exodisc-P, which is identical to Exodisc-B but has no blood separation chamber, is employed when pre-stored plasma samples are used. Exodisc-B/P can be operated using a point-of-care, small bench-top-sized operation system. With one simple manual injection of a whole-blood sample (30-600 μL) into Exodisc-B, the disc spinning system separates plasma and enriches EVs within 40 min in a fully automated manner. Exodisc-B/P can be operated by any personnel without the need for special training. This study demonstrates that using Exodisc-B/P can result in unbiased, intact EVs with higher yield and purity and higher mRNA and protein content than the UC process.
Figure 1
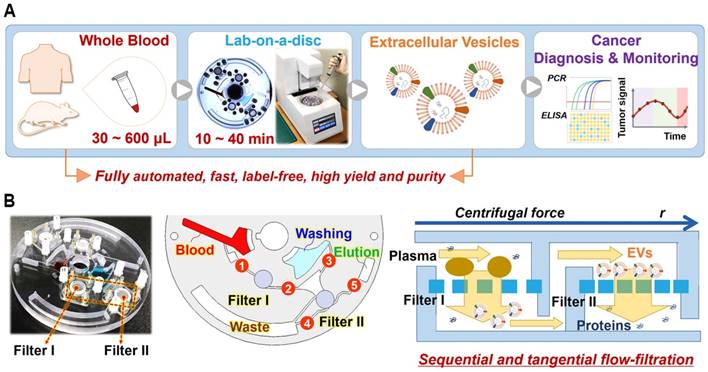
(A) Schematic demonstration of the process of EV isolation from whole blood on a disc using table-top-sized, custom-made spinning device, along with methods of subsequent analysis. (B) Photograph of Exodisc-B; schematic of Exodisc-B showing detailed microfluidic features and the working principle of the centrifugal double-filtration system.
In addition, continuous and real-time monitoring of tumor progression was realized using the EVs isolated from minimal amounts of plasma (< 30 μL per week) extracted from mouse xenograft models over a period of 13 weeks. The proof of concept of a longitudinal study performed on small live animals clearly demonstrated the unique and important advantage of the use of Exodisc-B/P, which can directly isolate EVs from a small volume of blood/plasma in a robust manner. In addition, the EVs contained in the plasma of 43 patients diagnosed with prostate cancer and 30 healthy donors were isolated using Exodisc-P and further analyzed for specific protein markers, including EV markers, CD9, CD63, CD81, along with cancer markers, such as prostate-specific antigen (PSA), prostate specific membrane antigen (PSMA), epithelial cell adhesion molecule (EpCAM), epidermal growth factor receptor 1 (EGFR1), and heat shock protein 90 (HSP90), via ELISA. The test results further confirmed the potential clinical utility of Exodisc-B/P for liquid biopsy.
Results and Discussion
Fully Automated EV Enrichment from Blood/Plasma Samples via Sequential, Tangential Flow-Filtration
The fully automated process for EV isolation from whole-blood samples using Exodisc-B and a benchtop spinning machine is depicted in Figure 1, along with the working principle of the sequential, tangential flow-filtration on a spinning disc. Exodisc-B comprises four sample storage and two filtration chambers connected by channels, with five individually addressable diaphragm (ID) valves (as depicted in Figure S1 and S2) for the automatic control of sequential transfer of liquid samples (Figure S3) [30, 31]. The entire process of EV isolation from whole blood, including plasma separation, pre-filtration, EV enrichment, washing, and elution, is fully automated and integrated on the disc (as described in Figure S3 and presented in Table S1). Plasma is separated from whole blood (Figure S3A) and transported through the filters to the waste chambers (Figures S3B-S3C). During filtration, large particles are trapped by the first filter, while residual proteins and lipoproteins are removed by a second filter. Following filtration, the EVs are washed (Figure S3D), and the solution at the bottom of the membrane is removed (Figure S3E). Finally, the enriched EVs are transferred to the elution chamber (Figure S3F). This entire EV enrichment process can be completed within 10-40 min depending upon the volume (30-600 μL) of the whole-blood sample used (refer to Supplementary Movie S1 for the complete process). Exodisc-P (Figures S1B-S1C) is identical to Exodisc-B but has no blood separation chamber.
Figure 2
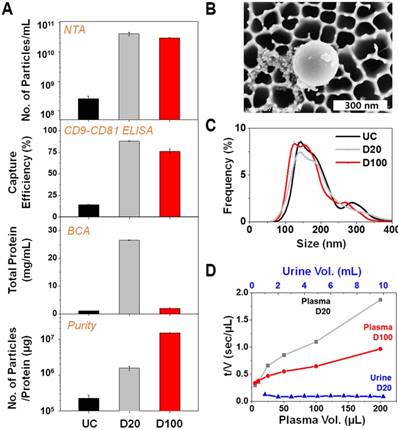
Membrane selection and comparison of EV yield and purity prepared via Exodisc (D20 and D100) and UC (ultracentrifugation). D20 denotes Exodisc integrated with 20 nm AAO membrane operated at 3000 rpm, D100 denotes Exodisc integrated with 100 nm AAO membrane and operated at 1200 rpm. (A) Number of EVs isolated by Exodisc and capture efficiency calculated based on CD9-CD81 ELISA data (D20 and D100 produced more EVs than UC), total protein quantification based on BCA measurements (higher protein contamination demonstrated in D20), purity measured by number of particles per total protein content (D100 yields the highest); (B) SEM image of EVs isolated via D100. (C) Size-distribution profiles of EVs isolated via UC and Exodisc. (D) Plot of inverse flow rate (t/V) as a function of plasma and urine volume; Error bars represent the mean ± s.e.m.
Optimization of Filter Membrane and Spinning Condition
In our previous study concerning Exodisc for EV isolation from urine and cell-culture media, the EVs were enriched on AAO membrane with pore diameters of 20 nm by spinning the disc at an optimum spin speed of 3000 rpm (412 g), termed D20 in this paper [29]. Barely any flow resistance existed when the EVs were enriched from urine samples (measuring less than 10 mL) under this condition. However, the same membrane was presumed to be not ideal for isolating EVs from plasma because blood plasma contains numerous proteins, including albumins (measuring approximately 3.8 nm in diameter and 15 nm in length) and globulins/globular proteins (measuring approximately 5-14 nm in diameter). To test this, Exodisc devices were constructed comprising AAO filters with larger pore diameters (100 nm) to isolate the EVs from blood-plasma samples. The minimum spin speed required for a complete sample transfer was 1200 rpm (66 g) for Exodisc equipped with membranes with pore diameters of 100 nm, D100. The capture efficiency decreased as the spinning speed increased though the size distribution remained similar and no aggregation observed in all the cases. (Figure S4).
Subsequently, the EVs isolated using Exodiscs (D20 and D100) and the UC process were compared in terms of particle number, capture efficiency, protein content, purity, process time, and particle-size distribution (Figure 2A and 2C). In all experiments, the EVs were isolated from the plasma samples obtained from a single healthy donor spiked with a known quantity of LNCaP cell-culture supernatant (LNEV). The plasma samples spiked with LNEV were used only for the performance evaluation to mimic the high particle concentration of the plasma sample from cancer patients and to obtain a large quantity of the same sample for direct comparison of the different disc operation conditions. In real sample tests using the plasma sample obtained from xenograft mouse or cancer patients or healthy donors, the plasma samples were used directly.
The number of particles isolated in Exodiscs was more than two orders of magnitude higher than that isolated using UC (Figure 2A). CD9-CD81 sandwich ELISA demonstrated capture efficiencies of approximately 88 ± 0.4%, 76 ± 2.8%, and 15 ± 0.4% for the D20, D100, and UC processes, respectively. The highest amount of total plasma proteins was retained within the samples prepared using D20, as the pore size is too small to filter off the plasma protein contaminants. The fraction of plasma proteins contained within the EV sample prepared by D100 from the input plasma sample (6 ± 0.1%) in comparison to that within EVs isolated via UC (4 ± 0.1%) could be attributable to the large number of particles enriched, which resulted in the isolation of very pure EVs in the D100 case. In addition, D100 showed low coefficient of variation (CV) of <7% for all the tested devices (Figure S5). The SEM images of 20 nm and 100 nm filters after plasma filtration on D20 and D100, respectively, (Figure S6A) clearly demonstrates that significant amount of plasma protein contaminants remained on the 20 nm filter along with the EVs. The overall EV-isolation process for D100 case was less than 30 min compared to 6 h and 70 min for UC and D20, respectively. Figure 2B and Figure S6B depict representative scanning electron microscopy (SEM) images of the EVs isolated using D100. Interestingly, the nanoparticle tracking analysis (NTA) data demonstrated no significant difference in the particle-size distributions of the EVs enriched by two different conditions of Exodisc operation (Figure 2C and Figure S7).
Membrane-filtration processes are widely used in industrial applications such as water treatment and particle separation. Typically, the filtration mechanism for liquid samples containing abundant particles can be explained by the “cake filtration” theory, wherein the curve representing the inverse flow rate (t/V) versus the cumulative volume (V) exhibits a linear relationship with the slope defined as the modified fouling index (MFI):
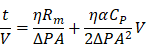
where t denotes the filtration time, η is the viscosity, Rm denotes the membrane resistance, ΔP denotes the transmembrane pressure, A denotes the membrane area; α denotes the specific resistance of the cake deposited, and CP denotes the concentration of the particles within the feed solution [32-35]. MFI is one of the most common fouling indices for predicting fouling problems concerning the membrane-filtration process. As shown in Figure 2D, the filtration time per unit volume of urine sample remains constant even up to 10 mL, which suggests that there is no membrane fouling. However, typical cake filtration behaviors were observed for plasma sample filtration for both D20 and D100, which suggests that the effective pore diameter could be much smaller than the original filter diameter. The MFI for D20 was estimated to be more than two times higher than its corresponding value for D100, indicating that membrane fouling via D20 results in less efficient particle filtration [33, 35].
Comparison of Plasma-Driven EVs isolated by Exodisc-P and UC
Following optimization of the membrane type and spinning conditions, the performance of Exodisc-P was compared to that of the UC process with regard to isolation of EVs from plasma samples spiked with a known amount of LNEV (Figure S8). Isolated EV samples were analyzed using NTA (Figure 3A), CD9-CD81 sandwich ELISA (Figure 3B), and BCA (Figure 3C). As observed during these analyses, the EV samples isolated using Exodisc-P demonstrated a broad linear dynamic range in volumes measuring between 5 and 200 µL of plasma sample. A detectable signal was obtained for EV isolation from samples measuring as small as 10 µL of plasma, thereby demonstrating the utility of Exodisc-P for isolating EVs from small sample volumes.
Figure 3
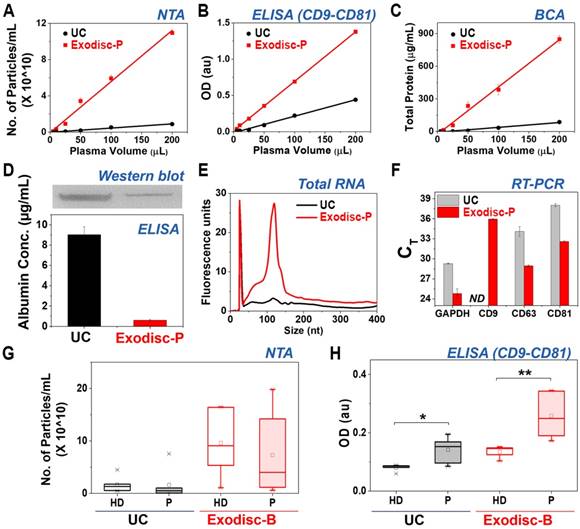
Analysis results for EVs isolated by Exodisc-B/P and UC. (A) NTA analysis, (B) CD9-CD81 ELISA, (C) BCA protein assay, (D) quantitative (ELISA) and qualitative (Western blot) analysis of albumin contamination of EVs prepared using Exodisc-P and UC, (E) RNA analysis of EVs of LNCaP cell-derived EVs-spiked plasma, (F) RT-PCR results, (G) NTA analysis, (H) CD9-CD81 ELISA (Note: Figures A-F show cases of plasma samples spiked with LNCaP cell-derived EVs, whereas (G-H) show cases of whole-blood clinical samples obtained from nine patients with cancer and five healthy donors, HD = healthy donors, P = patients). (A-D, F) markers/bars and error bars represent the mean ± s.e.m.; and (G, H) the box plot indicates the mean (white square within the box), 75th percentile (top line of the box), median (middle line of the box), 25th percentile (bottom line of the box), 5th and 95th percentiles (whiskers), and minimum and maximum measurements (crosses). Significance was tested by Student's t-test with p < 0.05 and p < 0.01 noted as * and **, respectively.
In addition, the EVs prepared using Exodisc-P demonstrated lower albumin content (0.61 ± 0.07 µg/mL) compared to those isolated via UC (9.03 ± 0.78 µg/mL), as measured by ELISA as well as western blot (Figure 3D). Moreover, when the EVs isolated from the 200 µL plasma sample were analyzed for proteins—via gel electrophoresis (Figure S9) and total RNA content—using a bioanalyzer (Figure 3E), the results demonstrated the presence of highly enriched proteins within the EV samples isolated by Exodisc-P along with a total RNA count of five times were contained within the UC-isolated sample. An RT-PCR analysis to determine the CT values for GAPDH, CD9, CD63, and CD81 using RNA isolated from the EV samples demonstrated that the Exodisc-P-isolated EV sample contained more than 30-times higher mRNA concentration than those within the UC-isolated sample (Figure 3F, Table S2). When the diluted plasma samples were used, the capture efficiency did not alter, while the filtration time was increased (Figure S10).
The EVs from clinical samples, including those obtained from nine cancer patients and five healthy donors were isolated and analyzed to further validate the performance of Exodisc-B. The obtained yield and EV protein markers were, once again, analyzed via NTA and CD9-CD81 sandwich ELISA. As depicted in Figure 3G and 3H, the proposed Exodisc-B isolated more particles with higher CD9-CD81 sandwich ELISA signals than the UC process. The total number of particles isolated on the disc was at least five times more than the corresponding number isolated via UC. Although no significant difference existed between the total number of particles collected from patients and healthy donors (Figure 3G), the CD9-CD81 sandwich ELISA signals demonstrated significant differences between healthy- and cancer-patient EVs isolated via UC, and use of Exodisc-B with higher signal and discrimination power was associated with the Exodisc-B-isolated sample (Figure 3H). These results suggest that Exodisc-B can be effectively used for the isolation of the EVs from clinical samples for subsequent analysis.
Monitoring Tumor Growth in Live Mouse Xenograft Models
The EVs hold significant potential for use in cancer diagnosis and monitoring; hence demonstrating a good correlation between the EV biomarker concentration and tumor burden has become critical [9]. Using the proposed Exodisc-B/P devices to efficiently isolate EVs from small blood/plasma volumes, this study demonstrates a time-course monitoring of EV proteins associated with tumor progression in live mouse models. Performing such an analysis has not previously been practical because of the highly sophisticated and complex EV-isolation processes and large sample-volume requirements of conventional EV-analysis methods. In this study, human PC3 cells representative of prostate cancer were subcutaneously injected into mice, and blood samples (measuring less than 100 µL) were collected each week while recording the body weight and tumor volume of each mouse (Figure 4A-4D). Plasma samples were collected from two groups of three tumor-bearing and three control mice on a weekly basis and stored at -80 ℃ to facilitate the use of conventional ELISA to measure the expression levels of EV protein markers. EV isolation from plasma was performed using Exodisc-P. The temporal changes in the expression levels of CD9 and CD81 along with those of other cancer markers, including PSMA, EGFR1, and HSP90, were analyzed from the lysates of the EVs isolated from individual tumor-bearing and control mice via direct ELISA (Figure 4E-4I). Three cancer-specific proteins—PSMA, EGFR1, and HSP90—demonstrated a temporal increase in tumor-bearing mice as early as the second week. In contrast, no significant changes were observed in their expression levels in the control mice, thereby indicating the diagnostic potential of EV markers with regard to prostate-cancer progression.
Protein-Marker Profiling of EVs from Cancer Patients' Plasma
The plasma samples drawn from 43 prostate-cancer (PCa) patients and 30 healthy donors (HD) were analyzed to investigate whether the proposed point-of-care Exodisc-P detects tumor-derived EVs from the plasma of cancer patients (refer to Table S3 for sample information). Prostate cancer, which is one of the most common types of cancers in men [36], is more likely to be successfully treated if diagnosed early. PSA testing along with digital rectal examination (DRE) constitute a common method used for early detection of prostate cancer, despite the lower sensitivity and specificity of the two methods [37]. Therefore, the lysates of the EVs isolated from prostate-cancer plasma samples were analyzed by direct ELISA for containment of cancer-associated markers (e.g., PSA, PSMA, EpCAM, EGFR1, and HSP90) along with the EV-specific markers, (e.g., CD9, CD63, and CD81) to identify the EV markers that demonstrate a higher diagnostic accuracy for prostate cancer.
Figure 5A depicts a heat map of normalized optical density (OD) measurement of proteins sorted by the HSP90 expression levels within each sample. As can be observed, each patient demonstrated a distinct profile for tested markers, because the expression levels of each marker differed in each individual. All markers used for analysis herein could significantly differentiate PCa from HD with representative p-values of less than 0.05 (CD81), 0.01 (CD63), 0.001 (CD9 and EGFR1), and 0.0001 (PSMA, PSA, EpCAM, and HSP90) (Figure 5B). Subsequently, receiver operating characteristic (ROC) analysis was used to determine the sensitivity, specificity, and accuracy of each individual marker (Figure 5C and S11), and the area under the ROC curve (AUC) for all markers was plotted with HSP90 demonstrating the highest value of 92% (Figure 5D). Figure 5E shows a waterfall plot of the HSP90 expression sorted from high (left) to low (right) for all samples, with each bar representing one individual.
The ROC curves corresponding to each marker were depicted separately with the corresponding values of their sensitivity, specificity, etc. listed in the form of a table in Figure S11. The HSP90 marker was observed to be the most sensitive in terms of all evaluation criteria. When multiple markers such as CD63, PSMA, and PSA were tested together with HSP90 using support vector machine (SVM) analysis, a combination of CD63+PSA+PSMA+HSP90 seems to be the most sensitive but the increase was rather minor compared to the HSP90 only case (Figure S12). The Spearman correlation of all markers tested resulted in generation of a few positive correlations for PCa samples with only one positive correlation (CD63-PSA) for HD samples (Figure S13). No correlation was observed between the EV-marker expression levels and the preoperative plasma-PSA levels of PCa patients (Figure S14). Similarly, no correlations were observed between other pathological factors such as tumor volume, Gleason score, tumor stage, and the expression levels of markers tested in this study (data not shown). However, the PCa samples with lymphatic/ perineural invasion demonstrated significantly higher expression levels of CD63, EGFR1, EpCAM, and HSP90 along with a larger tumor volume compared to samples void of lymphatic/perineural invasion (Figure S15).
Figure 4
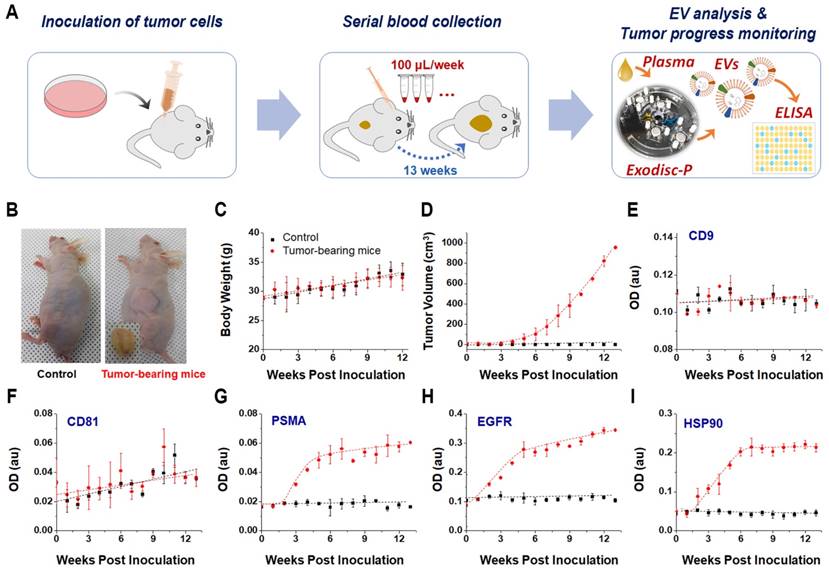
(A) Monitoring of tumor progression using plasma-driven EVs from mice xenograft models. (B) Representative images of control and a solid tumor-bearing mouse with the tumor mass, 13 weeks after subcutaneous inoculation of PC3 cells, tumor masses were removed and photographed. (C) Body-weight comparison between control and tumor-bearing mice over period after inoculation. (D) Increase in tumor volume over time observed in tumor-bearing mice. (E-I) direct ELISA results for EV and cancer-specific markers from lysates of isolated EVs. Error bars represent the mean ± s.e.m.
Figure 5
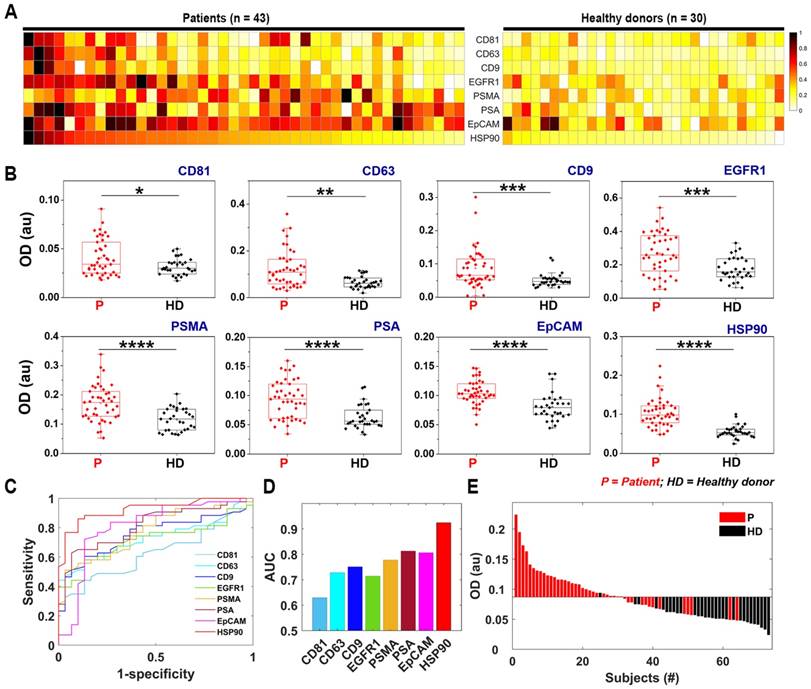
Protein typing of human-plasma-driven EVs extracted from prostate-cancer patients and healthy donors. (A) Heat map demonstrating normalized OD measurements sorting along HSP90 expression level for three EV markers CD81, CD63, and CD9 and five cancer markers EGFR1, PSMA, PSA, EpCAM, and HSP90 measured from lysates of EVs using direct ELISA. (B) Eight markers validated for 43 prostate-cancer patients and 30 healthy donors using direct ELISA; The box plot indicates the 75th percentile (top line of the box), median (middle line of the box), 25th percentile (bottom line of the box), and 5th and 95th percentiles (whiskers) with raw measurements in scattered dots. Significance was tested by Student's t-test with p < 0.05, p < 0.01, p < 0.001, and p < 0.0001 marked in *, **, ***, and ****, respectively. (C) ROC curves obtained for eight markers. (D) AUCs calculated for eight markers. (E) HSP90 expression in patient-plasma-driven EV (red) and healthy-donor-plasma-driven EV (black) demonstrated as waterfall plot. Cut-off (OD = 0.087) was obtained based on negative likelihood ratio (refer to Figure S11).
It has also been reported that EVs isolated from plasma of prostate cancer patients showed higher protein expression of PSA [38], PSMA [39], and EGFR [40]. In this study, the ROC analysis showed that prostate-specific (PSMA and PSA) and tumor-specific (EpCAM) EV markers exhibited relatively good AUC values: 0.78, 0.81, and 0.81 for PSMA, PSA, and EpCAM, respectively. In addition, interestingly, HSP90 demonstrated the highest sensitivity (86%), specificity (90%), accuracy (88%), and AUC (0.92), of all the test markers for the small sample cohort used in this study. HSP90, which is a member of heat-shock proteins, is known for its chaperoning activity to protect a number of proteins involved in cancer progression, thereby promoting cancer-cell survival [41-43]. It contains a number of client proteins, including the androgen receptor (AR), and participates in the development of resistance to cancer treatment. The inhibition of the HSP90-depleted AR-splice variant7 (AR-V7) and AR-full length in prostate-cancer cell lines expressing this variant have previously been demonstrated that [44]. Although studies are presently underway to target HSP90 in cancer therapy [45, 46], its utility as a diagnostic marker has not yet been reported for prostate cancer, except in a few recent studies that have demonstrated its presence in elevated levels within the serum of prostate cancer patients [47] and in exosomes released from prostate cancer cell lines that grow under hypoxic conditions [48]. In the case of EVs secreted from lymph‐node‐metastatic oral squamous cell carcinoma cells, it is reported that cancer cells secrete HSP90-enriched EVs, which play a critical role in tumor progression [49]. Moreover, the higher expression of HSP90 in the EVs were strongly correlated with poor prognosis of patients with head and neck cancers [49]. Additionally, HSP90 was also recognized as a distinctive exosome-specific melanoma signature [50]. Consequently, further research needs to be performed with a large patient cohort to validate the utility of HSP90 as a diagnostic marker in prostate-cancer detection.
Conclusions
EVs are increasingly being recognized as potentially valuable sources of biomarkers for early diagnosis of diseases as well as therapy monitoring [6, 12, 13, 51, 52]. However, the availability of efficient and user-friendly EV-isolation methods remains a major challenge inhibiting widespread acceptance of EV-analysis techniques in research laboratories and clinical translations. This study proposed Exodisc-B as a device that is capable of effectively performing automatic EV isolation from whole-blood samples in a point-of-care manner. Exodisc-B offers a rather simplistic, fast, and efficient means of realizing intact EV isolation in a reproducible manner from small sample volumes measuring as small as 30 µL of whole blood. Using the proposed device, the entire process of EV enrichment from whole-blood samples can be completed within 10-40 min, depending on the blood-sample volume used (30-600 µL), with a single manual sample injection step. The outputted highly enriched intact EVs can subsequently directly be used for conventional analyses, such as NTA, ELISA, and PCR, thereby demonstrating significantly higher performance than EV samples prepared via UC.
Taking advantage of the proposed device's ability to perform highly efficient enrichment of EVs from small volumes of plasma, the temporal changes in protein levels within the EVs of tumor-bearing mice were continuously monitored over a period of 13 weeks. The temporal analysis of such systems serves to improve the accuracy of biomarkers and aids in the monitoring of tumor growth and cancer progression. This study demonstrates that use of the proposed Exodisc-P can facilitate EV extraction from a minimal volume of plasma samples (less than 30 μL) collected weekly in accordance with the least painful protocol to be approved by the Institutional Animal Use and Care committee. The EVs thus isolated can be subsequently analyzed via conventional analysis techniques. As proof of concept, time-course ELISA measurements of five protein markers (CD9, CD81, PSMA, EGFR, and HSP-90) were performed. The results demonstrated a significant increase in cancer-associated markers (i.e., PSMA, EGFR, and HSP-90) in as early as two weeks after inoculation of tumor cells. The results of this study suggest that the Exodisc-B/P device can be routinely used in small animal cancer research studies, such as those geared toward early diagnosis of disease and continuous monitoring of drug response.
Furthermore, EV-specific protein markers such as CD9, CD63, and CD81, and cancer markers associated with EVs, including EpCAM, PSMA, PSA, HSP90, and EGFR1, were highly expressed in the EVs isolated from the plasma samples of patients suffering from prostate cancer compared to those isolated from plasma samples of age-matched healthy donors. Among the tested protein markers, cancer-associated protein markers, such as PSMA (AUC = 0.78), EpCAM (AUC = 0.81), PSA (AUC = 0.81), and HSP90 (AUC = 0.92), from the EVs performed satisfactorily with regard to differentiating cancer patients from healthy donors, clearly demonstrating that plasma-driven EVs are a valuable source of diagnostically significant biomarkers.
While it is promising and suggestive that Exodisc-B/P can be used to perform simple, rapid, and noninvasive blood tests facilitating early diagnosis of prostate cancer, we do acknowledge that its realization requires further prospective studies with more clinical samples and a larger cohort, including patients demonstrating early stages of prostate as well as other types of cancer. Though Exodisc-B/P can provide EVs in much higher yield and purity compared to UC method, it still contains a mixture of EVs with different sizes and subsets as well as non-EV contaminants such as low-density lipoprotein, which needs to be further improved. While it has a significant advantage for the enrichment of the EVs from a small volume of plasma sample, processing plasma samples larger than 1 mL is not practically possible with the current design of the disc. In addition, although the capability of Exodisc-B/P with regard to the continuous monitoring of tumor progression in small animals as well as diagnosis of human patients with prostate cancer has been well demonstrated, the proposed device must also be useful in terms of therapy monitoring and drug-resistance prediction, demonstration of which requires further studies to be performed with more clinical samples. Nevertheless, the current proof-of-concept study demonstrates a promising frontier with regard to point-of-care EV analysis offered by Exodisc-B/P capable of providing fully automated, fast, sensitive, and robust isolation of intact and subsequent-analysis-compatible EVs from whole-blood/plasma samples.
Materials and Methods
Design, fabrication and operation of the disc
The Exodisc structure was designed using a three-dimensional (3D) computer-aided design (CAD) program and fabricated by means of a CNC milling machine (M&I CNC Lab, Osan, South Korea). The top, middle, and bottom layers of polycarbonate (PC; IComponents Co. Ltd., Pyongtaek, South Korea) were milled in accordance with the 3D CAD model. Post milling, all layers were laminated using two pressure-sensitive, double-sided adhesives (DFM 200 clear 150 POLY H-9 V-95; FLEXcon, Spencer, MA, USA) and a customized pressing apparatus (Figure S1). The general procedure of fabricating a lab-on-a-disc integrated with a membrane filter has been described in our previously published works [29, 53]. Briefly, the procedure can be described as follows: each layer of the Exodisc device is fabricated via CNC milling, and the reverse side of the filtration chamber was carved for insertion of commercially available membranes, including a track-etched PC membrane (13-mm diameter and 0.6-μm pore size; SPI Supplies, West Chester, PA, USA) and an AAO membrane (13-mm diameter and 0.02- or 0.1-μm pore size; Whatman; Thermo Fisher Scientific, Waltham, MA, USA), as filters I and II, respectively. Reversible ID valves were automatically actuated in the same manner as that reported in extant studies (Figure S2) [30, 31].
The overall process of the EV enrichment from the whole-blood samples on a spinning disc was summarized in Figure S3 and Table S1. First, plasma samples (200 µL) were obtained from whole-blood (600 µL) by spinning the disc at 3600 rpm for 5 min (Figure S3A). Following plasma separation, valve #1 was opened, and the disc was made to rotate via spin step #2 to transfer 200 µL of separated plasma into the pre-filtration chamber (Figure S3B). Valve #2 was then opened, and the loaded plasma solution was transferred through the 600-nm TEPC and 100-nm AAO membranes into the waste chamber via spin step #3 (Figure S3C). During filtration, large particles are trapped by the 600-nm filter, and residual proteins and lipoproteins are removed by the 100-nm AAO filter. After filtration, valve #3 was opened, and a washing solution (1.6-mL) was transferred through the EV filtration chamber into the waste chamber via spin step #4 (Figure S3D). Next, the bottom solution below the AAO filter was removed via spin step #5 to eliminate impurities (Figure S3E). Finally, the enriched-plasma EVs were transferred into the elution chamber (Figure S3F).
Clinical samples preparation, handling, and storage
Whole-blood was collected from five healthy donors, three prostate cancer patients, and six lung cancer patients. The plasma samples were collected from 30 healthy donors and 43 prostate-cancer patients. All blood and plasma samples were obtained following approval by an institutional review board (IRB 1702-008-051). The biospecimens and corresponding data used in this study were provided by the Biobank of Pusan National University Hospital—a member of the Korea Biobank Network. Cancer-patient blood samples were obtained from the Pusan National University Hospital (IRB H1612-019-049), while blood/plasma samples of healthy donors were obtained from commercial sources (Innovative Research, MI) and volunteers at the Yeungnam University Medical Center (IRB 2018-04-011). Blood samples measuring 3 mL each were collected in a vacutainer EDTA collection tube and processed within 2 h after collection.
Preparation of LNEVs for spiking experiments
The EVs used for spiking whole-blood samples were isolated from LNCaP cells obtained from ATCC and cultured at the Roswell Park Memorial Institute medium (Gibco, Thermo Fisher Scientific) supplemented with 10% Exo-Free fetal bovine serum (Systems Biosciences Inc, CA, USA) and 1% antibiotics/antimycotics. The cells were incubated at 37 °C with 5% CO2. The cell-culture supernatant was collected after 48 h of culture and centrifuged at 300 g for 10 min to remove dead cells, followed by spinning at 2,000 g for 15 min at 4 °C to completely remove dead cells and cellular debris. The supernatant was filtered through a 600-nm filter to remove vesicles measuring more than 600 nm. The EVs were enriched using a disc comprising a 20-nm AAO membrane filter. A standard curve was drawn for CD9-CD81 ELISA using isolated EVs (Figure S8), and a known amount of enriched EVs was used to spike whole-blood samples for process optimization.
Ultracentrifugation (UC)
The EVs were isolated from whole-blood samples with or without spiked LNEV using the standard ultracentrifugation process. For plasma preparation, all steps were performed at RT. The whole-blood samples were initially centrifuged at 500 g for 10 min at RT to separate cellular components, and the supernatant, which contained platelet-rich plasma, was centrifuged twice at 2500 g for 15 min each at RT to remove platelets. The clear plasma was filtered through a 600-nm syringe filter and centrifuged in a Beckman Coulter Ultracentrifuge at 120,000 g for 90 min at 4 °C using a TLA 120.2 Ti fixed-angle rotor (Beckman Coulter) and 1.2 mL polycarbonate ultracentrifuge tubes to pellet EVs. To eliminate protein contaminants, the supernatant was carefully removed, and the EV pellets were resuspended in PBS and centrifuged again at 120,000 g for 90 min at 4 °C. The supernatant was removed, and the resulting EV pellets were resuspended in the desired volume of PBS to facilitate further analysis.
Nanoparticle tracking analysis (NTA)
The concentration and the size distribution of EVs were measured using an NTA system (Nanosight NS500; Malvern Instruments, Malvern, UK). The isolated EV samples were vortexed and diluted with 200-nm pre-filtered PBS to obtain the recommended 25-100 particles/frame of the NTA system. All measurements were performed under identical settings to ensure consistent results. Each sample was analyzed thrice, and mean values were plotted.
CD9-CD81 sandwich ELISA
An EVs solution was prepared to maintain identical input volumes for both isolation methods and to compare the efficiencies of the two EVs isolation methods (Exodisc and UC). A 96-well plate (Corning Inc., NY, USA, cat#3590) was coated with 50 μL of coating antibodies (10 μg/mL anti-CD9 in PBS buffer; MEM 61; Abcam, Cambridge, UK) and incubated overnight at 4 °C. The following morning, the plate was blocked with 1% bovine serum albumin (BSA)-PBS buffer at 37 °C for 1 h. After washing with 0.1% BSA-PBS buffer (washing buffer), the plate was further incubated with an EV solution in PBS buffer (50 μL) at RT for 2 h. Following removal of the solution, the plate was washed twice with washing buffer, followed by addition of biotin-conjugated secondary antibodies (anti-CD81; LifeSpan Biosciences, Inc., Seattle, WA, USA) in PBS buffer (50 μL; 500 ng/mL), and incubated at RT for 1 h. After washing thrice with the washing buffer, the plate was incubated with a solution of HRP-conjugated streptavidin in PBS buffer (50 μL; 1:500 for LNEV spiked samples and 1:200 for clinical samples) at RT for 30 min followed by three washing procedures using the washing buffer. TMB solution (50 μL) was subsequently added, and the plate was incubated at RT for 15 min, following which, 50 μL of stop solution was added to each well. Solution absorbance was measured using a plate reader spectrophotometer (TECAN, Morrisville, NC, USA) at 450 nm.
SEM imaging
The EVs enriched on D100 were fixed using 4% paraformaldehyde in PBS buffer at RT for 20 min. Subsequently, the EVs were washed once with PBS and successively subjected to serial dehydration with 50%, 70%, 90%, and 100% ethanol for 15 min each. Finally, 100% ethanol treatment was repeated, followed by drying of samples. The SEM images of the EVs isolated on D100 were acquired using the SU-8220 cold FE-SEM instrument (Hitachi high technologies, Japan).
Direct ELISA for EV & cancer specific markers
The EVs were lysed for 30 min using RIPA buffer containing 1% proteinase inhibitors on ice with gentle vortices generated at 10-min intervals. A 50-µL volume of 1:50 diluted EV lysates in PBS was used to coat each well of a 96-well plate (Corning Inc., NY, USA, cat#3590) and incubated overnight at 4 °C. The following morning, the plate was blocked with 1% bovine serum albumin (BSA)-PBS buffer at RT for 1 h. After washing with 0.1% BSA-PBS buffer (washing buffer), the plate was loaded with primary antibodies (Table S4) in PBS buffer (50 μL; 500 ng/mL) and incubated at RT for 1 h. After washing thrice with washing buffer, the plate was incubated along with a solution of HRP-conjugated detection antibodies in PBS buffer (50 μL) at RT for 20 min, followed by three washing procedures using the washing buffer. TMB solution (50 μL) was then added, and the plate was, again, incubated at RT for 15 min. Following which, 50 μL of stop solution was added to each well. Solution absorbance was measured using a plate reader spectrophotometer at 450 nm.
Mouse xenograft model to study tumor progression
Mice were cared for in compliance with the protocol approved by the Institutional Animal Use and Care committee of UNIST (IACUC-2013-013). To perform EV isolation and monitor protein markers within plasma, 5 × 10⁶ PC3 cells in 200 µL of PBS per mouse were subcutaneously injected into the left flank of three 8-week-old male nude mice. Likewise, in the control group, 200 µL PBS was injected into each of the three mice in the group. The blood samples (approximately 100 µL) were collected every week via retro-orbital blood collection for 13 weeks. Subsequently, the animals were sacrificed, and tumor masses were removed and photographed. Calipers were used to determine the tumor length and width, Tumor volume was estimated using the volume formula—D/2 × d2—where D denotes the largest diameter, while d refers to the shortest diameter.
Western blotting and SDS-PAGE gel
Exosome pellets were lysed in RIPA buffer with a protease inhibitor mixed with the sample buffer (Cell biolabs, CA, USA) and boiled for 5 min. Subsequently, the lysates were separated on a 10% SDS-PAGE gel (Pierce, Rockford, IL, USA) using a Mini-Protean TGX electrophoresis apparatus (Bio-rad, CA, USA). To facilitate immunoblotting, gels were equilibrated with a transfer buffer [250 mM Tris, 20% methanol (v/v), 200 mM glycine, pH 8.0] 10 min prior to transfer onto nitrocellulose membranes. The said transfer was performed via a cassette of tank transfer with a Mini-protean unit for 1 h at 100 V in accordance with the manufacturer instructions. Post transfer, the membranes were probed into using antibodies specific to albumin (R&D systems, USA). Immunodetection was then performed using HRP-labelled secondary antibodies and visualized using a LAS 4000 detection system in accordance with the manufacturer protocol (Amersham, UK).
RNA Extraction and RT-qPCR
To analyze gene expressions, total RNA was extracted from EVs isolated from 200 µL of plasma spiked with LNEVs using the miRNeasy kit (Qiagen). RNA integrity and quantity were analyzed using an RNA pico-sensitivity kit on a bioanalyzer (PerkinElmer). cDNA was prepared using a SuperScript VILO cDNA synthesis kit (Thermo Fisher Scientific). Real-time PCR was performed using the gene-expression master mix kit (Thermo Fisher Scientific) and Taqman probe with a QuantStudio 6 real-time PCR instrument (Thermo Fisher Scientific) using the following protocol: 50 °C for 2 min, 95 °C for 10 min followed by 40 cycles of 60 °C for 15 s, using the forward, probe, and reverse primers listed in Table S5. All samples were analyzed in triplicate. Data presented as mean ± SE.
Statistical analysis
Optical density (OD) measurements of ELISA assays were performed on 73 samples (i.e., 43 and 30 samples each from prostate-cancer patients and healthy donors, respectively). The measured OD values were normalized along each biomarker for all samples and sorted in descending order with respect to the HSP90-OD level. The normalized OD values were visualized on a heat map (Figure 5A), and eight markers were validated in patients diagnosed with prostate cancer and healthy donors by means of a box plot. A student's t-test was performed, and p-values below 0.05 were considered statistically to be significant—here, p < 0.05, p < 0.01, p < 0.001, and p < 0.0001 have been represented as *, **, ***, and ****, respectively (Figure 5B). Receiver operation characteristic (ROC) curves and metrics for classifying prostate-cancer patients and normal donors were obtained for each biomarker (Figures 5C-5D and Figure S11). The ROC metrics, (i.e., AUC, SE, accuracy, sensitivity, specificity, and negative likelihood ratio (NLR) cutoff) were calculated using standard approaches. OD measurements corresponding to HSP90 ELISA were depicted in the waterfall plot (Figure 5E). The cutoff value was given by NLR. All computations and visualizations were performed using MATLAB (MathWorks, USA) and OriginPro (OriginLab, USA) packages.
SVM classification
Binary support vector machine (SVM) classification models were created using a set of ELISA data (Figure S12). The SVM models are defined with the third-order polynomial kernel function and are validated by five-fold cross-validation. All the computation was performed using MATLAB classification learner application (MathWorks).
Acknowledgements
Work by V. Sunkara, C.J. Kim, H.K. Woo, H.K. Ha, M.H. Kim, and Y.K. Cho was supported by a grant from the Korean Health Technology R&D Project of the Ministry of Health & Welfare, Republic of Korea (A121994). Work by V. Sunkara, C.J. Kim, J. Park, and Y.K. Cho was supported by IBS-R020-D1 funded by the Korean Government. Work by J.R. Kim was supported by Medical Research Center Program (2015R1A5A2009124) through the National Research Foundation of Korea (NRF) funded by the Ministry of Science and ICT.
Author Contributions
The manuscript was compiled through contributions from all authors. All authors have provided approval for the final version of the manuscript.
Supplementary Material
Supplementary figures and tables.
Movie S1.
Competing Interests
The authors have declared that no competing interest exists.
References
1. van Niel G, D'Angelo G, Raposo G. Shedding light on the cell biology of extracellular vesicles. Nat Rev Mol Cell Biol. 2018;19:213-228
2. Yáñez-Mó M, Siljander PR, Andreu Z, Zavec AB, Borràs FE, Buzas EI. et al. Biological Properties of Extracellular Vesicles and Their Physiological Functions. J Extracell Vesicles. 2015;4:27066
3. Lo Cicero A, Stahl PD, Raposo G. Extracellular vesicles shuffling intercellular messages: for good or for bad. Curr Opin Cell Biol. 2015;35:69-77
4. Shao H, Im H, Castro CM, Breakefield X, Weissleder R, Lee H. New Technologies for Analysis of Extracellular Vesicles. Chem Rev. 2018;118:1917-1950
5. Torrano V, Royo F, Peinado H, Loizaga-Iriarte A, Unda M, Falcon-Perez JM. et al. Vesicle-MaNiA: extracellular vesicles in liquid biopsy and cancer. Curr Opin Pharmacol. 2016;29:47-53
6. Roy S, Hochberg FH, Jones PS. Extracellular vesicles: the growth as diagnostics and therapeutics; a survey. J Extracell Vesicles. 2018;7:1438720
7. Wu K, Xing F, Wu SY, Watabe K. Extracellular vesicles as emerging targets in cancer: Recent development from bench to bedside. Biochim Biophys Acta Rev Cancer. 2017;1868:538-563
8. Palmirotta R, Lovero D, Cafforio P, Felici C, Mannavola F, Pelle E. et al. Liquid biopsy of cancer: a multimodal diagnostic tool in clinical oncology. Ther Adv Med Oncol. 2018;10:1758835918794630
9. Chen G, Huang AC, Zhang W, Zhang G, Wu M, Xu W. et al. Exosomal PD-L1 contributes to immunosuppression and is associated with anti-PD-1 response. Nature. 2018;560:382-386
10. Gulei D, Irimie AI, Cojocneanu-Petric R, Schultze JL, Berindan-Neagoe I. Exosomes-Small Players, Big Sound. Bioconjug Chem. 2018;29:635-648
11. Xu R, Rai A, Chen M, Suwakulsiri W, Greening DW, Simpson RJ. Extracellular vesicles in cancer - implications for future improvements in cancer care. Nat Rev Clin Oncol. 2018;15:617-638
12. Liang K, Liu F, Fan J, Sun DL, Liu C, Lyon CJ. et al. Nanoplasmonic quantification of tumour-derived extracellular vesicles in plasma microsamples for diagnosis and treatment monitoring. Nat Biomed Eng. 2017;1:0021
13. Yang KS, Im H, Hong S, Pergolini I, Del Castillo AF, Wang R. et al. Multiparametric plasma EV profiling facilitates diagnosis of pancreatic malignancy. Sci Transl Med. 2017;9:eaal3226
14. Armstrong D, Wildman DE. Extracellular Vesicles and the Promise of Continuous Liquid Biopsies. J Pathol Transl Med. 2018;52:1-8
15. Gerlinger M, Rowan AJ, Horswell S, Math M, Larkin J, Endesfelder D. et al. Intratumor heterogeneity and branched evolution revealed by multiregion sequencing. N Engl J Med. 2012;366:883-892
16. Bedard PL, Hansen AR, Ratain MJ, Siu LL. Tumour heterogeneity in the clinic. Nature. 2013;501:355-364
17. Shao H, Chung J, Balaj L, Charest A, Bigner DD, Carter BS. et al. Protein typing of circulating microvesicles allows real-time monitoring of glioblastoma therapy. Nat Med. 2012;18:1835-1840
18. Wu M, Ouyang Y, Wang Z, Zhang R, Huang PH, Chen C. et al. Isolation of exosomes from whole blood by integrating acoustics and microfluidics. Proc Natl Acad Sci U S A. 2017;114:10584-10589
19. Linares R, Tan S, Gounou C, Arraud N, Brisson AR. High-speed centrifugation induces aggregation of extracellular vesicles. J Extracell Vesicles. 2015;4:29509
20. Yoo CE, Kim G, Kim M, Park D, Kang HJ, Lee M. et al. A direct extraction method for microRNAs from exosomes captured by immunoaffinity beads. Anal Biochem. 2012;431:96-98
21. He M, Crow J, Roth M, Zeng Y, Godwin AK. Integrated immunoisolation and protein analysis of circulating exosomes using microfluidic technology. Lab Chip. 2014;14:3773-3780
22. Rekker K, Saare M, Roost AM, Kubo AL, Zarovni N, Chiesi A. et al. Comparison of serum exosome isolation methods for microRNA profiling. Clin Biochem. 2014;47:135-138
23. Cheruvanky A, Zhou H, Pisitkun T, Kopp JB, Knepper MA, Yuen PST. et al. Rapid isolation of urinary exosomal biomarkers using a nanomembrane ultrafiltration concentrator. Am J Phy Renal Physiol. 2007;292:F1657-F1661
24. Sunkara V, Woo HK, Cho YK. Emerging techniques in the isolation and characterization of extracellular vesicles and their roles in cancer diagnostics and prognostics. Analyst. 2016;141:371-381
25. Wang W, Luo J, Wang S. Recent Progress in Isolation and Detection of Extracellular Vesicles for Cancer Diagnostics. Adv Healthc Mater. 2018;7:e1800484
26. Lobb RJ, Becker M, Wen SW, Wong CS, Wiegmans AP, Leimgruber A. et al. Optimized exosome isolation protocol for cell culture supernatant and human plasma. J Extracell Vesicles. 2015;4:27031
27. Böing AN, van der Pol E, Grootemaat AE, Coumans FA, Sturk A, Nieuwland R. Single-Step Isolation of Extracellular Vesicles By Size-Exclusion Chromatography. J Extracell Vesicles. 2014;3:23430
28. Baranyai T, Herczeg K, Onodi Z, Voszka I, Modos K, Marton N. et al. Isolation of Exosomes from Blood Plasma: Qualitative and Quantitative Comparison of Ultracentrifugation and Size Exclusion Chromatography Methods. PLoS One. 2015;10:e0145686
29. Woo HK, Sunkara V, Park J, Kim TH, Han JR, Kim CJ. et al. Exodisc for Rapid, Size-Selective, and Efficient Isolation and Analysis of Nanoscale Extracellular Vesicles from Biological Samples. ACS Nano. 2017;11:1360-1370
30. Kim CJ, Park J, Sunkara V, Kim TH, Lee Y, Lee K. et al. Fully automated, on-site isolation of cfDNA from whole blood for cancer therapy monitoring. Lab Chip. 2018;18:1320-1329
31. Kim TH, Sunkara V, Park J, Kim CJ, Woo HK, Cho YK. A lab-on-a-disc with reversible and thermally stable diaphragm valves. Lab Chip. 2016;16:3741-3749
32. Koo CH, Mohammad AW, Suja' F, Talib MZM. Review of the effect of selected physicochemical factors on membrane fouling propensity based on fouling indices. Desalination. 2012;287:167-177
33. Boerlage SFE, Kennedy MD, Dickson MR, El-Hodali DEY, Schippers JC. The modified fouling index using ultrafiltration membranes (MFI-UF): characterisation, filtration mechanisms and proposed reference membrane. J Memb Sci. 2002;197:1-21
34. Schippers JC, Verdouw J. Modified Fouling Index, a Method of Determining the Fouling Characteristics of Water. Desalination. 1980;32:137-148
35. Alhadidi A, Kemperman AJB, Blankert B, Schippers JC, Wessling M, van der Meer WGJ. Silt Density Index and Modified Fouling Index relation, and effect of pressure, temperature and membrane resistance. Desalination. 2011;273:48-56
36. Global Burden of Disease Cancer C, Fitzmaurice C, Allen C, Barber RM, Barregard L, Bhutta ZA. et al. Global, Regional, and National Cancer Incidence, Mortality, Years of Life Lost, Years Lived With Disability, and Disability-Adjusted Life-years for 32 Cancer Groups, 1990 to 2015: A Systematic Analysis for the Global Burden of Disease Study. JAMA Oncol. 2017;3:524-548
37. Crawford ED, Leewansangtong S, Goktas S, Holthaus K, Baier M. Efficiency of prostate-specific antigen and digital rectal examination in screening, using 4.0 ng/ml and age-specific reference range as a cutoff for abnormal values. Prostate. 1999;38:296-302
38. Logozzi M, Angelini DF, Iessi E, Mizzoni D, Di Raimo R, Federici C. et al. Increased PSA expression on prostate cancer exosomes in in vitro condition and in cancer patients. Cancer Lett. 2017;403:318-329
39. Park YH, Shin HW, Jung AR, Kwon OS, Choi YJ, Park J. et al. Prostate-specific extracellular vesicles as a novel biomarker in human prostate cancer. Sci Rep. 2016;6:30386
40. Kharmate G, Hosseini-Beheshti E, Caradec J, Chin MY, Tomlinson Guns ES. Epidermal Growth Factor Receptor in Prostate Cancer Derived Exosomes. PloS ONE. 2016;11:e0154967
41. Whitesell L, Lindquist SL. HSP90 and the chaperoning of cancer. Nat Rev Cancer. 2005;5:761-772
42. Schopf FH, Biebl MM, Buchner J. The HSP90 chaperone machinery. Nat Rev Mol Cell Biol. 2017;18:345-360
43. Calderwood SK, Gong J. Heat Shock Proteins Promote Cancer: It's a Protection Racket. Trends Biochem Sci. 2016;41:311-323
44. Ferraldeschi R, Welti J, Powers MV, Yuan W, Smyth T, Seed G. et al. Second-Generation HSP90 Inhibitor Onalespib Blocks mRNA Splicing of Androgen Receptor Variant 7 in Prostate Cancer Cells. Cancer Res. 2016;76:2731-2742
45. Centenera MM, Fitzpatrick AK, Tilley WD, Butler LM. Hsp90: still a viable target in prostate cancer. Biochim Biophys Acta. 2013;1835:211-218
46. Jhaveri K, Taldone T, Modi S, Chiosis G. Advances in the clinical development of heat shock protein 90 (Hsp90) inhibitors in cancers. Biochim Biophys Acta. 2012;1823:742-755
47. Burgess EF, Ham AJ, Tabb DL, Billheimer D, Roth BJ, Chang SS. et al. Prostate cancer serum biomarker discovery through proteomic analysis of alpha-2 macroglobulin protein complexes. Proteomics Clin Appl. 2008;2:1223
48. Ramteke A, Ting H, Agarwal C, Mateen S, Somasagara R, Hussain A. et al. Exosomes secreted under hypoxia enhance invasiveness and stemness of prostate cancer cells by targeting adherens junction molecules. Mol Carcinog. 2015;54:554-565
49. Ono K, Eguchi T, Sogawa C, Calderwood SK, Futagawa J, Kasai T. et al. HSP-enriched properties of extracellular vesicles involve survival of metastatic oral cancer cells. J. Cell Biochem. 2018;119:7350-7362
50. Peinado H, Alečković M, Lavotshkin S, Matei I, Costa-Silva B, Moreno-Bueno G. et al. Melanoma exosomes educate bone marrow progenitor cells toward a pro-metastatic phenotype through MET. Nat Med. 2012;18:883-891
51. Choi DS, Lee J, Go G, Kim YK, Gho YS. Circulating extracellular vesicles in cancer diagnosis and monitoring: an appraisal of clinical potential. Mol Diagn Ther. 2013;17:265-271
52. Heitzer E, Perakis S, Geigl JB, Speicher MR. The potential of liquid biopsies for the early detection of cancer. NPJ Precis Oncol. 2017;1:36
53. Lee A, Park J, Lim M, Sunkara V, Kim SY, Kim GH. et al. All-in-one centrifugal microfluidic device for size-selective circulating tumor cell isolation with high purity. Anal Chem. 2014;86:11349-11356
Author contact
![]() Corresponding author: E-mail: ykchoac.kr
Corresponding author: E-mail: ykchoac.kr
Citation styles
APA
Sunkara, V., Kim, C.J., Park, J., Woo, H.K., Kim, D., Ha, H.K., Kim, M.H., Son, Y., Kim, J.R., Cho, Y.K. (2019). Fully Automated, Label-Free Isolation of Extracellular Vesicles from Whole Blood for Cancer Diagnosis and Monitoring. Theranostics, 9(7), 1851-1863. https://doi.org/10.7150/thno.32438.
ACS
Sunkara, V.; Kim, C.J.; Park, J.; Woo, H.K.; Kim, D.; Ha, H.K.; Kim, M.H.; Son, Y.; Kim, J.R.; Cho, Y.K. Fully Automated, Label-Free Isolation of Extracellular Vesicles from Whole Blood for Cancer Diagnosis and Monitoring. Theranostics 2019, 9 (7), 1851-1863. DOI: 10.7150/thno.32438.
NLM
Sunkara V, Kim CJ, Park J, Woo HK, Kim D, Ha HK, Kim MH, Son Y, Kim JR, Cho YK. Fully Automated, Label-Free Isolation of Extracellular Vesicles from Whole Blood for Cancer Diagnosis and Monitoring. Theranostics 2019; 9(7):1851-1863. doi:10.7150/thno.32438. https://www.thno.org/v09p1851.htm
CSE
Sunkara V, Kim CJ, Park J, Woo HK, Kim D, Ha HK, Kim MH, Son Y, Kim JR, Cho YK. 2019. Fully Automated, Label-Free Isolation of Extracellular Vesicles from Whole Blood for Cancer Diagnosis and Monitoring. Theranostics. 9(7):1851-1863.
This is an open access article distributed under the terms of the Creative Commons Attribution (CC BY-NC) license (https://creativecommons.org/licenses/by-nc/4.0/). See http://ivyspring.com/terms for full terms and conditions.