Theranostics
13.3
Impact Factor
- Current Issue
- Advance Articles
- Volume 16; 2026
- Volume 15; 2025
- Volume 14; 2024
- Volume 13; 2023
- Volume 12; 2022
- Archive
- Cover Images
- Cover Suggestion
- Special Issues
Top
Introduction
Methods
Results
Discussion
Abbreviations
Supplementary Material
Acknowledgements
References
Introduction
Methods
Results
Discussion
Abbreviations
Supplementary Material
Acknowledgements
References
International Journal of Biological Sciences
International Journal of Medical Sciences
 Global reach, higher impact

Theranostics 2019; 9(3):900-919. doi:10.7150/thno.29515 This issue Cite
Research Paper
CircHMGCS1 Promotes Hepatoblastoma Cell Proliferation by Regulating the IGF Signaling Pathway and Glutaminolysis
Ni Zhen1,3*, Song Gu2*, Ji Ma3*, Jiabei Zhu3, Minzhi Yin4, Min Xu2, Jing Wang2, Nan Huang1, Zhongqi Cui1, Zhixuan Bian3, Fenyong Sun1 ![]() , Qiuhui Pan3
, Qiuhui Pan3 ![]()
1. Department of Clinical Laboratory Medicine, Shanghai Tenth People's Hospital of Tongji University, Shanghai, 200072, China.
2. Department of Surgery, Shanghai Children's Medical Center, School of medicine, Shanghai Jiaotong University, Shanghai, 200127, China.
3. Department of Clinical Laboratory Medicine, Shanghai Children's Medical Center, School of medicine, Shanghai Jiaotong University, Shanghai, 200127, China.
4. Department of Pathology, Shanghai Children's Medical Center, School of medicine, Shanghai Jiaotong University, Shanghai, 200127, China.
*The first three authors should be regarded as joint First Authors.
Received 2018-8-27; Accepted 2018-12-29; Published 2019-1-25
Citation:
Zhen N, Gu S, Ma J, Zhu J, Yin M, Xu M, Wang J, Huang N, Cui Z, Bian Z, Sun F, Pan Q. CircHMGCS1 Promotes Hepatoblastoma Cell Proliferation by Regulating the IGF Signaling Pathway and Glutaminolysis. Theranostics 2019; 9(3):900-919. doi:10.7150/thno.29515. https://www.thno.org/v09p0900.htm
Other stylesAbstract

Circular RNAs (circRNAs), a novel class of endogenous RNAs, have been recently shown to participate in cellular development and several pathophysiological processes. The identification of dysregulated circRNAs and their function in cancer have attracted considerable attention. Nevertheless, the expression profile and role of circRNAs in human hepatoblastoma (HB) remain to be studied. In this report, we analyzed the expression prolife of circRNAs in HB tissues and identified circHMGCS1 (3-hydroxy-3-methylglutaryl-CoA synthase 1; hsa_circ_0072391) as a remarkably upregulated circRNA.
Methods: The expression prolife of circRNAs in HB tissues were investigated through circRNA sequencing analyses. ISH and qRT-PCR assays were performed to measure the expression level of circHMGCS1. The effect of knocking down circHMGCS1 in HB cells in vitro and in vivo were evaluated by colony formation assay, flow cytometry, xenograft tumors assay and untargeted metabolomics assay. MRE analysis and dual luciferase assay were performed to explore the underlying molecular mechanisms.
Results: HB patients with high circHMGCS1 expression have shorted overall survival. Knockdown of circHMGCS1 inhibits HB cells proliferation and induces apoptosis. CircHMGCS1 regulates IGF2 and IGF1R expression via sponging miR-503-5p, and affects the downstream PI3K-Akt signaling pathway to regulate HB cell proliferation and glutaminolysis.
Conclusions: The circHMGCS1/miR-503-5p/IGF-PI3K-Akt axis regulates the proliferation, apoptosis and glutaminolysis of HB cells, implying that circHMGCS1 is a promising therapeutic target and prognostic marker for HB patients.
Keywords: hepatoblastoma, circHMGCS1, IGF2, GLS, competing endogenous RNAs
Introduction
Hepatoblastoma (HB), a cancer that originates from abnormal stem cells and hepatic epithelial progenitor cells, is a malignant embryonal hepatic neoplasm frequently occurring in infants and toddlers, and it accounts for approximately 80% of pediatric hepatic cancers [1]. This childhood hepatic cancer has garnered much attention because of its nonspecific symptoms and incipient development, resulting in an unfavorable prognosis for many HB patients [2]. Currently, the mainstream treatments for HB are adjuvant chemotherapy, hepatectomy, and liver transplantation. Unfortunately, the mortality of high risk patients is still over 35% [3]. The serum AFP level is considered as the most important diagnostic marker for HB due to its elevation in 90% of patients with tumor [3, 4]. However, the clarification of AFP measurements lacks specificity for the naturally high serum level in infants and pathologically increase in patients with benign liver tumors [5]. What's more, extremely low AFP levels are associated with poor prognosis [6]. Although wnt/β-Catenin pathway and Myc signaling have been reported to be abnormally stimulated in HB [7,8], the precise etiology of HB is still unknown. Hence, it is urgent to elucidate the pathogenesis and the molecular mechanisms of HB progression, so that more reliable diagnostic biomarkers and effective therapeutic methods can be developed and the prognosis of HB patients can be improved.
Circular RNAs (CircRNAs), a novel class of endogenous RNAs extensively expressed in mammals, are characterized by distinct covalently closed loops without 5' to 3' polarity and polyadenylated tails, which are formed by backsplicing events [9]. In the early decades of circRNA research, circRNAs were misapprehended as a group of biologically inactive byproducts generated by splicing errors [10]. Currently, circRNAs are known to be an abundant class of highly conserved, tissue-specific RNA molecules that are more stable than linear RNAs, which cannot tolerate RNase R digestion [11]. Accumulating studies have found that circRNAs are involved in various physiological and pathophysiological processes, for instance, modulating alternative splicing [12], serving as microRNA (miRNA) sponges [13], and regulating protein-RNA interactions [14] and parental genes at the transcription level [15]. Recently, numerous circRNAs have been identified to be dysregulated and play significant roles in carcinogenesis in various cancers , such as colorectal cancer [16], hepatocellular carcinoma [17], and squamous carcinoma of larynx [18]. Moreover, current discoveries have suggested that circRNAs have great potential as biomarkers for the diagnosis or prognosis of several cancers due their tissue-specific expression patterns and remarkable stability [9, 19]. Nevertheless, the expression profiles, function and underlying molecular mechanisms of newly identified circRNAs in HB warrant further investigation [20].
Here, we analyzed the expression profile of circRNAs in HB tissues through circRNA sequencing and discovered that circHMGCS1 (hsa_circ_0072391) was dramatically upregulated in HB tissues and negatively correlated with the prognosis of HB patients. More importantly, we found that circHMGCS1 exert its oncogenic role in HB cells via sponging tumor suppressor miR-503-5p to upregulate IGF-PI3K-Akt signaling pathway and manipulating glutamine metabolism. Our findings provided a new insights into the treatment and diagnosis of HB.
Methods
circRNA profiling analysis
Total RNA extracted from 5 paired HB and matched normal tissue samples was treated with RNase R (Epicentre, Madison, U.S.A) and the Ribo-Zero Magnetic Gold Kit (Epicentre, Madison, U.S.A) for circRNA enrichment and ribosomal RNA (rRNA) removal, respectively. Then, the rRNA-depleted RNA samples were fragmented and reverse transcribed to synthesize cDNA template using SuperScript II Reverse Transcriptase (Invitrogen, Carlsbad, California, USA), followed by end repair, addition of an A at the 3' end of the DNA fragments and ligation to strand-specific adapters. The ligated cDNA products were purified, and the second-strand cDNA was removed. Then, purified first-strand cDNA was amplified with 16 cycles of PCR, and strand-specific RNA-seq libraries were constructed using the VAHTS Total RNA-Seq (H/M/R) Library Prep Kit for Illumina (San Diego, U.S.A). The cDNAs were captured on Illumina Flow cells (Illumina), followed by cluster amplification in situ and sequencing on a 150 bp, paired-end HiSeq X Ten platform (Illumina). The FASTQ reads of each sample were first aligned to the human reference genome (hg38) using the BWA-MEM algorithm, and then all the unmapped reads were applied to identify circRNAs according to previously published reports [21].
The relative expression of a circRNA was denoted as spliced reads per billion mapping (SRPBM) reads [22], which were calculated by counting the number of total reads aligned to hg38 in each sample and normalizing the number of backsplice-spanning reads to read length and the number of total mapped reads (units in billion). Hence, the formula of SRPBM: number of circular reads/number of mapped reads (units in billion)/ read length. The differentially expressed circRNAs between HB tissues and matched normal tissues were analyzed using the edgeR bioconductor package, which executes an accurate statistical analysis of multigroup experiments and performs statistical procedures for evaluating the differential expression of RNA-seq data [23]. In the study, a p-value ≤0.05 and fold change ≥2 were used as the standard for screening differentially expressed circRNAs. These circRNAs were annotated according to the RefSeq database [24]. The parental genes of differentially expressed circRNAs were then subjected to KEGG pathway analysis.
Clinical samples and cell lines
Matched HB tissues and normal liver tissues from 64 HB patients undergoing hepatectomy were acquired from the surgical department of Shanghai Children's Medical Center (Shanghai, China), and detailed clinicopathological information of each tissue sample was available. Matched normal tissue samples were obtained 3cm away from the HB tissue edge and were confirmed to contain no tumor cells by two specialized pathologists. None of the patients had received radiotherapy or chemotherapy prior to surgery. The study was approved by the Ethics Committee of Shanghai Children's Medical Center, and written informed consent was obtained from all patients.
Human HB cell line HUH6, human normal hepatocyte cell lines (L-O2 and HL-7702) and human hepatocellular carcinoma cell lines (SMMC-7721 and Bel-7404) were purchased from Cell Bank of Type Culture Collection of the Chinese Academy of Sciences (Shanghai, China). Human HB cell line HepG2 and HEK293T cells were purchased from American Type Culture Collection (ATCC) (Maryland, U.S.A). HepG2 cells were cultured in minimum Eagle's medium (MEM), while the other cells were cultured in Dulbecco's modified Eagle's medium (DMEM), with the addition of 10% fetal bovine serum (FBS) and 1% antibiotic, in an incubator with 5% CO2 at 37°C.
Oligonucleotide transfection and lentivirus transduction
MiRNA mimics, miRNA inhibitors and small interfering RNAs (siRNAs) were chemically synthesized by GenePharma. The sequences are provided in the supplemental material (Table S2). HepG2 and HUH6 cells were transfected with the oligonucleotides using Lipofectamine 2000 (Invitrogen) according to the manufacturer's instructions.
The shRNA against circHMGCS1 and the control shRNA were purchased from General Biosystems (Anhui, China) to construct circHMGCS1 stable knockdown cell lines. To construct circHMGCS1 stable overexpression cell lines, circHMGCS1 coding sequence was constructed into pLCDH-ciR vector (Geenseed Biotech, Guangzhou, China) (Figure S1).
RNA extraction and qRT-PCR
RNA from the nuclear and cytoplasmic fractions were extracted with the PARIS™ Kit (Invitrogen, AM1921) according to the manufacturer's protocol. Total RNA from the whole-cell lysates or tissues was isolated using TRIzol reagent (Invitrogen). Agarose gel electrophoresis assay was performed to detect the quality of total RNA extracted from tissues. To determine the expression of mRNA, mature miRNA and circRNA, PrimeScript™ RT Reagent Kit (Takara, DRR0037A; Takara, Dalian, China) and KAPA SYBR® FAST qPCR Kit Master Mix (2X) Universal (Applied Biosystems, Forster City, California, USA) were used. Specific divergent primers for circHMGCS1 were utilized to detect its abundance. The 2-ΔΔCT method was applied for relative quantitation. The ΔΔCT method was employed for Pearson's correlation analysis [25]. The expression of circHMGCS1 and mRNA was normalized using 18s rRNA as an internal calibrator. The expression of miRNA was normalized using U6 snRNA as an internal calibrator. The primers are listed in Supplementary Table S2.
In situ hybridization
In situ hybridization (ISH) was used to evaluate the expression level of circHMGCS1 in tissues. Briefly, ISH was performed on formalin-fixed, paraffin-embedded tissue sections from HB tissues and matched normal tissues (n=27). After deparaffinization, digestion with proteinase K, washing and prehybridization, tissue sections were hybridized with specific digoxygenin (DIG)-labeled probes for circHMGCS1 overnight, followed by 3 washes in citrate buffer. Afterwards, slides were incubated with anti-DIG Fab fragments, and the specific hybridization reaction was observed using DAB substrate. The sequence of the circHMGCS1 probe for ISH is supplied in Table S2. Two specialized pathologists who were blinded to the clinical information of these tissue specimens were invited to analyze the staining intensities of tissues at two magnifications (100× and 200×).
Immunohistochemistry
The protein level of IGF2 in tissues was examined by immunohistochemistry (IHC). Briefly, IHC was carried out on paraffin-embedded tissue sections from HB tissues and matched normal tissues (n=27). After deparaffinization, hydration, antigen retrieval and blocking of endogenous peroxidase and nonspecific binding, tissue sections were incubated with primary antibody against IGF2 (abcam, ab9574, Cambridge, UK) overnight at 4°C, followed by incubation with biotinylated secondary anti-Rabbit IgG antibody and peroxidase-labeled streptavidin at room temperature for 15 min. Then, the antigen was visualized after incubation with diaminobenzidine chromogenic substrate at room temperature for 10 min. Representative images were photographed under an inverted microscope (Leica). Two specialized pathologists who were blinded to the clinical information of these tissue specimens were invited to analyze the staining intensities of tissues at two magnifications (100× and 200×).
Colony formation assay and cell proliferation assay
For the colony formation assay, cells were seeded into 12-well plates at a density of 1000 cells per well. The cells in the plates were incubated for approximately 7-10 days in fresh medium, washed with PBS, fixed with 95% ethanol and stained with 0.1% crystal violet. Ultimately, the numbers of cell colonies representing colony-forming ability were imaged.
For the CCK8 assay, 1x10³ HB cells with the indicated transfection were seeded in triplicate into 96-well plates containing 200 μl culture medium in each well. At the indicated time points, the medium of each well was replaced with 100 μl fresh medium supplemented with 10 μl CCK8 reagent (Beyotime, Jiangsu, China), and the cells were incubated for another 2h. Finally, a multiplate reader (Bio Tek, Vermont, USA) was used to determine the absorbance at a wavelength of 450nm.
Cell apoptosis analysis
After treatment, approximately 5x10⁵ cells were collected and washed. Then, cells were stained with FITC-conjugated Annexin V (eBioscience, California, USA) for 10 min, followed by staining with Propidium Iodide (PI) (eBioscience, California, USA) for 5 min. Finally, the percentage of apoptotic cells was determined by a FACS flow cytometer (BD).
Xenograft tumor assay
Four-week-old male nude mice (n=7) were obtained from Shanghai Super-B&K Laboratory Animal Crop. (Shanghai, China) and maintained in the SPF animal house of Shanghai tenth People's Hospital of Tongji University. HUH6 lv-sh_NC or lv-sh_circHMGCS1 cells (5x10⁶) were subcutaneously injected into the left flank or right flank of each mouse. The tumor volume was measured every 4 days and calculated by the following formula: Volume (mm3) = Length (mm) × Width2 (mm2)/2. After 31 days, the mice were sacrificed, and the tumors were weighed. The experiments were conducted in accordance with the Guidelines for the Care and Use of Animals for Scientific Research.
Luciferase reporter assay
The full-length sequence of circHMGCS1 or the 3'-UTR of IGF2 containing the binding site of miR-503-5p, miR-490-5p and miR-615-5p was cloned downstream of the Renilla luciferase gene in the dual luciferase plasmid psiCHECK2 vector (Promega) to construct the psiCHECK2-circHMGCS1 vector or psiCHECK2-IGF2-3'UTR vector, respectively. 293T cells were seeded in 24-well plates 24 h prior to transfection. Afterwards, 0.8 μg of psiCHECK2- circHMGCS1 vector, psiCHECK2-IGF2-3'UTR vector or psiCHECK2 vector, with the addition of 20 pmol of miRNA mimics or negative control mimics, were cotransfected into cells using Lipofectamine 2000 (Invitrogen). After transfection for 48 h, firefly and Renilla signals were examined using a dual luciferase reporter assay kit (Promega E1910, Madison, Wisconsin, USA).
Western blotting assay
Wortmannin (S2758) was purchased from Selleck Chemicals (Houston, TX, USA).
Cells were lysed on ice in RIPA lysis buffer (Beyotime) supplemented with phosphatase and protease inhibitors, and then total protein was quantified and boiled in SDS. Afterwards, 60 μg of protein samples were separated on an SDS-PAGE gel and then electrophoretically transferred onto nitrocellulose membranes (GE Healthcare). Then, the membranes were blocked and subsequently incubated overnight with primary antibodies at 4°C. Then, the membranes were washed and incubated with fluorescently conjugated secondary antibodies (Licor, USA). Finally, the bands on the membranes were visualized using an Odyssey instrument (Licor). The information of primary antibodies are listed in Supplementary Table S2.
Confocal immunofluorescence assay
HepG2 cells infected with sh_circHMGCS1 or sh_NC were seeded into 24-well plates with coverslips. The next day, cells were fixed and permeabilization. After blocking with 2% BSA, cells were incubated with the antibody against IGF2 (Abcam, ab9574), followed by incubation with the secondary antibody (Cell Signaling Technology, Boston, Massachusetts, USA). Afterwards, cells were stained with 4,6-diamidino-2-phenylindole (DAPI) (Invitrogen). Finally, the slides were analyzed using a confocal fluorescence microscope (Zeiss, Germany).
Untargeted metabolomics study
Untargeted metabolomics profiling was conducted on the XploreMET platform (Metabo-Profle Biotechnology) according to previously published methods with minor modifications. Briefly, the supernatant extracted from the frozen cell specimens was slowly transferred into an autosampler vial (Agilent Technologies). The pooled remaining supernatant was used as a quality control specimen. All the specimens in autosampler vials were dehydrated in a CentriVap vacuum concentrator (Labconco) and then lyophilized in a FreeZone freeze dryer with a stooping tray dryer (Labconco). Specimen derivatization and injection were carried out using a Gerstel MPS2 dual-head robotic multipurpose autosampler. The dried specimen was derivatized with methoxyamine, followed by supplementation with MSTFA (FAMEs and 1% TMCS). Afterwards, the derivatized specimens were injected with the sample injection head. Each specimen was introduced for GC-TOFMS analysis on a time-of-flight mass spectrometry (GC-TOF/MS) system (Pegasus) with an Agilent 7890B gas chromatograph. The raw data from GC-TOF/MS were processed with XploreMET 3.0, and each data set was converted to comparable data for further statistical analysis. The ratio of two adjacent metabolites from a known metabolic relation network was calculated for the analysis of individual metabolic alterations. The Z-score heat map was applied for data visualization of the entire relationship.
Statistical analysis
GraphPad Prism 7.0 (Graphpad Software, La Jolla, CA, USA) and SPSS software ver.20.0 (SPSS, Inc., Chicago, IL, USA) were used for data analyses. Pearson's χ2 test was used to analyze the expression levels of circHMGCS1 and IGF2 in the HB tissues and their association with clinicopathological characteristics. Kaplan-Meier survival curves and log-rank test were employed to depict the overall survival (OS) distributions of HB patients with different levels of circHMGCS1 and IGF2. The receiver operating characteristic (ROC) curves was performed to evaluate its diagnostic value. Correlations between two variations was analyzed by Pearson's correlation. Quantitative data from three independent experiments were represented as the mean ± STD, except that the tumor volumes and weights of xenograft tumors were represented as the mean ± STD of seven mice. Paired-samples or independent-samples t test was used for the analysis of two group. One-way analysis of variance (ANOVA) for three or more groups with Dunnett's test (none treatment or si_NC or lv_sh_NC or lv-vector group as the control group) or Bonferroni's test. The statistical significance was indicated as *p<0.05, **p<0.01 or ***p<0.001.
Results
Profile of circRNAs in human normal and hepatoblastoma tissues
To analyze the expression pattern of circRNAs in HB, circRNA-seq analyses of rRNA-removed, RNase R-digested total RNA from 5 paired HB tissue and matched normal tissue samples using an Illumina HiSeq X Ten system were performed. CIRI software[21], was applied for circRNA identification and annotation. Counts of backsplice-spanning reads (circular reads) were normalized by the number of reads mapping and the read length (SRPBM). Hierarchical cluster analysis of all the expressed circRNAs revealed the circRNA expression profiles of HB and normal tissues. The cluster heat map indicated that many circRNAs were differentially expressed across normal and tumor tissues (Figure 1A, minimum level of mean ± 2 SD). Volcano and scatter plots showed the variation in circRNA expression between the HB and normal groups (Figure 1B and C). We identified a total of 3395 circRNAs that were differentially expressed (fold-change ≥2.0) between the two groups, and they were matched with circBase to distinguish known from novel circRNAs (Figure 1D). Among 3395 circRNAs, 2737 circRNAs were upregulated and 658 were downregulated in HB tissue compared with normal tissue. The majority of these circRNAs were derived from exons (Figure 1E). The chromosome distribution of these circRNAs is shown in Figure 1F. Afterwards, the parental genes of differentially expressed circRNAs were subjected to KEGG pathway analysis, and the top 30 entries are shown. As shown in Figure 1G, those parental genes participated in valine, leucine and isoleucine degradation, ubiquitin-mediated proteolysis, and various metabolic signaling pathways, such as selenocompound metabolism, propanoate metabolism, and D-glutamine and D-glutamate metabolism, indicating that the circRNAs derived from these genes might play a role in these metabolic signaling pathways and abnormal metabolism may be a salient characteristic of HB. The top 10 downregulated and upregulated circRNAs are shown in Figure S2. Among them, we selected one of the significantly differentially expressed circRNA, derived from exon 5 and exon 6 of HMGCS1 gene (hsa_circ_0072391, termed circHMGCS1) for further study.
CircHMGCS1 is significantly upregulated in HB
The 331-bp circHMGCS1 was formed by circularization of exon 5 and exon 6 of the HMGCS1 gene, which was located at chromosome 5p12 (Figure 2A), as reported in circBase (hsa_circ_0072391). To explore the cellular distribution of circHMGCS1, the expression levels of cytoplasmic control transcripts (18S and GAPDH), nuclear control transcript (U1) and circHMGCS1 were examined by qRT-PCR in the cytoplasmic and nuclear fractions of HepG2 cells. The data revealed that circHMGCS1 was predominantly expressed in the cytoplasm of HepG2 cells (Figure 2B). We also detected circHMGCS1 expression in human normal hepatocyte cell lines (L-O2 and HL-7702), human HB cell lines (HUH6 and HepG2) and human hepatocellular carcinoma cell lines (SMMC-7721 and Bel-7404). The results showed that circHMGCS1 expression in HB cells was remarkably higher than that in normal hepatocyte cells and HCC cells (Figure 2C). Subsequently, we verified the circHMGCS1 level in 37 pairs of HB tissues and matched normal tissues by qRT-PCR, and the results showed that its level was significantly elevated in HB tissues compared to normal tissues (Figure 2D), which was consistent with the circRNA-seq results. Based on the grading criteria (Figure 2E), the results from in situ hybridization showed that the percentage of HB tissues with the strongest staining intensity (+++) was markedly higher than that of matched normal tissues, implying that circHMGCS1 was highly overexpressed in HB tissues (Figure 2F). Representative figures are shown in Figure 2G. Taken together, these data suggested that circHMGCS1 was significantly upregulated in HB and might be involved in the malignant progression of HB.
Figure 1
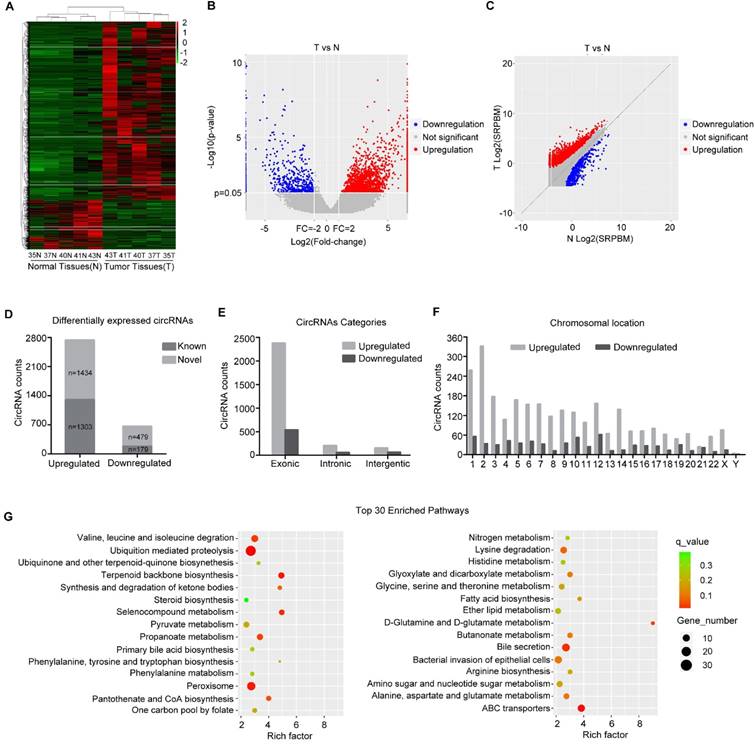
circRNA expression profile in HB. (A) Heat map depicts the differentially expressed circRNAs with a greater than 2-fold change (Z-score) in 5 paired human HB tissues and matched normal tissues. Red represents upregulated circRNAs, and green represents downregulated circRNAs. (B) The volcano plot was constructed with fold-change values and p-values. The horizontal line corresponds to a p-value of 0.05, and the vertical lines indicate upregulation and downregulation by 2-fold. The red and blue points on the volcano plot indicate the differentially expressed circRNAs with a greater than 2-fold change between the two compared groups. (C) The scatter plot was utilized to assess the variation in circRNA expression between HB and normal tissues. The x and y axes represent log2 SRPBM. The dotted line indicates the fold-change cutoff. The red and blue points indicate the significantly differentially expressed circRNAs. (D) The number of known or novel differentially expressed circRNAs. (E) Genomic origin of differentially expressed circRNAs. (F) The chromosomal distribution of differentially expressed circRNAs. (G) KEGG pathway analysis of the parental genes of differentially expressed circRNAs (Hypergeometric test). The top thirty categories are exhibited.
Figure 2
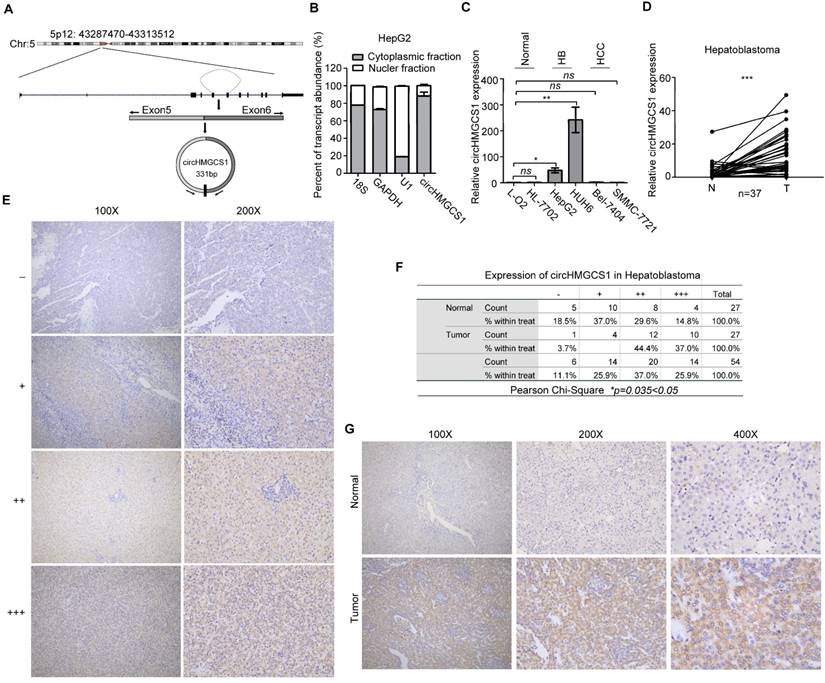
CircHMGCS1 is remarkably upregulated in HB cells and tissues. (A) The genomic loci of circHMGCS1 in the HMGCS1 gene, which is located at chromosome 5p12. (B) Expression levels of cytoplasmic control transcripts (18S and GAPDH), the nuclear control transcript (U1), and circHMGCS1 were determined by qRT-PCR in the cytoplasmic and nuclear fractions of HepG2 cells. (C) Relative expression of circHMGCS1 in human normal hepatocyte cell lines (L-O2 and HL-7702), human HB cell lines (HepG2 and HUH6) and human hepatocellular carcinoma cell lines (Bel-7404 and SMMC-7721) as measured by qRT-PCR (one-way analysis of variance, Dunnett's test). (D) Relative expression of circHMGCS1 from HB and normal tissue pairs were measured by qRT-PCR (n = 37). N, normal tissues and T, tumor tissues (paired-samples t test). (E) Grading criteria based on the percentage of cells with different staining intensities at two magnifications (100× and 200×) used to define the circHMGCS1 expression level in tissue sections determined by ISH. (F) The Pearson's χ2 test of circHMGCS1 in 27 HB and paired normal tissue pairs. (G) Representative pictures of circHMGCS1 staining in tissue sections at three magnifications (100×, 200× and 400×). *p < 0.05, **p < 0.01, and ***p < 0.001.
CircHMGCS1 is a potential diagnostic and prognostic biomarker for HB patients
The clinicopathological characteristics of the HB patient samples are shown in Table 1. Next, the correlation between circHMGCS1 expression and the clinicopathological characteristics of HB patients was analyzed. Tissue samples detected by qRT-PCR method were divided into high circHMGCS1 group and low circHMGCS1 expression group by the median ΔΔCT v alue. For tissue samples detected by ISH, samples with low staining intensity (-, +) were classified as low circHMGCS1 expression group. As shown in Table 2, a significant correlation was identified between circHMGCS1 expression and AFP at diagnosis (P=0.025), while no correlation was observed between circHMGCS1 expression and other clinicopathological factors. The receiver operating characteristics (ROC) curve was applied to investigate the diagnostic value of circHMGCS1 in distinguishing 37 HB tissues from 37 normal tissues, using the median ΔΔCT value of the circHMGCS1 as the cut-off. As illustrated in Figure 3A, circHMGCS1 was confirmed to have diagnostic value. Moreover, the increased circHMGCS1 level in HB tissues was significantly correlated with a poor prognosis in HB patients, as shown by the Kaplan-Meier survival curve (Figure 3B). Taken together, these data suggest that circHMGCS1 might be a promising biomarker for the diagnostic and prognostic of HB patients.
Figure 3
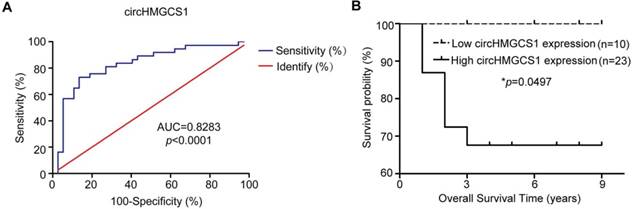
CircHMGCS1 is a potential diagnostic and prognostic biomarker for HB patients. (A) The ROC curve for using circHMGCS1 as a diagnostic biomarker. (B) Kaplan-Meier's analyses of correlations between circHMGCS1 expression levels and the OS of HB patients are shown (log-rank test). *p < 0.05, **p < 0.01, and ***p < 0.001.
Table 1
Clinicopathological characteristics of HB patient samples.
| Variable | n |
|---|---|
| Age at Diagnosis (mouth) | |
| ≥24/<24 | 37/27 |
| Sex | |
| Female/male | 24/40 |
| AFP at Diagnosis (ng/ml) | |
| ≥1200/<1200 | 48/16 |
| AFP at Final Detection (ng/ml) | |
| ≥5/<5/NA | 22/35/7 |
| Histology | |
| MIX/E/NA | 26/16/22 |
| PRETEXT | |
| I-II/III-IV/NA | 18/31/15 |
| Tumor Size (cm3) | |
| ≥500/<500/NA | 39/22/3 |
| Metastasis | |
| YES/NO/NA | 7/54/2 |
| Event | |
| Death/Alive/NA | 7/26/31 |
“NA” means unknown. “NA” means unknown. “M” means male. “F” means female. “MIX” means mixed epithelial and mesenchymal. “E” means epithelial.
Table 2
Statistical analysis of correlations between clinicopathological characteristics and circHMGCS1 expression in HB tissues (Pearson χ2 test).
| HB (n=64) | circHMGCS1 expression | χ2 test value | p-value | |
|---|---|---|---|---|
| Low | High | |||
| Age at Diagnosis | ||||
| ≥24 mouth | 12 | 25 | 0.875 | 0.37 |
| <24 mouth | 6 | 21 | ||
| Sex | ||||
| Female | 6 | 18 | 0.186 | 0.667 |
| Male | 12 | 28 | ||
| AFP at Diagnosis | ||||
| ≥1200 ng/ml | 10 | 38 | 5.05 | 0.025 |
| <1200 ng/ml | 8 | 8 | ||
| AFP at Final Detection | ||||
| ≥5 ng/ml | 4 | 18 | 2.976 | 0.084 |
| <5 ng/ml | 14 | 21 | ||
| NA | 0 | 7 | ||
| Histology | ||||
| MIX | 10 | 16 | 1.801 | 0.180 |
| E | 3 | 13 | ||
| NA | 5 | 17 | ||
| PRETEXT | ||||
| I-II | 4 | 14 | 0.943 | 0.332 |
| III-IV | 11 | 20 | ||
| NA | 3 | 12 | ||
| Tumor Size | ||||
| ≥500 cm3 | 11 | 28 | 0.088 | 0.766 |
| <500 cm3 | 7 | 15 | ||
| NA | 0 | 3 | ||
| Metastasis | ||||
| YES | 3 | 4 | 0.884 | 0.347 |
| NO | 14 | 40 | ||
| NA | 0 | 2 | ||
“NA” means unknown. “M” means male. “F” means female. “MIX” means mixed epithelial and mesenchymal. “E” means epithelial.
CircHMGCS1 affects the proliferation and apoptosis abilities of HB cells
To investigate the biological role of circHMGCS1 in HB, two specific siRNAs targeting the backsplice junction sequence of circHMGCS1 were transfected into HepG2 and HUH6 cells to silence circHMGCS1 expression, and the transfection efficiency was verified by qRT-PCR. As expected, siRNA targeting the backsplice sequence only affected the expression level of circHMGCS1 but not the expression level of HMGCS1 linear species (Figure 4A and Figure S3A). Results from CCK8 and colony formation assays (Figure 4B-E) demonstrated that circHMGCS1 silencing remarkably inhibited cell proliferation in HepG2 and HUH6 cells. The flow cytometry results indicated that circHMGCS1 knockdown also induced apoptosis in HUH6 cells (Figure 4F and G). Furthermore, we stably overexpressed more than 50-fold circHMGCS1 in HepG2 and HUH6 cells (Figure 4H). Then, CCK8 and colony formation assays were performed to examine the effect of circHMGCS1 overexpression on HepG2 and HUH6 cells. As shown in Figure 4I-4L, upregulation of circHMGCS1 significantly enhanced HB cells proliferation. The above results demonstrated that circHMGCS1 exert oncogenic role in HB cells in vitro.
CircHMGCS1 promotes HB tumor growth in vivo
To further examine the role of circHMGCS1 in HB tumorigenesis, a xenograft tumor assay was carried out in HUH6 cells infected with lentivirus expressing shRNA against circHMGCS1 (lv-sh_circHMGCS1) or its negative control (lv-sh_NC). Data from qRT-PCR analysis confirmed that circHMGCS1 expression was significantly downregulated in HUH6 cells infected with lv-shcircHMGCS1 compared to that in negative control cells (Figure 5A).
Figure 4
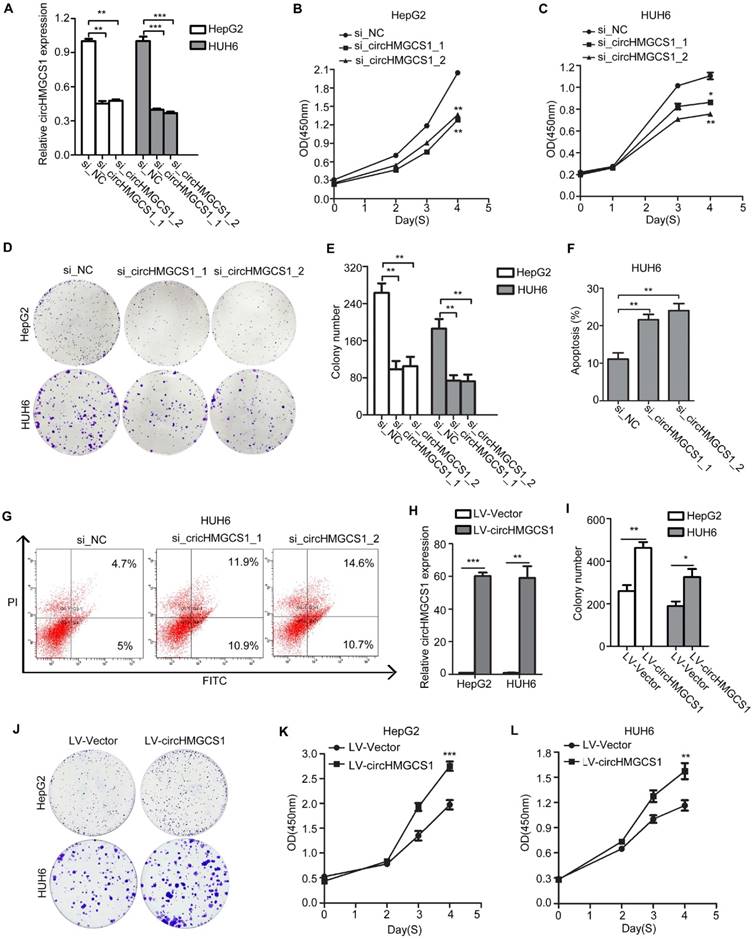
CircHMGCS1 affects the proliferation and apoptosis abilities of HB cells. (A) CircHMGCS1 silencing efficiency using siRNAs in HepG2 and HUH6 cells was verified by qRT-PCR (one-way analysis of variance, Dunnett's test). (B-E) HepG2 and HUH6 cells transfected with si_circHMGCS1-1 or si_circHMGCS1-2 were subjected to CCK8 assays (one-way analysis of variance, Dunnett's test) (B and C) and colony formation assays (D and E) to evaluate the role of circHMGCS1 in cell proliferation and viability. (F-G) Apoptosis analysis of HUH6 cells transfected with si_NC, si_circHMGCS1-1 or si_circHMGCS1-2 using flow cytometry assays (one-way analysis of variance, Dunnett's test). (H) The expression of circHMGCS1 was detected by qRT-PCR in HepG2 and HUH6 cells infected with lentivirus expressing circHMGCS1 and mock vector (independent-samples t test). (I-J) The proliferation ability of HepG2 and HUH6 cells were measured by colony formation assays (independent-samples t test). (K-L) The growth curves of cells were measured by CCK8 assays (independent-samples t test). *p < 0.05, **p < 0.01, and ***p < 0.001.
Figure 5
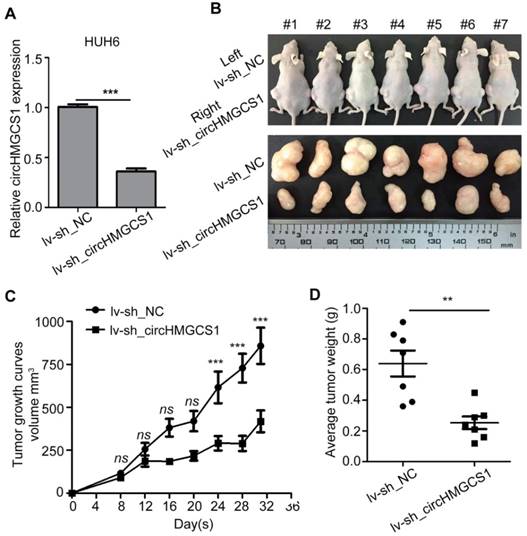
CircHMGCS1 promotes HB tumor growth in vivo. (A) CircHMGCS1 knockdown efficiency using shRNAs in HUH6 cells was verified by qRT-PCR (independent-samples t test). (B) Tumors dissected from nude mice inoculated with HUH6/lv-sh_NC (left flank) and HUH6/lv-sh_circHMGCS1 cells (right flank) (n = 7). (C) Tumor volumes (mm3) on the indicated days were graphed to reveal tumor growth curves (two-way ANOVA followed by Bonferroni's test). (D) Average tumor weight of nude mice inoculated with HUH6/lv-sh_NC and HUH6/lv-sh_circHMGCS1 cells (independent-samples t test). *p < 0.05, **p < 0.01, and ***p < 0.001.
Then, HUH6 cells were injected subcutaneously into seven nude mice (left flank for negative control cells, right flank for lv-shcircHMGCS1 cells). The results demonstrated that knockdown of circHMGCS1 markedly decreased the tumor volume and tumor weight compared with the negative controls (Figure 5B-5D), suggesting that circHMGCS1 could promote HB cell growth in vivo. Consequently, the in vivo results further support the oncogenic role of circHMGCS1 in HB tumorigenesis and development.
CircHMGCS1 is involved in glutamine metabolism
From Figure 1G, we speculated that abnormal metabolism may be a salient characteristic of HB, and circHMGCS1 may play a role in the regulation of metabolism. Thus, an untargeted metabolomics study was performed in HUH6 cells infected with sh_circHMGCS1 or sh_NC using time-of-flight mass spectrometry with gas chromatography, and metabolites were annotated with the mammalian metabolite database JiaLibTM. Each treatment was prepared for 3 separate samples. Metabolites with a significant linear correlation tended to be grouped together (Figure 6A), implying that these metabolites might play a similar biological role or belong to the same metabolite class. The Z-score plot provides an overview of global metabolic profiles among groups, depicting the relative variations in each individual metabolite across all the sh_NC and sh_circHMGCS1 groups (Figure 6B). Within the Z-score plot, red indicates relatively higher concentrations, whereas green indicates relatively lower concentrations. The results of metabolic pathway enrichment analysis (MPEA) are shown in Figure 6C. Among them, the D-glutamate and D-glutamate metabolism pathways were significantly different between the sh_NC and sh_circHMGCS1 groups, thus piquing our interest. The level of L-glutamine was significantly increased in the sh_circHMGCS1 groups compared with the negative control groups (Figure 6D). Consistent with the results from the metabolomics study, knockout of circHMGCS1 in HepG2 and HUH6 cells dramatically reduced the mRNA and protein level of glutaminase (GLS), an enzyme that converts glutamine to glutamate [26], compared with control cells (Figure 6E and F). To further investigate the association between this metabolic pathway and HB, the mRNA expression level of GLS in 37 paired HB tissues and matched normal tissues were detected by qRT-PCR. Results demonstrated that GLS mRNA levels were markedly upregulated in HB tissues compared with normal tissues (Figure 6G), which indicated that HB may belong to the type of tumor that relies on glutaminolysis. Moreover, there was a significantly correlation between circHMGCS1 and GLS expression levels (Figure 6H). To confirm this result, we detect the protein level of GLS in 8 paired HB and matched normal tissues. Consistently, the protein levels of GLS were upregulated in most of the HB tissues and positively correlated with circHMGCS1 expression levels in the 8 paired HB and matched normal tissues (Figure 6I and J). Taken together, these results indicated that circHMGCS1 affects glutaminolysis in HB through regulating GLS expression.
Figure 6
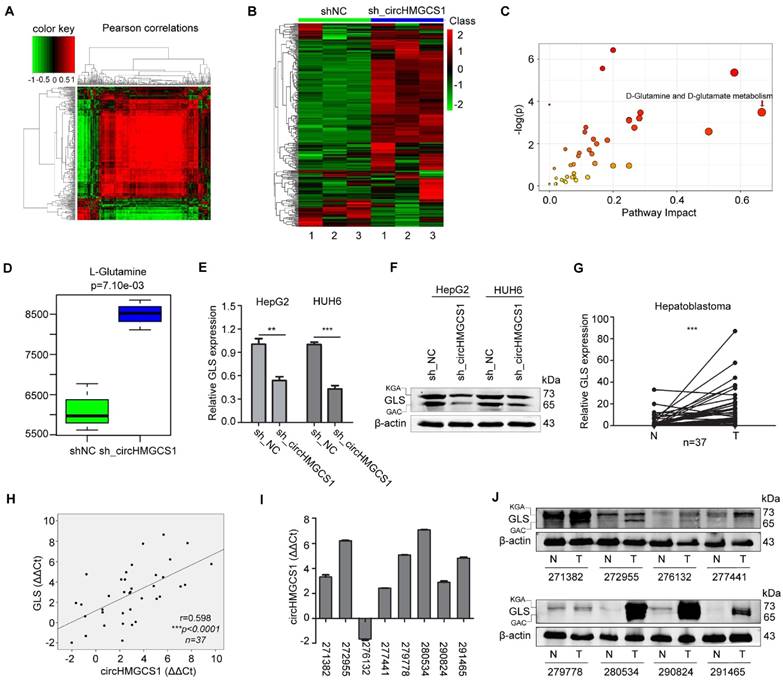
CircHMGCS1 is involved in glutamine metabolism. (A) The metabolites interrelation was evaluated by Pearson's correlation. The Pearson's correlation coefficients (r) was calculated in all the samples using a pair-wise fashion. (B) The z-sore plot supplying an overview of global metabolic profiles among all the sh_NC and sh_circHMGCS1 groups. Red indicates a relatively high concentration, whereas green indicates a relatively low concentration. (C) Metabolic pathway enrichment analysis (MPEA) results (Hypergeometric test). (D) Level of L-Glutamine in sh_circHMGCS1 groups and sh_NC groups (independent-samples t test). (E) Relative mRNA expression of GLS in HepG2 and HUH6 cells infected with sh_circHMGCS1 or sh_NC was measured by qRT-PCR (independent- samples t test). (F) The protein expression of GLS in HepG2 and HUH6 cells infected with sh_NC and sh_circHMGCS1 was measured by western blotting assay. (G) Relative expression of GLS from 37 HB and normal tissue pairs was measured by qRT-PCR (paired-samples t test). N, normal tissues and T, tumor tissues. (H) Pearson's correlation analysis showing the correlation of circHMGCS1 and GLS expression in HB and normal tissue pairs (n = 37). The ΔΔCt method was applied for Pearson's correlation analysis. (I-J) The transcriptional level of circHMGCS1 (I) and the protein expression level (J) of GLS in 8 paired HB and normal tissues. GAC and KGA are the two isoforms of GLS. *p < 0.05, **p < 0.01, and ***p < 0.001.
CircHMGCS1 serves as a sponge for several miRNAs
Given that circRNAs have been reported to function as miRNA sponges and that circHMGCS1 was abundant in the cytoplasm, we speculated that circHMGCS1 may regulate HB cell proliferation and glutaminolysis by sponging miRNAs. A powerful web tool, CircInteractome [27], was employed to predict potential miRNA binding partners of circHMGCS1. A total of 14 miRNAs were found to contain putative binding sites in the circHMGCS1 sequence (Figure 7A). To validate whether these miRNAs could directly target circHMGCS1, we performed dual luciferase assays. Luciferase reporters were cotransfected with each miRNA mimic into 293T cells. The results indicated that 4 miRNAs (miR-153-3p, miR-490-5p, miR-615-3p and miR-503-5p) significantly inhibited the luciferase reporter activity compared with the miRNA mimic negative control (miR-NC), suggesting that circHMGCS1 could bind to these miRNAs (Figure 7B). Then, a bioinformatic tool, namely, TargetScan, was used to predict the putative targets of miRNAs, and Draw Venn Diagram was used to intersect the target genes of 4 miRNAs. The Venn diagram is presented in Figure 7C. Among these, we observed that IGF2 might be a common potential target gene of miR-490-5p, miR-503-5p and miR-615-3p. The binding sites between these miRNAs and circHMGCS1, together with the binding sites between these miRNAs and IGF2, are shown in Figure 7D. To identify whether these miRNAs could directly modulate IGF2, dual luciferase assays were conducted.
Figure 7
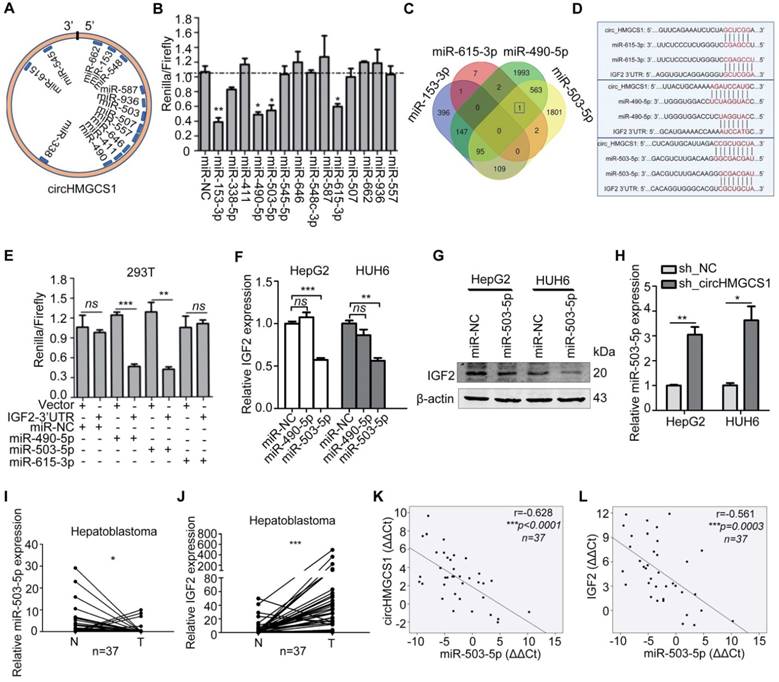
CircHMGCS1 serves as a sponge for several miRNAs. (A) Schematic drawing showing the miRNAs that might bind circHMGCS1. (B) Dual-luciferase assays showing the luciferase activity of the psiCHECK2-circHMGCS1 vector in 293T cells cotransfected with several miRNA mimics. Transfection of four miRNA mimics markedly decreased the Renilla/firefly ratio in cells containing the psiCHECK2-circHMGCS1 vector compared with transfection of the miRNA mimic negative control (miR-NC) (one-way analysis of variance, Dunnett's test). (C) Venn diagram showing the mutual putative target genes of these four miRNAs. IGF2 is the mutual putative target gene of miR-490-5p, miR-503-5p and miR-615-3p. (D) The putative binding sites of miRNA (miR-490-5p/miR-503-5p/miR-615-3p) on circHMGCS1 and IGF2. (E) Dual-luciferase assays confirmed the interaction of IGF2 with miR-490-5p or miR-503-5p (independent-samples t test). (F) Relative mRNA level of IGF2 in HepG2 and HUH6 cells transfected with miR-NC, miR-490-5p or miR-503-5p were measured by qRT-PCR (one-way ANOVA followed by Dunnett's test). (G) HepG2 and HUH6 cells transfected with miR-NC or miR-503-5p were lysed to determine the levels of indicated proteins by western blotting. (H) The mRNA level of miR-503-5p in HepG2 and HUH6 cells infected with sh_circHMGCS1 or negative control (sh_NC) were measured by qRT-PCR (independent-samples t test). (I and J) Relative expression of miR-503-5p (I) and IGF2 (J) in HB and normal tissue pairs were measured by qRT-PCR (n = 37) (paired sample t test). N, normal tissues and T, tumor tissues. (K and L) Pearson's correlation analyses showing the correlation of circHMGCS1 and miR-503-5p expression (K) and the correlation of IGF2 and miR-503-5p expression (L) in HB and normal tissue pairs (n = 37). The ΔΔCt method was applied for Pearson's correlation analysis. *p < 0.05, **p < 0.01, and ***p < 0.001.
The 3'-UTR regions of IGF2 containing binding sites were cloned downstream of the Renilla luciferase reporter gene in the psiCHECK-2 vector with constitutive expression of the firefly luciferase gene as an internal standard. Cotransfection with miR-490-5p or miR-503-5p mimics resulted in a remarkable decrease in the Renilla/firefly ratio in the IGF2-3'-UTR vector but not in the control vector, suggesting that both miR-490-5p and miR-503-5p could directly bind to IGF2 (Figure 7E). To further analyze the role of miR-490-5p/miR-503-5p in IGF2 regulation, HepG2 and HUH6 cells were transfected with miR-NC or miRNA mimics. Data from qRT-PCR illustrated that IGF2 mRNA level was significantly reduced in cells transfected with miR-503-5p mimic compared with control cells (Figure 7F), which was concordant with the results from the western blot assay (Figure 7G). What' more, data from qRT-PCR suggested that the expression of miR-503-5p was significantly upregulated in HB cells with circHMGCS1 knockdown (Figure 7H). Then, we determined the expression of miR-503-5p and IGF2 by qRT-PCR in 37 pairs of HB and matched normal tissues. We found that miR-503-5p expression was downregulated in HB tissues compared with normal tissues (Figure 7I), and the expression of IGF2 was significantly upregulated in HB tissues (Figure 7J). The Pearson's correlation of circHMGCS1 and miR-503-5p expression levels was negative (Figure 7K), similar to that of miR-503-5p and IGF2 expression levels (Figure 7L). Hence, the above results suggest that circHMGCS1 serves as a sponge for several miRNAs, such as miR-153-3p, miR-490-5p, miR-503-5p and miR-615-3p, and that miR-503-5p directly targets IGF2 and negatively modulates the expression of in HB.
CircHMGCS1 expression is positively correlated with IGF2 expression
The above data demonstrated that the 3′UTR of IGF2 shared the binding sites of miR-503-5p matched in circHMGCS1, suggesting that circHMGCS1 might regulate IGF2 expression by competitively binding to this miRNA. To investigate the regulatory role of circHMGCS1 in IGF2 expression, qRT-PCR and western blotting assays were performed in HepG2 and HUH6 cells infected with sh_circHMGCS1 or negative control (sh_NC). The results demonstrated that the mRNA and protein levels of IGF2 were significantly reduced in cells infected with sh_circHMGCS1 (Figure 8A and B), which was further confirmed by confocal immunofluorescence assay (Figure 8C), indicating that circHMGCS1 promoted IGF2 expression in HB cells. The correlation of circHMGCS1 and IGF2 mRNA levels was positive (Figure 8D). Moreover, we detected the protein level of IGF2 in the same group of 8 paired HB and matched normal tissues. As shown in Figure 8E and 8F, the protein levels of IGF2 were positively correlated with circHMGCS1expression levels. Afterwards, an immunohistochemistry assay was used to detect IGF2 expression in matched HB tissues and normal tissues. As shown in Figure 8G, the comparison between the pattern of circHMGCS1 and IGF2 expression by serial sections indicated that circHMGCS1 and IGF2 colocalize in HB cells. Together, these results suggest that circHMGCS1 protects IGF2 from attack by miR-503-5p and that its expression is positively associated with IGF2 in HB tissues and cells.
IGF2 is a potential diagnostic and prognostic biomarker for HB patients
To further evaluate IGF2 expression levels in HB, an immunohistochemistry assay was performed in matched HB tissues and normal tissues (n=27). Based on the grading criteria (Figure 9A) and the Pearson's χ2 tests (Figure 9B), the immunohistochemistry results revealed that IGF2 was highly overexpressed in HB tissues. Representative figures are shown in Figure 9C. Next, the correlation between the clinicopathological factors of HB patients and IGF2 expression was analyzed. Tissue samples detected by qRT-PCR method were divided into high circHMGCS1 group and low circHMGCS1 expression group by the median ΔΔCT value. For tissue samples detected by ISH, samples with low staining intensity (-, +) were classified as low circHMGCS1 expression group. As shown in Table 3, a significant correlation was found between IGF2 expression and histology (P=0.007) in HB tissues, while no correlation was observed between IGF2 expression and other clinicopathological factors. To explore the diagnostic value of IGF2 in distinguishing HB tissues from normal tissues, we performed a ROC curve analysis. As shown in Figure 9D, IGF2 was confirmed to have diagnostic value (AUC=0.8971; P<0.0001). Moreover, elevated IGF2 expression in HB tissues was significantly correlated with a poor prognosis in HB patients, as shown by the Kaplan-Meier survival curve (Figure 9E). Taken together, these results suggest that IGF2 is highly overexpressed in HB tissues and can serve as a promising biomarker for the diagnostic and prognostic of HB patients.
CircHMGCS1 affects the proliferation and apoptosis of HB cells via miR-503-5p
To further examine whether circHMGCS1 affects the proliferation and apoptosis of HB cells via miR-503-5p, we transfected HepG2/LV-Vector and HepG2/LV-circHMGCS1 cells with miR-NC or miR-503-5p, and transfected HUH6/ LV-sh_NC and HUH6/LV-sh_circHMGCS1 cells with miR-503-5p inhibitor or miR-NC inhibitor. Then, CCK8, colony formation and FACS assays were performed. As shown in Figure 10A-I, the transfection of miR-503-5p rescued the promoting effect of circHMGCS1 on HepG2 cells proliferation and the inhibiting effect of circHMGCS1 on HepG2 cells apoptosis. Moreover, the inhibitory effect of circHMGCS1 knockdown on HUH6 cells proliferation and promoting effect on HUH6 cell apoptosis were rescued by the transfection of miR-503-5p inhibitor. Those results implied that circHMGCS1 exerts its oncogenic role in HB cells, at least partly by sponging the tumor suppressor miR-503-5p. Thus, we detect the effect of the circHMGCS1/miR-503-5p axis on IGF2 and other experimentally validated target genes of miR-503-5p (Table S3) [28-31] by western blot assays. As shown in Figure 10J and K, circHMGCS1 knockdown downregulated IGF1R, BCL2 and VEGFA levels, while circHMGS1 overexpression upregulated IGF1R, BCL2 and VEGFA levels (Figure 10J and K). PI3K-Akt signaling are the principal downstream of IGF2/IGF1R [32], and miR-503-5p were reported to involve in regulating PI3K-Akt signaling pathway [33,34]. Thus, it's needed to detect the activation of Akt to confirm the effect of circHMGCS1/miR-503-5p regulatory axis on IGF2/IGF1R expression. As shown in Figure 10J and K, circHMGCS1 knockdown significantly inhibited the activation of Akt. While the overexpression of circHMGCS1 activated Akt. What's more, the activation of Akt by circHMGCS1 overexpression was inhibited by Wortmannin, which implying that the activation of Akt by circHMGCS1 is depended on PI3K (Figure 10L). Activation of the PI3K-Akt pathway was reported to regulate the utilization of glutamine via stimulating glutamine uptake, regulating the enzyme GLS and glutamine synthetase (GLUL) [35]. Consistently, we found that GLS expression was also regulated by circHMGCS1/miR-503-5p axis (Figure 10J and K). Taken together, these results indicate that circHMGCS1/miR-503-5p axis affects HB cell proliferation by regulating the IGF2/IGF1R-PI3K-Akt signaling and glutaminolysis (Figure 11).
Discussion
During the past decade, noncoding RNAs have gained considerable attention for their roles in carcinogenesis and cancer progression [36-38]. Studies have revealed that some lncRNAs and microRNAs may serve as diagnostic markers or regulators in HB [39, 40]. However, the expression prolife and regulatory function of circRNA in HB remain unclear; thus, we identified differentially expressed circRNAs between five paired HB and coordinated nontumor liver tissues through circRNA sequencing. The results showed that circRNA expression levels were significantly altered in HB tissues compared to matched nontumor liver tissues, which suggests a potential role in the process of carcinogenesis of HB.
Table 3
Statistical analysis of correlations between clinicopathological characteristics and IGF2 expression in HB tissues (Pearson χ2 test).
| HB (n=64) | IGF2 expression | χ2 test value | p-value | |
|---|---|---|---|---|
| Low | High | |||
| Age at Diagnosis | ||||
| ≥24 mouth | 11 | 26 | 2.259 | 0.133 |
| <24 mouth | 13 | 14 | ||
| Sex | ||||
| Female | 11 | 13 | 1.138 | 0.286 |
| Male | 13 | 27 | ||
| AFP at Diagnosis | ||||
| ≥1200 ng/ml | 18 | 30 | 0.000 | 1.000 |
| <1200 ng/ml | 6 | 10 | ||
| AFP at Final Detection | ||||
| ≥5 ng/ml | 8 | 14 | 0.075 | 0.784 |
| <5 ng/ml | 14 | 21 | ||
| NA | 2 | 5 | ||
| Histology | ||||
| MIX | 12 | 14 | 7.380 | 0.007 |
| E | 1 | 15 | ||
| NA | 11 | 11 | ||
| PRETEXT | ||||
| I-II | 6 | 12 | 0.355 | 0.511 |
| III-IV | 13 | 18 | ||
| NA | 5 | 10 | ||
| Tumor Size | ||||
| ≥500 cm3 | 15 | 24 | 0.026 | 0.871 |
| <500 cm3 | 8 | 14 | ||
| NA | 1 | 2 | ||
| Metastasis | ||||
| YES | 2 | 5 | 0.193 | 0.661 |
| NO | 20 | 34 | ||
| NA | 1 | 1 | ||
“NA” means unknown. “M” means male. “F” means female. “MIX” means mixed epithelial and mesenchymal. “E” means epithelial.
In this study, we focused on hsa_circ_0072391, which was significantly upregulated in HB tissues for further investigation. Hsa_circ_0072391 derives from the HMGCS1 gene (termed circHMGCS1). HMGCS1 is a critical enzyme in mevalonate pathway, a classic metabolic pathway, which generates several essential end-produces, such as sterols, isoprenoids and ubiquinone [41]. Despite a number of researches in the context of cardiovascular disease, the contribution of MVA pathway to human cancers have received considerable attention in recent years [42]. And dysregulation of MVA pathways enzymes are observed in several tumors [43]. While, the HMGCS1 gene and its function in HB have never been reported. In this study, we found that HMGCS1 is significantly upregulated in HB tissues compared to matched normal tissues, and knockdown of HMGCS1 in HB cells resulted in a reduction of HB cell proliferation (Figure S3). While, the expression levels of circHMGCS1 and HMGCS1 mRNA were poorly correlated (Figure S3D), which implying that they are post-transcriptionally regulated. It's very interesting that HMGCS1 gene locus can produce different kinds of RNA through aberrant alternative splicing to generating regulatory and functional complexity in HB cells.
Figure 8
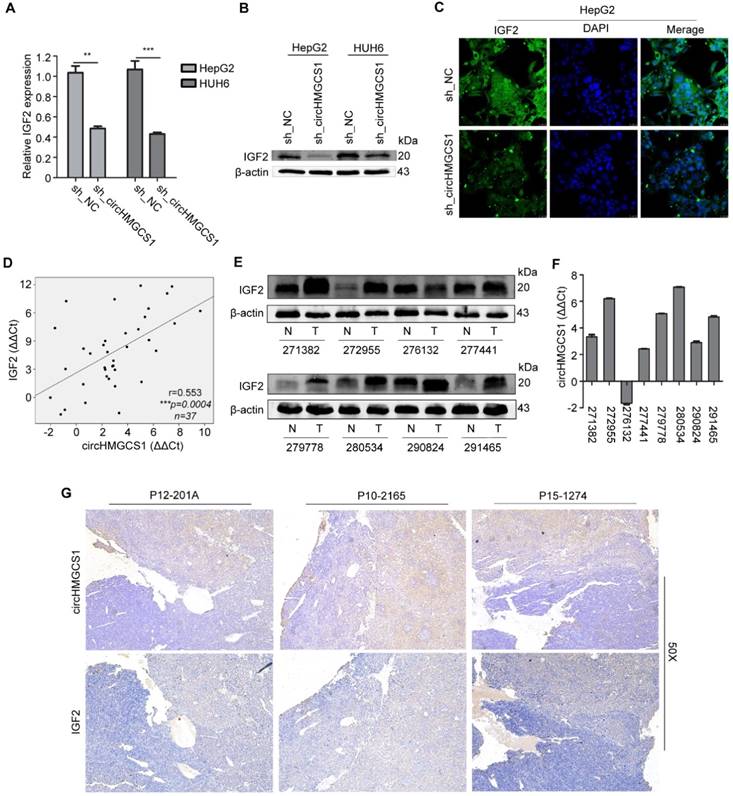
CircHMGCS1 expression is positively correlated with IGF2 expression. (A and B) The mRNA level (A) and protein level (B) of IGF2 in HepG2 and HUH6 cells infected with sh_circHMGCS1 or negative control (sh_NC) were measured by qRT-PCR and western blotting, respectively (independent-samples t test). (C) HepG2 cells infected with sh_circHMGCS1 or sh_NC were subjected to IF assays to detect IGF2 expression. Representative images are shown. (D) Pearson's correlation analysis showing the correlation of circHMGCS1 and IGF2 expression in HB and normal tissue pairs (n = 37). The ΔΔCt method was applied for Pearson's correlation analysis. (E and F) The transcriptional level of circHMGCS1 (F) and the protein expression level of IGF2 (E) in 8 paired HB and normal tissues. (G) ISH and IHC were used to detect the expression pattern of circHMGCS1 and IGF2 in HB tissues by serial sections (n = 27). The representative images at 50X magnification are shown. *p < 0.05, **p < 0.01, and ***p < 0.001.
The expression of circHMGCS1 was dramatically higher in HB tissues and HB cell lines than in nontumor tissues and normal liver cell lines. Compared to normal liver cell lines, circHMGSC1 expression in HCC cell lines was not elevated. This result suggest that circHMGCS1 has the potential to serve as a diagnostic marker to distinguish HB from HCC. What's more, circHMGCS1 expression was positively correlated with serum AFP level at diagnosis in HB patients. The serum AFP level is reported to be increased in almost 90% of HB patients and is used as an important diagnostic mean [5]. Thus, it is of interest to further verify whether serum circHMGCS1 levels are also positively correlated with serum AFP levels and whether circHMGCS1 alone or in combination with AFP has considerable potential in the early diagnosis of HB patients. The Kaplan-Meier survival curve analyses suggested that the increased expression of circHMGCS1 was correlated with a poor prognosis in HB patients. While, no correlation was observed between the AFP level and prognosis of HB patients when taken 100ng/ml as cut-off (Figure S4 and Table S1). These results are consistent with International Childhood Liver Tumor Strategy Group (SIOPEL) trials, which revealed that patients with a very low serum AFP level less than 100 ng/ml at diagnosis should be categorized as high-risk hepatoblastoma (HR) [6]. Thus, it is vital to choose an appropriate cut-off of AFP levels when predicting prognosis, and circHMGCS1 may be not inferior to AFP in predicting the prognosis of HB patients.
KEGG analysis was used to define the pathway related to the functions of differentially expressed circRNA host genes. Among the top 30 pathways, 18 pathways belong to the metabolic pathway (Figure 1G), which indicated that abnormal metabolism may be a salient characteristic of HB. Increased glutaminolysis has been considered a vital hallmark of many malignancies [44], and GLS was reported to be highly expressed in cells with increased rates of proliferation [45]. Additionally, GLS is a valid antitumor target. Some inhibitors of GLS, such as C8-839, have been evaluated in the phase II clinical trial for the treatment of a range of malignancies [46, 47]. However, few studies have focused on the level of glutaminolysis in HB. In this study, we found that GLS mRNA levels were significantly upregulated in HB tissues compared with normal tissues, which indicated that HB may belong to the type of tumor that relies on glutaminolysis. Furthermore, circHMGCS1 regulates the expression of GLS (Figure 6), which demonstrated that circHMGCS1 may regulate HB cell proliferation by regulating glutaminolysis.
Figure 9
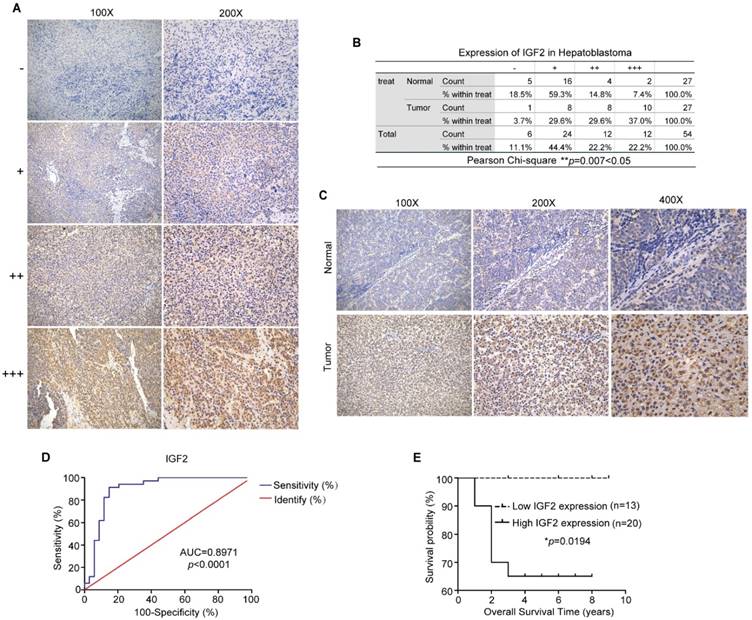
IGF2 is highly overexpressed in HB tissues and may be a promising biomarker for the diagnosis and prognosis of HB patients. (A) Grading criteria based on the percentage of cells with different staining intensities at two magnifications (100× and 200×) for defining the IGF2 expression level in tissue sections following IHC. (B) The Pearson's χ2 test of IGF2 in 27 HB and normal tissue pairs. **p = 0.007. (C) Representative pictures of IGF2 staining in tissue sections at three magnifications (100×, 200× and 400×). (D) ROC curve for the use of IGF2 as a diagnostic biomarker (p < 0.0001). (E) Kaplan-Meier analyses of correlations between IGF2 expression levels and OS among 33 HB patients are shown (*p = 0.0194). *p < 0.05, **p < 0.01, and ***p < 0.001.
Figure 10
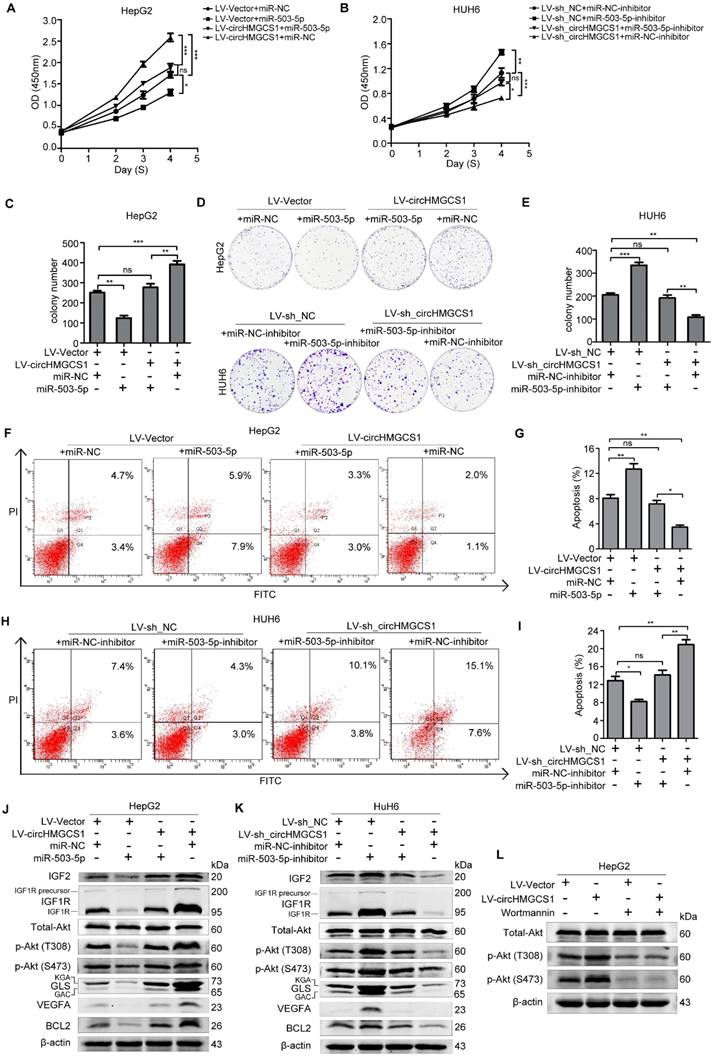
CircHMGCS1 affects the IGF signaling pathway via miR-503-5p. (A-B) The proliferation activity of treated HepG2 and HUH6 cell were measured by CCK8 assays (one-way ANOVA, followed by Bonferroni's test) . (C-E) The proliferation activity of treated HepG2 and HUH6 cells were detected by colony formation assays (one-way ANOVA, followed by Bonferroni's test). (F-I) Apoptosis in treated HepG2 and HUH6 cells were measured by FACS assays (one-way ANOVA, followed by Bonferroni's test). (J-K) Western blot assays were performed to measure the indicated protein level in treated HepG2 and HUH6 cells. (L) HepG2/LV-shNC and HepG2/LV-circHMGCS1 cells, treated with 200nM wortmannin for 4h, were lysed for western blot assay to detect the Akt and p-Akt protein levels. The data in A-I indicate mean ± SD and were analyzed by one-way analysis of variance, Bonferroni's test.
Figure 11
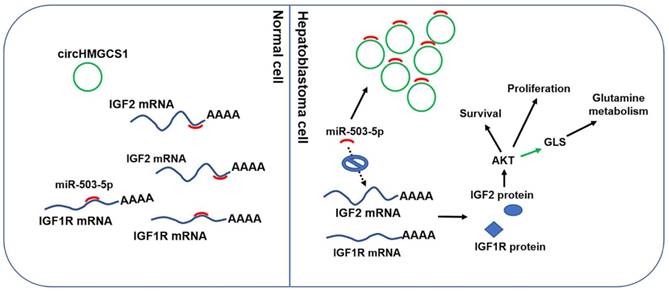
Molecular mechanism of circHMGCS1: regulating miR-503-5p to control IGF signaling by functioning as a ceRNA. Black arrow indicates the relationship demonstrated in our study. Green arrow indicates the relationship reported by other researches.
CircRNAs have been suggested to participate in several physiological or physiological processes by modulating alternative splicing [12], acting as a sponge for microRNAs [13], and regulating protein-RNA interactions [14] and parental genes at the transcription level [15]. In this study, we demonstrated that circHMGCS1 exerted its oncogene roles in HB cells via sponging miR-503-5p, a well-recognized tumor suppressor microRNA (Table S3), to regulate IGF2 and IGF1R expression. PI3K-Akt signaling are the principal downstream of IGF2/IGF1R signaling [48]. Consistently, our results showed that circHMGCS1 overexpression significantly upregulate the protein level of p-Akt (S473) and p-Akt (T308). While, circHMGCS1 knockdown significantly downregulate the protein level of p-Akt (S473) and p-Akt (T308) (Figure 10). CircHMGCS1 serves as an important activator of PI3K-Akt signaling pathway in HB cells. Oncogenic activation of PI3K-Akt signaling has a critical role in tumor pathogenesis via regulating proliferation and survival [49]. What's more, PI3K-Akt pathway is reported to regulate the utilization of glutamine to coordinate aerobic glycolysis in cancer cells. The detailed and proved molecular mechanisms include stimulating glutamine uptake, regulating the enzyme glutaminase (GLS) and glutamine synthetase (GLUL) [35]. Thus, the regulation effect of circHMGCS1 on GLS may be mediated by PI3K-Akt signaling pathway.
There are extensive literatures on the upregulation of IGF2 in tumors, especially pediatric tumor [50]. Upregulation of IGF2 has always been observed in HBs [51], while the precious mechanisms of IGF2 upregulation in HB are still uncertain. Loss of imprinting (LOI) and loss of heterozygosity (LOH) have been reported for IGF2 in embryonal tumors [52-54]. However, the LOI of IGF2 has been observed in about 20%HBs [55-57]. Thus, there must be another regulatory mechanism of IGF2 in HB. In our study, we demonstrated that the expression level of IGF2 was dramatically higher in HB tissues compared to matched normal tissues (Figure 7J and 9B), and was regulated by circHMGCS1 (Figure 8A-C). The comparison between the pattern of circHMGCS1 and IGF2 expression by serial sections indicated that circHMGCS1 and IGF2 colocalize in tumor cells (Figure 8G). These findings provide evidence for the existence of another important molecular mechanism of IGF2 upregulation in HBs.
A significant correlation between IGF2 expression and histology (p=0.007) was suggested in this study. Hepatoblastoma (epithelial) tissues showed a higher level of IGF2 compared to hepatoblastoma (mixed epithelial and mesenchymal) tissues. IHC staining showed that IGF2 were expressed in epithelial cells, not in mesenchymal cells (Figure S5). In addition, similar to circHMGCS1, the results from Kaplan-Meier survival curve analyses suggested that the increased expression level of IGF2 was correlated with a poor prognosis in HB patients (Figure 9E). Similar result was reported by SHARIFAH NOOR AKMAL [58]. The author revealed that the expression levels of IGF2 were inversely correlated with the degree of tumor cell differentiation in HB.
In summary, this study reveals the expression profile of circRNAs in HB. A number of differentially expressed circRNAs in HB compared to normal tissues were identified. CircHMGCS1 is significantly increased in HB and correlates with high serum AFP levels and a poor prognosis in HB patients. This study also revealed that circHMGCS1 exerts promoting effect on HB cells proliferation and survival by sponging tumor suppressor miR-503-5p to activate IGF2/IGF1R-PI3K-Akt signaling pathway and promote glutaminolysis. This study suggests that circHMGCS1 has considerable potential to act as a diagnostic and prognostic biomarker for HB patients and may be a therapeutic target.
Abbreviations
HB: hepatoblastoma; IGF2: Insulin-like growth factor 2; circRNA: Circular RNA; GLS: kidney-type glutaminase; HMGCS1: 3-hydroxy-3-methylglutaryl- CoA synthase 1; IHC: immunohistochemistry; ISH: in situ hybridization; ncRNAs: non coding RNAs; miRNAs: microRNAs; IF: immunofluorescence; CCK8: cell counting kit 8; IGF1R: insulin-like growth factor 1 receptor; BCL2: B-cell lymphoma 2; VEGFA: Vascular endothelial growth factor A; SEER: Surveillance, Epidemiology and End Results; HCC: hepatocellular carcinoma; ROC: receiver operating characteristic; KEGG: Kyoto Encyclopedia of Genes and Genomes; AFP: alphafetoprotein; AUC: area under the curve.
Supplementary Material
Supplementary figures and tables.
Acknowledgements
This work was supported by the National Natural Science Foundation of China [81572330, 81871727], the Shanghai Municipal Education Commission— Gaofeng Clinical Medicine Grant Support [20171926], the Science and Technology Development Fund of Pudong New Area of Shanghai [PKJ2017-Y03], the Program of Shanghai Academic/Technology Research Leader [18XD1402600], and the Municipal Human Resources Development Program for Outstanding Leaders in Medical Disciplines in Shanghai [2017BR036].
We thank Shanghai Children's Medical Center for supplying HB tissue samples. We thank Drs. Mingming Su, Sitong Lin from Metabo-profile Biotechnology (Shanghai) Co., Ltd. for their assistance in bioinformatics analysis.
Availability
Circinteractome (https://circinteractome.nia.nih .gov/Circular_RNA/circular_rna.html); Targetscan (http://www.targetscan.org/vert_72/); Mirtarbase (http://mirtarbase.mbc.nctu.edu.tw/php/index.php).
Accession numbers
The raw sequence data reported in this paper have been deposited in the Genome Sequence Archive (Genomics, Proteomics & Bioinformatics 2017) in BIG Data Center (Nucleic Acids Res 2018), Beijing Institute of Genomics (BIG), Chinese Academy of Sciences. The accession number is CRA001074 and the data will be released at August 20, 2020.
Competing Interests
The authors have declared that no competing interest exists.
References
1. Allan BJ, Parikh PP, Diaz S, Perez EA, Neville HL, Sola JE. Predictors of survival and incidence of hepatoblastoma in the paediatric population. HPB (Oxford). 2013;15:741-6
2. Czauderna P, Lopez-Terrada D, Hiyama E, Haberle B, Malogolowkin MH, Meyers RL. Hepatoblastoma state of the art: pathology, genetics, risk stratification, and chemotherapy. Curr Opin Pediatr. 2014;26:19-28
3. Hiyama E. Pediatric hepatoblastoma: diagnosis and treatment. Transl Pediatr. 2014;3:293-9
4. Meyers RL, Rowland JR, Krailo M, Chen Z, Katzenstein HM, Malogolowkin MH. Predictive power of pretreatment prognostic factors in children with hepatoblastoma: a report from the Children's Oncology Group. Pediatr Blood Cancer. 2009;53:1016-22
5. von Schweinitz D. Management of liver tumors in childhood. Semin Pediatr Surg. 2006;15:17-24
6. Semeraro M, Branchereau S, Maibach R, Zsiros J, Casanova M, Brock P. et al. Relapses in hepatoblastoma patients: clinical characteristics and outcome-experience of the International Childhood Liver Tumour Strategy Group (SIOPEL). Eur J Cancer. 2013;49:915-22
7. Cairo S, Armengol C, De Reynies A, Wei Y, Thomas E, Renard CA. et al. Hepatic stem-like phenotype and interplay of Wnt/beta-catenin and Myc signaling in aggressive childhood liver cancer. Cancer Cell. 2008;14:471-84
8. Hooks KB, Audoux J, Fazli H, Lesjean S, Ernault T, Dugot-Senant N. et al. New insights into diagnosis and therapeutic options for proliferative hepatoblastoma. Hepatology. 2018;68:89-102
9. Jeck WR, Sharpless NE. Detecting and characterizing circular RNAs. Nat Biotechnol. 2014;32:453-61
10. Cocquerelle C, Mascrez B, Hetuin D, Bailleul B. Mis-splicing yields circular RNA molecules. FASEB J. 1993;7:155-60
11. Jeck WR, Sorrentino JA, Wang K, Slevin MK, Burd CE, Liu J. et al. Circular RNAs are abundant, conserved, and associated with ALU repeats. RNA. 2013;19:141-57
12. Ashwal-Fluss R, Meyer M, Pamudurti NR, Ivanov A, Bartok O, Hanan M. et al. circRNA biogenesis competes with pre-mRNA splicing. Mol Cell. 2014;56:55-66
13. Hansen TB, Jensen TI, Clausen BH, Bramsen JB, Finsen B, Damgaard CK. et al. Natural RNA circles function as efficient microRNA sponges. Nature. 2013;495:384-8
14. Du WW, Yang WN, Liu E, Yang ZG, Dhaliwal P, Yang BB. Foxo3 circular RNA retards cell cycle progression via forming ternary complexes with p21 and CDK2. Nucleic Acids Res. 2016;44:2846-58
15. Li ZY, Huang C, Bao C, Chen L, Lin M, Wang XL. et al. Exon-intron circular RNAs regulate transcription in the nucleus. Nat Struct Mol Biol. 2015;22:256-64
16. Hsiao KY, Lin YC, Gupta SK, Chang N, Yen L, Sun HS. et al. Noncoding Effects of Circular RNA CCDC66 Promote Colon Cancer Growth and Metastasis. Cancer Res. 2017;77:2339-50
17. Han D, Li JX, Wang HM, Su XP, Hou J, Gu Y. et al. Circular RNA circMTO1 Acts as the Sponge of MicroRNA-9 to Suppress Hepatocellular Carcinoma Progression. Hepatology. 2017;66:1151-64
18. Xuan LJ, Qu LM, Zhou H, Wang P, Yu HY, Wu TY. et al. Circular RNA: a novel biomarker for progressive laryngeal cancer. Am J Transl Res. 2016;8:932-39
19. Yang YB, Gao XY, Zhang ML, Yan S, Sun CJ, Xiao FZ. et al. Novel Role of FBXW7 Circular RNA in Repressing Glioma Tumorigenesis. Jnci-J Natl Cancer I. 2018;110:304-15
20. Liu BH, Zhang BB, Liu XQ, Zheng S, Dong KR, Dong R. Expression Profiling Identifies Circular RNA Signature in Hepatoblastoma. Cell Physiol Biochem. 2018;45:706-19
21. Gao Y, Wang JF, Zhao FQ. CIRI: an efficient and unbiased algorithm for de novo circular RNA identification. Genome Biol. 2015:16
22. Li Y, Zheng QP, Bao CY, Li SY, Guo WJ, Zhao J. et al. Circular RNA is enriched and stable in exosomes: a promising biomarker for cancer diagnosis. Cell Res. 2015;25:981-4
23. Robinson MD, Oshlack A. A scaling normalization method for differential expression analysis of RNA-seq data. Genome Biol. 2010:11
24. Pruitt KD, Tatusova T, Brown GR, Maglott DR. NCBI Reference Sequences (RefSeq): current status, new features and genome annotation policy. Nucleic Acids Res. 2012;40:D130-D5
25. Yuan JS, Reed A, Chen F, Stewart CN. Statistical analysis of real-time PCR data. Bmc Bioinformatics. 2006:7
26. Kim MH, Kim H. Oncogenes and tumor suppressors regulate glutamine metabolism in cancer cells. J Cancer Prev. 2013;18:221-6
27. Dudekula DB, Panda AC, Grammatikakis I, De S, Abdelmohsen K, Gorospe M. CircInteractome: A web tool for exploring circular RNAs and their interacting proteins and microRNAs. RNA Biol. 2016;13:34-42
28. Hsu SD, Lin FM, Wu WY, Liang C, Huang WC, Chan WL. et al. miRTarBase: a database curates experimentally validated microRNA-target interactions. Nucleic Acids Res. 2011;39:D163-9
29. Wang T, Ge G, Ding Y, Zhou X, Huang Z, Zhu W. et al. MiR-503 regulates cisplatin resistance of human gastric cancer cell lines by targeting IGF1R and BCL2. Chin Med J (Engl). 2014;127:2357-62
30. Zhou B, Ma R, Si W, Li S, Xu Y, Tu X. et al. MicroRNA-503 targets FGF2 and VEGFA and inhibits tumor angiogenesis and growth. Cancer Lett. 2013;333:159-69
31. Hirakawa T, Nasu K, Abe W, Aoyagi Y, Okamoto M, Kai K. et al. miR-503, a microRNA epigenetically repressed in endometriosis, induces apoptosis and cell-cycle arrest and inhibits cell proliferation, angiogenesis, and contractility of human ovarian endometriotic stromal cells. Hum Reprod. 2016;31:2587-97
32. Pollak M. Insulin and insulin-like growth factor signalling in neoplasia. Nat Rev Cancer. 2008;8:915-28
33. Kwon DN, Chang BS, Kim JH. MicroRNA dysregulation in liver and pancreas of CMP-Neu5Ac hydroxylase null mice disrupts insulin/PI3K-AKT signaling. Biomed Res Int. 2014;2014:236385
34. Llobet-Navas D, Rodriguez-Barrueco R, Castro V, Ugalde AP, Sumazin P, Jacob-Sendler D. et al. The miR-424(322)/503 cluster orchestrates remodeling of the epithelium in the involuting mammary gland. Genes Dev. 2014;28:765-82
35. Lien EC, Lyssiotis CA, Cantley LC. Metabolic Reprogramming by the PI3K-Akt-mTOR Pathway in Cancer. Recent Results Cancer Res. 2016;207:39-72
36. Yang D, Sun L, Li Z, Gao P. Noncoding RNAs in Regulation of Cancer Metabolic Reprogramming. Adv Exp Med Biol. 2016;927:191-215
37. Zhou Y, Zhang X, Klibanski A. MEG3 noncoding RNA: a tumor suppressor. J Mol Endocrinol. 2012;48:R45-53
38. Takahashi K, Yan IK, Wood J, Haga H, Patel T. Involvement of extracellular vesicle long noncoding RNA (linc-VLDLR) in tumor cell responses to chemotherapy. Mol Cancer Res. 2014;12:1377-87
39. Dong R, Jia D, Xue P, Cui X, Li K, Zheng S. et al. Genome-wide analysis of long noncoding RNA (lncRNA) expression in hepatoblastoma tissues. PLoS One. 2014;9:e85599
40. Ecevit CO, Aktas S, Tosun Yildirim H, Demirag B, Erbay A, Karaca I. et al. MicroRNA-17, MicroRNA-19b, MicroRNA-146a, MicroRNA-302d Expressions in Hepatoblastoma and Clinical Importance. J Pediatr Hematol Oncol. 2019;41:7-12
41. Ashida S, Kawada C, Inoue K. Stromal regulation of prostate cancer cell growth by mevalonate pathway enzymes HMGCS1 and HMGCR. Oncol Lett. 2017;14:6533-42
42. Pandyra A, Mullen PJ, Kalkat M, Yu R, Pong JT, Li Z. et al. Immediate utility of two approved agents to target both the metabolic mevalonate pathway and its restorative feedback loop. Cancer Res. 2014;74:4772-82
43. Mullen PJ, Yu R, Longo J, Archer MC, Penn LZ. The interplay between cell signalling and the mevalonate pathway in cancer. Nat Rev Cancer. 2016;16:718-31
44. DeBerardinis RJ, Mancuso A, Daikhin E, Nissim I, Yudkoff M, Wehrli S. et al. Beyond aerobic glycolysis: transformed cells can engage in glutamine metabolism that exceeds the requirement for protein and nucleotide synthesis. Proc Natl Acad Sci U S A. 2007;104:19345-50
45. Perez-Gomez C, Campos-Sandoval JA, Alonso FJ, Segura JA, Manzanares E, Ruiz-Sanchez P. et al. Co-expression of glutaminase K and L isoenzymes in human tumour cells. Biochem J. 2005;386:535-42
46. Garber K. Cancer anabolic metabolism inhibitors move into clinic. Nat Biotechnol. 2016;34:794-5
47. Gross MI, Demo SD, Dennison JB, Chen L, Chernov-Rogan T, Goyal B. et al. Antitumor activity of the glutaminase inhibitor CB-839 in triple-negative breast cancer. Mol Cancer Ther. 2014;13:890-901
48. Adamek A, Kasprzak A. Insulin-Like Growth Factor (IGF) System in Liver Diseases. Int J Mol Sci. 2018:19
49. Martini M, De Santis MC, Braccini L, Gulluni F, Hirsch E. PI3K/AKT signaling pathway and cancer: an updated review. Ann Med. 2014;46:372-83
50. Luo JH, Ren B, Keryanov S, Tseng GC, Rao UN, Monga SP. et al. Transcriptomic and genomic analysis of human hepatocellular carcinomas and hepatoblastomas. Hepatology. 2006;44:1012-24
51. Zatkova A, Rouillard JM, Hartmann W, Lamb BJ, Kuick R, Eckart M. et al. Amplification and overexpression of the IGF2 regulator PLAG1 in hepatoblastoma. Genes Chromosomes Cancer. 2004;39:126-37
52. Ekstrom TJ, Cui H, Li X, Ohlsson R. Promoter-specific IGF2 imprinting status and its plasticity during human liver development. Development. 1995;121:309-16
53. Montagna M, Menin C, Chieco-Bianchi L, D'Andrea E. Occasional loss of constitutive heterozygosity at 11p15.5 and imprinting relaxation of the IGFII maternal allele in hepatoblastoma. J Cancer Res Clin Oncol. 1994;120:732-6
54. Ohlsson R, Hedborg F, Holmgren L, Walsh C, Ekstrom TJ. Overlapping patterns of IGF2 and H19 expression during human development: biallelic IGF2 expression correlates with a lack of H19 expression. Development. 1994;120:361-8
55. Rainier S, Dobry CJ, Feinberg AP. Loss of imprinting in hepatoblastoma. Cancer Res. 1995;55:1836-8
56. Li X, Adam G, Cui H, Sandstedt B, Ohlsson R, Ekstrom TJ. Expression, promoter usage and parental imprinting status of insulin-like growth factor II (IGF2) in human hepatoblastoma: uncoupling of IGF2 and H19 imprinting. Oncogene. 1995;11:221-9
57. Davies SM. Maintenance of genomic imprinting at the IGF2 locus in hepatoblastoma. Cancer Res. 1993;53:4781-3
58. Akmal SN, Yun K, MacLay J, Higami Y, Ikeda T. Insulin-like growth factor 2 and insulin-like growth factor binding protein 2 expression in hepatoblastoma. Hum Pathol. 1995;26:846-51
Author contact
![]() Corresponding authors: Qiuhui Pan, Tel: +86 021-38625568; Email: panqiuhuicom.cn or Fenyong Sun, Tel: +86 021-66303482; Email: sunfenyongnet.
Corresponding authors: Qiuhui Pan, Tel: +86 021-38625568; Email: panqiuhuicom.cn or Fenyong Sun, Tel: +86 021-66303482; Email: sunfenyongnet.
Citation styles
APA
Zhen, N., Gu, S., Ma, J., Zhu, J., Yin, M., Xu, M., Wang, J., Huang, N., Cui, Z., Bian, Z., Sun, F., Pan, Q. (2019). CircHMGCS1 Promotes Hepatoblastoma Cell Proliferation by Regulating the IGF Signaling Pathway and Glutaminolysis. Theranostics, 9(3), 900-919. https://doi.org/10.7150/thno.29515.
ACS
Zhen, N.; Gu, S.; Ma, J.; Zhu, J.; Yin, M.; Xu, M.; Wang, J.; Huang, N.; Cui, Z.; Bian, Z.; Sun, F.; Pan, Q. CircHMGCS1 Promotes Hepatoblastoma Cell Proliferation by Regulating the IGF Signaling Pathway and Glutaminolysis. Theranostics 2019, 9 (3), 900-919. DOI: 10.7150/thno.29515.
NLM
Zhen N, Gu S, Ma J, Zhu J, Yin M, Xu M, Wang J, Huang N, Cui Z, Bian Z, Sun F, Pan Q. CircHMGCS1 Promotes Hepatoblastoma Cell Proliferation by Regulating the IGF Signaling Pathway and Glutaminolysis. Theranostics 2019; 9(3):900-919. doi:10.7150/thno.29515. https://www.thno.org/v09p0900.htm
CSE
Zhen N, Gu S, Ma J, Zhu J, Yin M, Xu M, Wang J, Huang N, Cui Z, Bian Z, Sun F, Pan Q. 2019. CircHMGCS1 Promotes Hepatoblastoma Cell Proliferation by Regulating the IGF Signaling Pathway and Glutaminolysis. Theranostics. 9(3):900-919.
This is an open access article distributed under the terms of the Creative Commons Attribution (CC BY-NC) license (https://creativecommons.org/licenses/by-nc/4.0/). See http://ivyspring.com/terms for full terms and conditions.