Theranostics
13.3
Impact Factor
- Current Issue
- Advance Articles
- Volume 16; 2026
- Volume 15; 2025
- Volume 14; 2024
- Volume 13; 2023
- Volume 12; 2022
- Archive
- Cover Images
- Cover Suggestion
- Special Issues
Top
Introduction
Materials and Methods
Results
Discussion
Abbreviations
Supplementary Material
Acknowledgements
References
Introduction
Materials and Methods
Results
Discussion
Abbreviations
Supplementary Material
Acknowledgements
References
International Journal of Biological Sciences
International Journal of Medical Sciences
 Global reach, higher impact

Theranostics 2019; 9(3):796-810. doi:10.7150/thno.28992 This issue Cite
Research Paper
LINC01554-Mediated Glucose Metabolism Reprogramming Suppresses Tumorigenicity in Hepatocellular Carcinoma via Downregulating PKM2 Expression and Inhibiting Akt/mTOR Signaling Pathway
Yin-Li Zheng1*, Lei Li1*, Yong-Xun Jia2, Bao-Zhu Zhang1,3, Jiang-Chao Li4, Ying-Hui Zhu1, Meng-Qing Li1, Jiao-Zi He5, Ting-Ting Zeng1, Xiao-Jiao Ban1, Yun-Fei Yuan1, Yan Li1 ![]() , Xin-Yuan Guan1,5
, Xin-Yuan Guan1,5 ![]()
1. State Key Laboratory of Oncology in South China, Collaborative Innovation Center for Cancer Medicine, Sun Yat-Sen University Cancer Center, Guangzhou 510062, China
2. Department of Clinical Oncology, The First Affiliated Hospital of Zhengzhou University, Zhengzhou 450052, China
3. The People's Hospital of Baoan Shenzhen, The Affiliated Baoan Hospital of Southern Medical University, Shenzhen 518101, China
4. Vascular Biology Research Institute, Guangdong Pharmaceutical University, Guangzhou 510006, China
5. Department of Clinical Oncology, The University of Hong Kong, Hong Kong, China
*These authors contributed equally to this work.
Received 2018-8-4; Accepted 2018-12-22; Published 2019-1-24
Citation:
Zheng YL, Li L, Jia YX, Zhang BZ, Li JC, Zhu YH, Li MQ, He JZ, Zeng TT, Ban XJ, Yuan YF, Li Y, Guan XY. LINC01554-Mediated Glucose Metabolism Reprogramming Suppresses Tumorigenicity in Hepatocellular Carcinoma via Downregulating PKM2 Expression and Inhibiting Akt/mTOR Signaling Pathway. Theranostics 2019; 9(3):796-810. doi:10.7150/thno.28992. https://www.thno.org/v09p0796.htm
Other stylesAbstract

Background and Aims: Cancer cells prefer aerobic glycolysis to maintain growth advantages, but the role of long non-coding RNAs (lncRNAs) in glycometabolism still remains unclear. Here we identified one cytoplasmic lncRNA LINC01554 as a significantly downregulated lncRNA in hepatocellular carcinoma (HCC) and aimed to investigate its role in cellular glucose metabolism in the development and progression of HCC.
Methods: Quantitative real-time PCR was used to determine the expression level of LINC01554. Downregulation of LINC01554 by miR-365a at transcriptional level was assessed by luciferase reporter assay. Subcellular fractionation assay and RNA fluorescence in situ hybridization were performed to detect the subcellular localization of LINC01554. RNA pull-down assay, mass spectrometry, and RNA immunoprecipitation assay were used to identify the underlying molecular mechanisms. The tumor-suppressive function of LINC01554 was determined by both in vitro assay and nude mice xenograft model.
Results: LINC01554 was frequently downregulated in HCC, which was significantly associated with tumor invasion (P = 0.005), tumor size (P = 0.041), tumor staging (P = 0.023) and shorter survival (P = 0.035) of HCC patients. Luciferase reporter assay unraveled that LINC01554 was negatively regulated by miR-365a. Subcellular fractionation assay and RNA FISH revealed the cytoplasmic predominance of LINC01554 in MIHA cells and HCC clinical samples. Ectopic expression of LINC01554 inhibited HCC cell growth, colony formation in soft agar, foci formation, and tumor formation in nude mice. LINC01554 promoted the ubiquitin-mediated degradation of PKM2 and inhibited Akt/mTOR signaling pathway to abolish aerobic glycolysis in HCC cells. Further study found that LINC01554-knockout could effectively reverse the tumor-suppressive effect of LINC01554.
Conclusions: Our results identify LINC01554 as a novel tumor suppressor in HCC and unravel its underlying molecular mechanism in reprogramming cellular glucose metabolism. LINC01554 could possibly serve as a novel prognostic biomarker and provide the rationale for HCC therapy.
Keywords: HCC, LINC01554, Aerobic Glycolysis, PKM2, Akt
Introduction
Hepatocellular carcinoma (HCC) is the most common neoplasm of primary liver cancers, accounting for 85-90% of all cases. The incidence of HCC trends up annually makes it to be the second leading cause of cancer death in East Asia and the sixth in western countries [1, 2]. The failure of early diagnosis, deficiency of effective therapeutic targets and surveillance contribute to the poor prognosis of HCC. Thus, identifying new targets for therapeutic intervention and developing novel diagnostic approaches are in great need for early diagnosis and intervention for HCC.
Like other cancers, the pathogenesis of HCC is a long process involving complicated genetic and epigenetic alterations. Accumulating evidences has demonstrated the importance of long noncoding RNAs (LncRNAs) in the pathogenesis of cancers with diverse functions and mechanisms. LncRNAs are a class of transcripts, which are longer than 200 nucleotides in length with or without poor protein coding capacity [3, 4]. Many lncRNAs have been well elucidated in carcinogenesis. For examples, HOTAIR modulates cancer epigenome in breast cancer [5], MALAT1 regulates genes expression related to metastasis in lung cancer [6], and XIST plays tumor-suppressive role in hematologic cancer [7]. Intriguingly, the expression of lncRNAs is strikingly tissue-specific compared with protein coding genes [8, 9]. Additionally, lncRNAs may play roles in tumorigenesis through reprogramming the glucose metabolism [10, 11].
In our previous study, RNA-Seq has been applied to identify important genes and noncoding RNAs involved in the HCC carcinogenesis and development. Three pairs of HCC tumor and nontumor tissues were sequenced and compared [12]. Downregulation of a cytoplasmic long intergenic noncoding RNA, LINC01554, was detected in the three tested HCC tissues. Moreover, according to GEPIA (Gene Expression Profiling Interactive Analysis) [13], LINC01554 is highly expressed in liver in comparison to other organs in human body (Figure S1).
The aberration of glucose metabolism is one of the hall markers of human cancers. Enhanced glycolytic effect has proved to promote cancer cell proliferation as well as metastasis [14]. Pyruvate kinase is a key rate-limiting enzyme to catalyze the conversion of phosphoenolpyruvate (PEP) and ADP to pyruvate acid and generates ATP in the last step of aerobic glycolysis. There are different mammalian isoforms of pyruvate kinase, including pyruvate kinase isozymes M1 (PKM1), pyruvate kinase isozymes M2 (PKM2), and pyruvate kinase liver and red blood cells (PKLR). Among them, the aberrant expression PKM2 is most common pathogenic subtype in cancers [15, 16]. Notably, a small group of lncRNAs such as LINC-LET [17] and LINC-p21 [18], have been reported to regulate the activity of PKM2.
Here, our data indicate that downregulation of LINC01554 is correlated with poor outcome in patients with HCC. LINC01554 downregulation restrains aerobic glycolysis and tumor growth. Mechanistically, LINC01554 promotes proteasomal degradation of PKM2 and inhibits Akt/mTOR signaling pathway to decrease the aerobic glycolytic level in HCC cells. Its tumor-suppressive function and underlying mechanisms were characterized.
Materials and Methods
Clinical specimens
A total of 167 primary HCC samples, including tumor and adjacent non-tumor liver tissues, were collected from HCC hepatectomy in Sun Yat-Sen University Cancer Center (Guangzhou, China). Tissue specimens used in this study were reviewed and approved by the Committees for Ethical Review of Research at Sun Yat-sen University Cancer Center.
5' and 3' rapid amplification of cDNA ends (RACE), coding potential and secondary structure prediction of LINC01554
The transcriptional initiation and termination of LINC01554 were determined by 5' RACE and 3' RACE, respectively, with a SMART™ RACE cDNA Amplification Kit (Clontech, USA) following the manufacturer's instructions. The sequences for the gene-specific PCR primers used for 5' and 3' RACE analysis were listed in Table S1. The amplified products were gel purified, cloned into pGEM-T vector and confirmed by sequencing. The full-length sequence of LINC01554 determined by 5' and 3' RACE is presented in Figure S2A-C, and the transcript size of LINC01554 was validated to be 1943 bp. The coding potential of LINC01554 was estimated using the LINCipedia [18]. The PhyloCSF score was 13.8064 (with a score > 60.7876 indicating a potential coding gene) and the CPAT coding probability was 21.94% (with a score > 36.4% indicating a potential coding gene), supporting the protein-noncoding feature of LINC01554 (Figure S2D). Highly stable secondary structure of LINC01554 was predicted using RNAfold Webserver (Figure S2E).
Northern blot analysis
10 μg of total RNA samples isolated from MIHA and 7701 were separately subjected to electrophorese to 1% (wt/vol) agarose formaldehyde gels using NorthernMaxTM Kit (Invitrogen, Carlsbad, CA, USA) according to the manufacturers' protocols, and then transferred to a positive charged nylon membrane (GE Healthcare, Little Chalfont, Buckinghamshire, UK). The digoxigenin labeled LINC01554 DNA probe was purchased from Exonbio Lab (Guangzhou, China). After pre-hybridization for 30 min, the membrane was hybridized for 12 h at 42 °C in ULTRAhyb buffer containing the denatured probe. After washing, signal on the membrane was detected by DIG Wash and Block Buffer Set (Sigma, St. Louis, MO) according to the manufacturer's instructions.
Cell lines and plasmids
The human immortalized liver cell line MIHA and HCC cell lines BEL7402, QGY7701, QGY7703, SMMC7721, PLC8024, HepG2, Huh7 and Hep3B were employed in this study and their background information has been reported previously [20]. Full-length LINC01554 was cloned into pcDNA3.1(+) vector (Invitrogen, Carlsbad, CA ), and stably transfected into HCC cell lines BEL7402 and QGY7701 by hilymax (DOJINDO, Japan) according to the manufacturer's instructions.
Knockout LINC01554 by CRISPR/Cas9
LINC01554 KO cells were generated using the CRISPR/Cas9 genome editing system. Briefly, two sgRNAs that targeted LINC01554 were separately transfected into 293FT cells as well as lenti-Cas9-EGFP vector. sgRNAs sequences were listed in Table S1. All plasmids were purchased from Genecopoeia (Rockville, MD), including CP-LvC9NU-02 for construction of Cas9-EGFP and pCRISPR-LvSG03 for sgRNAs. Cas9-expressing cells (SMMC7721-Cas9) was established followed by co-infection of two sgRNAs. PCR and T7 endonuclease I cleavage were performed to detect the genomic deletions of isolated single colonies. The genomic deletions were validated by sequencing after cloning the corresponding PCR products into T vector (Takara, Japan).
RNA isolation and qRT-PCR
Total RNA of HCC samples and cell lines was isolated by TRIZOL Reagent (Invitrogen) following reverse transcription using the Evoscript Universal cDNA Master (Roche). qRT-PCR was performed to determine the relative RNA level using the SYBR Green method on Roche LightCycler® 480 PCR system. β-actin was employed as an endogenous control. Taqman MicroRNA reverse transcription kit (Applied Biosystems, Foster City, CA) was used to reversely transcript miR-365a and U6. TaqMan MicroRNA Assays (Applied Biosystems) were then applied to quantitating it. U6 small nuclear RNA was served as an internal control. The relative expression level of RNAs was calculated through the comparative Ct formula. All the primer sequences used in this study were listed in the Table S1.
Subcellular fractionation analysis
Subcellular isolation of RNAs in MIHA and SMMC7721 cells was conducted by Cytoplasmic and Nuclear RNA Purification Kit (Norgenbiotek Corporation, Thorold, ON, Canada) according to the manufacturer's instructions. Cytoplasmic and nuclear fractions were determined by qRT-PCR.
Functional assays in vitro
Cell proliferation assay, non-adherent colony formation assay, and foci formation assay were used to evaluate the biological function of LINC01554 in vitro. Cell proliferation assay was performed by using the Cell Counting Kit-8 (CCK8; Dojindo, Kumamoto, Japan) according to the manufacturer's instructions. As foci formation assay, 1 × 10³ cells were seeded in 6-well plates, and cell colonies (> 50 cells/colony) were counted by 1% crystal violet staining after one week. For non-adherent colony formation assay, 5 × 10³ cells were suspended in soft agar mixture, which was made up of Dulbecco's modified Eagle medium, 10% fetal bovine serum, and 0.35% SeaPlaque agarose. The suspension mixture subsequently was overlaid on the solidified 0.5% agar base. After two weeks, colonies were counted under the microscope in 10 fields per well and photographed. All the results were expressed as the mean ± SD of triplicate independent experiments.
Functional assay in vivo
Subcutaneous xenograft tumor model was used to estimate the effects of LINC01554 on tumorigenicity in vivo. Tested cells (3 × 10⁶ cells for 7402- LINC01554, 4 × 10⁶ cells for 7701-LINC01554, 4 × 10⁶ cells for 7721-KO) and control cells (7402-Vec, 7701-Vec, 7721-WT) were subcutaneously injected into the right and left dorsal flank of 4-week-old male BALB/C nude mice (Guangdong Animal Center, Guangzhou, China), respectively. Tumor size was measured and calculated as: V (mm3) = 0.5×L×W2 (L, long axis of tumor; W, short axis of tumor). About three to four weeks later, the tumors were isolated, weighted and fixed in the formaldehyde solution. All animal experiments were conducted in accordance with the Institutional Animal Care and Use Committee guidelines at Sun Yat-sen University Cancer Center.
Metabolic assays
Cells were seeded in 6-well plate and cultured for 24 h, then culture medium was collected and glucose, lactate and pyruvate were examined by glucose assay kit, lactate assay kit and pyruvate assay kit, respectively. For intracellular ATP measurement, cells were collected and ATP assay kit was applied according to manufacturer's protocol. The kits were purchased from Nanjing Jiancheng Bioengineering Institute (Nanjing, China). Results were normalized by protein concentration and triple independent experiments were performed.
LncRNA fluorescence in situ hybridization (FISH) and immunofluorescence staining
RNA FISH was performed on cells, HCC tumor and pairing nontumor tissues using RNA Fluorescence In Situ Hybridization Kit (Exonbio Lab, Guangzhou, China) as previously described [21]. Probes sequences were listed in Table S1, designed by Exonbio Lab (Guangzhou, China). RNA FISH and immunofluorescence staining were combined to detect the colocalization of LINC01554 and PKM2 in cells. Hybridization with lncRNA probes was first performed at 37 °C for 4 h, then incubated with rabbit anti-PKM2 antibody (1: 100 dilution, #4053, Cell Signaling Technology, Danvers, MA) overnight at 4 °C. After secondary antibodies incubation, Tyramide signal amplification (Exonbio Lab, Guangzhou, China) and DAPI (Abcam, Cambridge, MA) staining, the images were captured by confocal microscope (Olympus FV1000, Tokyo, Japan).
Antibodies and western blot assay
Western blot assay were performed according to the standard protocol. Information of antibodies is listed in the Table S2.
RNA pull-down assay and mass spectrometry
RNA pull-down assay was performed using Pierce Magnetic RNA-Protein Pull-down kit (Thermo scientific, Rockford, IL) according to the manufacturer's instructions. Briefly, sense and antisense RNAs were in vitro transcripted by T7 RNA polymerase using MEGAscript kit (Ambion, Carlsbad, CA) and labeled by Pierce RNA 3' Desthiobiotinylation Kit (Thermo Scientific, Rockford, IL), finally purified by phenol:chloroform mixture. 50 pmol biotin-labeled RNA was mixed with 50 μL streptavidin magnetic beads for 30 min at room temperature with rotation, then incubated with cell lysates. The eluted proteins were detected by western blot analysis and later mass spectrometry on a MALDI-TOF-MS instrument (Bruker Daltonics).
RNA immunoprecipitation assay
RNA immunoprecipitation assays were performed using RNA-Binding Protein Immunoprecipitation kit (Millipore, Burlington, MA) according to the manufacturer's instructions. 5 μg Rabbit anti-PKM2 (Cell Signaling Technology, Danvers, MA) and ATP5A1 (Sigma, St. Louis, MO) antibodies were used to perform RNA immunoprecipitation, respectively. The enrichment of LINC01554 was determined by RT-PCR.
Dual luciferase reporter assay
3'-UTR of LINC01554 (GGGGCATT) and mutant form (CCCCGTAA) were separately subcloned into a pEZX-MT06 vector which contains the firefly luciferase gene (Genecopoeia, China) to establish two constructs, wt-LINC01554-luc and mutant-LINC01554-luc, respectively. The pRL-TK vector containing the Renilla luciferase gene acted as an internal control. Overexpression constructs, including miR-365a-3p mimics and control, were co-transfected with wt-LINC01554-luc and mutant- LINC01554-luc into BEL7402, respectively. Luciferase activities were detected 24 h after transfection by the Dual-Luciferase Reporter Assay System (Promega, Madison, WI) according to the manufacturer's instructions.
Cycloheximide (CHX) chase assay
To observe the degradation process of protein, CHX (MP biomedicals, Santa Ana, CA) was introduced to the cell culture medium at a final concentration of 100 ng/mL. Total protein was extracted at indicated time points and analyzed by western blotting.
In vitro ubiquitination assay
Cells were treated with MG132 (10 μM, Selleck Chemicals, Houston, TX) for 10 h. Cell lysates were then collected and subjected to immunoprecipitation with rabbit anti-PKM2 antibody (1:50 dilution, #4053, Cell Signaling Technology, Danvers, MA), eluted by 20 μL lysis buffer and denatured by SDS sample buffer (Thermo scientific, Rockford, IL). The elution was assessed by western blotting with rabbit anti-ubiquitin antibody (Table S2).
In vitro and in vivo Akt inhibitor assay
For in vitro assay, 1 × 10³ LINC01554-transfected cells (7402-LINC01554, 7701-LINC01554) and LINC01554-KO (7721-KO) were seeded in 6-well-plate and treated with MK2206 (Selleck Chemicals, Houston, TX) in different concentrations (0.0, 0.5, 1.0, 5.0 μM) to examine the foci formation ability. 3 × 10³ cells were seeded in 96-well-plate to evaluate the cells growth rate with MK2206. For in vivo assay, 4-week-old male BALB/C nude mice (Guangdong Animal Center) were implanted subcutaneously at the right flank with 5 × 10⁶ LINC01554-transfected cells (7402-LINC01554, 7701-LINC01554). Two weeks later, mice were executed and the subcutaneous xenografts were isolated and cut into small pieces to bear in mice separately. Once the tumor volume reached to the range from 80 - 100 mm3, mice were randomly divided into two groups. MK2206 was dissolved in 30% (w/v) Captisol (Selleck Chemicals, Houston, TX) solution to optimize the solubility and stability [22]. Mice were administered orally with MK2206 at the dose of 100 mg/kg body weight and 30% Captisol (served as control) every second day for 2 weeks, respectively [23]. After isolation of xenograft tumors, each tumor was immediately frozen in liquid nitrogen for Western blot analysis. All animal experiments were conducted in compliance with the policies and regulations of Institutional Animal Care and Use Committee at Sun Yat-sen University Cancer Center.
Immunohistochemistry staining
IHC study was performed according to a standard streptavidin-biotin-peroxidase complex method. Paraffin-embedded, formalin fixed sections were dewaxed by xylene, rehydrated using graded ethanol, rinsed with deionized water, and then blocked with 3% hydrogen peroxide for 10 min at room temperature. Antigen retrieval was performed by high-pressure-cooking the samples in a 10 mM citrate buffer (pH 6.0) for 4 min. Slides were blocked with 5% normal goat serum for 30 min at room temperature and subsequently incubated with primary antibody at 4 °C overnight. The usage information of primary antibodies was listed in Table S2. Slides were then incubated with an Envision detection system (DAKO), and the nucleus was counterstained by Meyer's hematoxylin.
Statistics
Statistical analysis was performed using SPSS version 22.0 (SPSS, Chicago, IL). Paired student t test was used for analysis of LINC01554 and miR-365a mRNA level in HCC specimens. Kaplan-Meier plots and log-rank tests were used for overall survival analysis. Pearson chi-square test was applied to analyzing clinical correlations between LINC01554 and clinicopathologic parameters as well as the correlations between LINC01554 and miR-365a-3p in HCC tumor tissues. Univariable and multivariable Cox proportional hazards regression models were performed to analyze independent prognostic factors. The independent Student t test was used to compare the cell growth rate, non-adherent colony formation, foci formation, tumor growth rate, glucose consumption, lactate production, ATP production and pyruvate production, etc. Results with P < 0.05 were considered statistically significant.
Results
LINC01554 is frequently downregulated in HCC
To test expression status of LINC01554 in HCC, qRT-PCR was performed to compare LINC01554 expression level between 167 HCC and corresponding non-tumor tissues. Result showed that LINC01554 expression level was significantly lower in tumor tissues compared with their adjacent non-tumor tissues (P < 0.001, Figure 1A). Downregulation of LINC01554 was detected in 135/167 (80.8%) of HCC tissues (Figure 1B). RT-PCR was also performed in 7 HCC cases and absent expression of LINC01554 was detected in all HCC tissues (Figure S3A). Additionally, LINC01554 was downregulated in HCC cell lines compared with the immortalized liver cell line MIHA (Figure 1C). Northern blot analysis further validated the expression of LINC01554 in cells, which was extremely low in HCC cell line QGY7701, but notably high in MIHA (Figure S3B). We also explored LINC01554 level in Lee's Cohort [24], Llovet's Cohort [25], Wurmbach's Cohort in oncomine, and TCGA datasheet. And the results were consistent with our findings (Figure 1D). Furthermore, in addition to HCC, LINC01554 is frequently downregulated in cholangiocarcinoma, testicular germ cell tumors, skin cutaneous melanoma and ovarian cancer (Figure S3C). Subcellular fractionation analysis and LncRNAs FISH assay unraveled that LINC01554 was primarily located in the cytoplasm (Figure 1E-F).
Clinical significance of LINC01554 in HCC
The correlation between LINC01554 downregulation and clinicopathologic features in 167 HCC samples was then statistically analyzed. We found that downregulation of LINC01554 was significantly associated with adjacent organs invasion (P = 0.005), tumor size (P = 0.041) and tumor staging (P = 0.023, Table 1). Kaplan-Meier analysis demonstrated downregulation of LINC01554 was significantly associated with poorer overall survival in our cohort (n = 167, P = 0.035) and TCGA datasheet (n = 364, P < 0.001, Figure 1G). Univariate Cox regression analysis revealed that microsatellite formation (P = 0.002), cirrhosis (P = 0.007), adjacent organs invasion (P < 0.001), tumor size (P < 0.001) and LINC01554 downregulation (P = 0.004) were significantly related to overall survival (Table 2). Multivariate Cox regression analysis indicated that downregulation of LINC01554 was an independent prognostic factor of HCC patients (P = 0.017, Table 2).
Figure 1
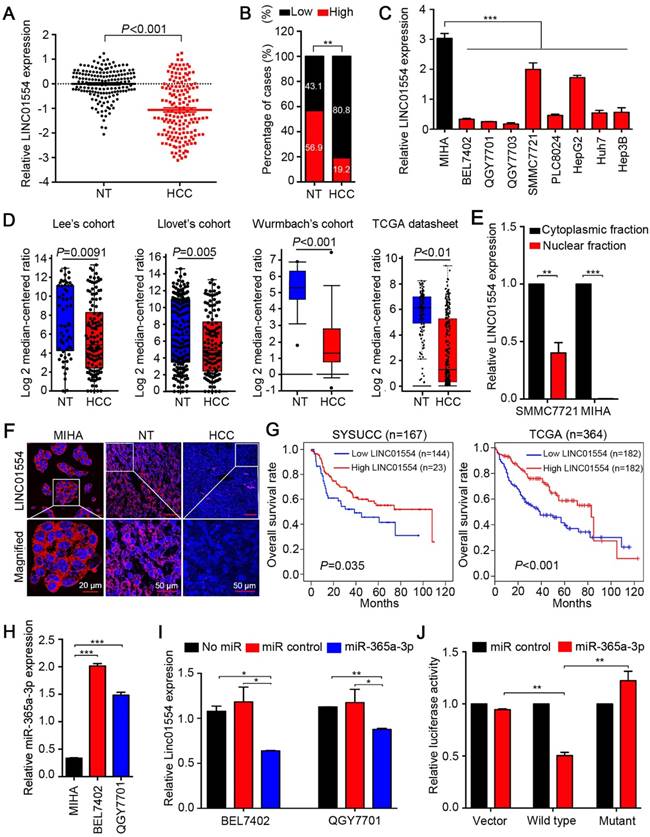
LINC01554 is frequently downregulated in HCCs. (A) Relative expression level of LINC01554 detected by qRT-PCR in 167 HCC tissues and adjacent non-tumor tissues. Expression of β-actin was used as an internal control. (B) LINC01554 expression fractions in 167 HCC tissues and adjacent non-tumor tissues. (C) Relative expression level of LINC01554 detected by qRT-PCR in an immortalized liver cell line (MIHA) and HCC cell lines. Expression of β-actin was used as internal control. (D) RNA sequencing expression of LINC01554 was analyzed in different cohorts, including Lee's cohort, Llovet's cohort, Wurmbach's cohort in oncomine (https://www.oncomine.org), and TCGA database. (E) Nuclear and cytoplasmic fractions of LINC01554 in MIHA cells and SMMC7721 cells determined by qRT-PCR with U6 or β-actin as a nuclear or cytoplasmic internal control. (F) Representative images of subcellular localization of LINC01554 (red) in MIHA cells, HCC tissues and adjacent non-tumor tissues detected by RNA FISH. Nuclei were stained with DAPI (blue). Scale bar, 20 μm in image of MIHA cells and 50 μm in images of adjacent non-tumor and HCC tissues. (G) Kaplan-Meier analysis revealed that low expression of LINC01554 was related to poorer overall survival of HCC patients in both SYSUCC cohort (n = 167, P = 0.035) and TCGA database (n = 364, P < 0.001). (H) The expression levels of miR-365a in MIHA, BEL7402 and QGY7701 cells determined by qRT-PCR with U6 as an internal control. (I) LINC01554 expression levels were determined by qRT-PCR in BEL7402 cells and QGY7701 cells, after transient transfection of miR-365a-3p mimics and control. β-actin was served as an internal control (J) Relative luciferase activities were detected by Dual-Luciferase Reporter assays in BEL7402 cells after co-transfection of miR-365a-3p mimics or miR-control with wild-type-LINC01554-luc, mutant-LINC01554-luc or empty vector with pRL-TK. Error bars represent SD in triplicate experiments (*, P < 0.05; **, P < 0.01; ***, P < 0.001 in independent Student's t test).
Figure 2
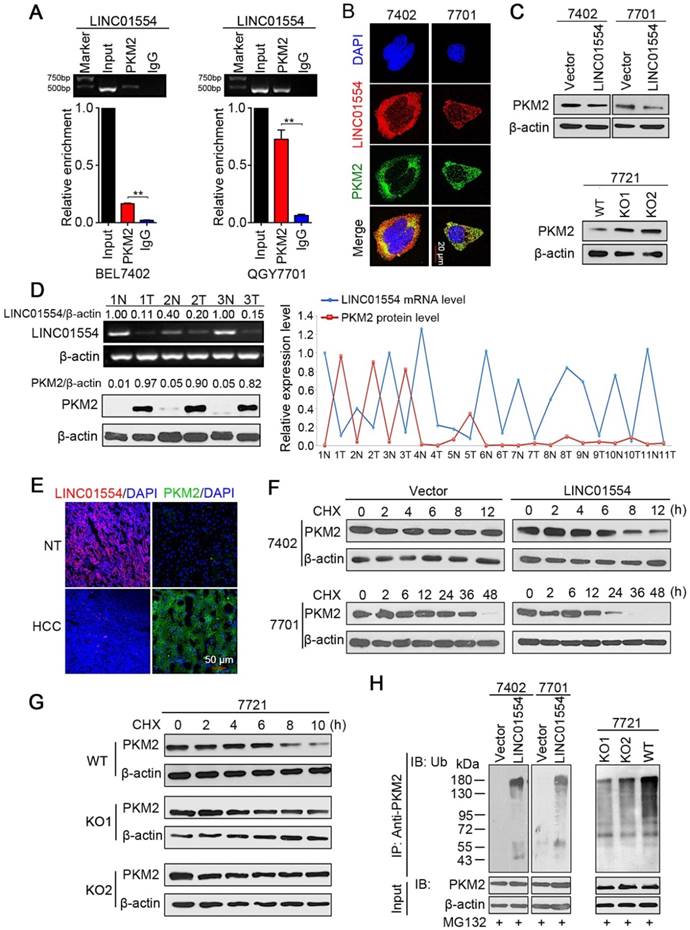
LINC01554 accelerates PKM2 degradation by ubiquitin-mediated proteolysis. (A) RIP assays of LINC01554 in BEL7402 cells and QGY7701 cells using anti-PKM2 and IgG antibodies, respectively. The percentage of RIP-enriched RNA relative to input was determined by RT-PCR. Error bars represent SD in triplicate experiments (**, P < 0.01). (B) Representative images of co-staining LINC01554 (red) and PKM2 (green) in BEL7402 cells and QGY7701 cells by combination of RNA FISH and immunofluorescence. Nuclei were stained with DAPI (blue). Scale bar = 20 μm. (C) PKM2 protein levels in LINC01554-transfected cells and knockout cells were analyzed by western blotting. (D) Representative images of LINC01554 detected by RT-PCR and PKM2 by Western blotting (left). The line chart (right) revealed the negative correlation between LINC01554 and PKM2 in 11 pairs of HCC tissues and adjacent non-tumor tissues. N, non-tumor tissue; T, tumor tissue. (E) Representative images of expression of LINC01554 (red, detected by RNA FISH) and PKM2 (green, detected by immunofluorescence) in the same tumor tissue and adjacent non-tumor tissues. Scale bar = 50 μm. (F and G) CHX assays for observing PKM2 degradation rate in LINC01554-transfected cells, knockout cells and their vectors. Cells were treated with CHX (100 ng/mL) for the indicated time points. β-actin was used as a loading control. (H) in vitro ubiquitination assay in LINC01554-transfected cells, knockout cells and their vectors. All cells were incubated with MG132 (10 μM) for 10 h. Cell lysates were immunoprecipitated with anti-PKM2 antibody. The precipitates and input were analyzed by immunoblotting. Bottom panel, input of cell lysates. Vector, empty vector-transfected cells; LINC01554, LINC01554-transfected cells; WT, wild-type cells; KO, LINC01554-knockout cells.
Table 1
Clinicophathologic Correlation of LINC01554 Expression in HCC
| Features | Total | LINC01554 expression | P | |
|---|---|---|---|---|
| Low (N=144) | High (N=23) | |||
| Gender | ||||
| Male | 148 | 126 | 22 | 0.477 |
| Female | 19 | 18 | 1 | |
| Age (years) | ||||
| ≤60 | 130 | 113 | 17 | |
| >60 | 37 | 31 | 6 | |
| Hepatitis B virus surface Ag | ||||
| Negative | 24 | 22 | 2 | 0.535 |
| Positive | 144 | 122 | 21 | |
| Microsatellite formation | ||||
| No | 121 | 103 | 18 | 0.620 |
| Yes | 46 | 41 | 5 | |
| Cirrhosis | ||||
| No | 33 | 29 | 4 | 0.507 |
| Yes | 134 | 115 | 19 | |
| Adjacent organs invasion | ||||
| No | 131 | 108 | 23 | 0.005* |
| Yes | 36 | 36 | 0 | |
| Tumor size (cm) | ||||
| ≤7 | 97 | 79 | 18 | 0.041* |
| >7 | 70 | 65 | 5 | |
| Tumor staging (AJCC) | ||||
| I-II | 102 | 83 | 19 | 0.023* |
| III-IV | 65 | 61 | 4 | |
*P < 0.05 represents statistically significant and is shown in bold.
Table 2
Cox Proportional Hazards Model to analyze OS in 167 HCC patients.
| Clinicopathologic features | Univariate analysis | Multivariate analysis | ||||
|---|---|---|---|---|---|---|
| Risk ratio | 95% CI | P | Risk ratio | 95% CI | P | |
| Gender | 1.639 | 0.706-3.803 | 0.250 | |||
| Age (years) | 1.278 | 0.757-2.158 | 0.358 | |||
| HBV surface Ag | 0.900 | 0.461-1.757 | 0.758 | |||
| Tumor staging (AJCC) | 1.731 | 0.753-3.814 | 0.153 | |||
| Microsatellite formation | 2.131 | 1.325-3.427 | 0.002* | 1.608 | 0.994-2.603 | 0.053 |
| Cirrhosis | 1.939 | 1.195-3.147 | 0.007* | 1.315 | 0.797-2.169 | 0.284 |
| Adjacent organs invasion | 4.199 | 2.418-7.293 | <0.001* | 2.430 | 1.275-4.632 | 0.007* |
| Tumor size (cm) | 2.532 | 1.598-4.012 | <0.001* | 1.708 | 1.096-2.660 | 0.018* |
| Downregulation of LINC01554 in tumor | 2.041 | 1.248-3.081 | 0.004* | 2.507 | 1.153-2.832 | 0.017* |
CI, confidence interval. *P < 0.05 represents statistically significant.
LINC01554 is downregulated by miR-365a
Emerging studies have illustrated that interaction between miRNAs and long noncoding RNAs was critical for lncRNAs regulation [26, 27]. By exploring two bioinformatic databases, TargetScan (http://www.targetscan.org) and miRanda (http://www.microrna.org), we found miR-365a-3p was a putative miRNA targeting LINC01554 (Figure S3D). Upregulation of miR-365a-3p was identified significantly higher in HCC tissues compared with their adjacent non-tumor tissues (P < 0.05, Figure S3E). Further, linear regression analyses showed the expression of miR-365a-3p was negatively correlated with LINC01554 expression in 62 HCC specimens using qRT-PCR (R = -0.487, P < 0.001, Figure S3F). We also detected miR-365a-3p in two HCC cells (BEL7402 and QGY7701) and MIHA cells and the result showed that miR-365a-3p level was significantly higher in HCC cells than that in MIHA cells (Figure 1H). Next, we separately transfected miR-365a-3p mimics and miR-control to BEL7402 and QGY7701 to evaluate the influence of miR-365a-3p on LINC01554 mRNA expression level. LINC01554 mRNA level was notably decreased in comparison to the control groups (Figure 1I). To further verify whether LINC01554 is a direct target of miR-365a-3p, we established two constructs, wt-LINC01554 3'-UTR and mutant LINC01554 3'-UTR. Empty luciferase reporter construct served as a control. The relative luciferase activity in BEL7402 cells appeared significant diminishment after co-transfection of miR-365a-3p mimics and wt-LINC01554-luc, while the luciferase activity was not affected in empty vector group or mutant-LINC01554-luc group (Figure 1J). Collectively, these findings supported that miR-365a could directly downregulate LINC01554.
LINC01554 accelerates PKM2 degradation
Accumulating evidence has revealed that the subcellular localization of lncRNAs was strongly associated with their functions and mechanisms. For instance, lncRNAs in the cytoplasm may affect protein translational modifications or gene regulation by behaving as decoys for miRNAs and proteins [28,29]. Since LINC01554 mainly accumulates to the cytoplasm, we asked whether LINC01554 would play a role in regulating cytoplasmic proteins through direct interaction. RNA pull-down assay thereby was conducted followed by mass spectrometry analysis to verify our hypothesis. Intriguingly, the results showed that LINC01554 could pull-down a series of aerobic glycolytic enzymes (Table S3), suggesting that LINC01554 might involve in regulation of glucose metabolism in HCC, especially in aerobic glycolysis. List of LINC01554-interacting proteins identified by mass spectrometry was also presented in Table S4.
Increasing evidences have demonstrated that cancer cells prefer to aerobic glycolysis since this unique metabolic pattern can provide more precursors for biosynthesis of macromolecules, such as nucleic acids, amino acids and lipids, which are essential for sustaining rapid division of cancer cells [30, 31]. In the LINC01554 pull-down proteins, pyruvate kinase M2 (PKM2) drew our attention because pyruvate kinase was speed-limited enzymes in aerobic glycolytic pathway. As one of the isoforms of pyruvate kinase, PKM2 has been reported to enrich in rapid proliferative cells, such as embryonic cells and cancer cells [32]. RNA immunoprecipitation with two primary antibodies, PKM2 (Figure 2A) and ATP5A1 (Figure S4A) were applied to validate the result of mass spectrometry. The interaction between PKM2 and LINC01554 was further validated in QGY7701 cells and BEL7402 cells (Figure 2A). Furthermore, RNA FISH combined with Immunofluorescence (IF) presented the colocalization of PKM2 and LINC01554 in the cytoplasm (Figure 2B). Besides, we found that PKM2 protein level decreased in LINC01554-transfected BEL7402 and QGY7701 cells (Figure 2C, upper). To further confirm the impact of LINC01554 on PKM2, we generated LINC01554- knockout (KO) cells by CRISPR/Cas9 in SMMC7721 cells. A number of clones were successfully edited, and two clones were used in this study (Figure S4B-D). The protein level of PKM2 was successfully rescued in LINC01554-KO SMMC7721 cells (Figure 2C, lower). To further validate the negative regulation role of LINC01554 on PKM2, LINC01554 mRNA levels and PKM2 protein levels were measured in 11 pairs of HCC tissues and corresponding non-tumor tissues. Relative intensity of each band was scanned and quantified by Quantity One (Bio-rad, Hercules, CA). And a negative correlation was observed between LINC01554 and PKM2 (Figure 2D and Figure S4E). In Addition, RNA FISH of LINC01554 and IF of PKM2 performed separately in clinical specimens also presented the similar pattern (Figure 2E).
Next, we tried to explore the molecular mechanism of the interaction between LINC01554 and PKM2. Results from qRT-PCR showed that there was no significantly difference of PKM2 mRNA levels between LINC01554-transfected cells or LINC01554- KO cells and their controls (Figure S4F). Thus, we speculated LINC01554 might regulate the protein stability of PKM2. Result from cycloheximide chase assay demonstrated that PKM2 in LINC01554- transfected cells behaved shorter half-life than that in control group (Figure 2F). However, effect of LINC01554 on PKM2 was abolished in LINC01554-KO cells (Figure 2G). As more than 80% of protein degradation is related to the ubiquitin-proteasome pathway [33], we tested whether LINC01554 was involved in the ubiquitin-mediated PKM2 degradation by in vitro ubiquitination assay. The result illustrated that the ubiquitin-mediated PKM2 degradation was enhanced in LINC01554-transfected cells compared with their controls (Figure 2H, left). The ubiquitin-mediated degradation effect of LINC01554 on PKM2 was significantly abrogated in LINC01554-KO cells (Figure 2H, right). These results demonstrated that LINC01554 downregulated PKM2 by ubiquitin-mediated degradation.
LINC01554 impairs aerobic glycolysis in HCC cells
Since LINC01554 promotes degradation of PKM2, which is one of the isoform of pyruvate kinase, the speed-limited enzyme in the last step of glycolysis pathway, we raised a question about whether LINC01554 could subsequently affect the metabolic phenotype in HCC cells. LINC01554 was stably transfected into HCC cell lines BEL7402 and QGY7701 (Figure S5A). Glucose consumption, lactate production, pyruvate production and ATP level were then detected in LINC01554-transfected cells and their vectors respectively. Results showed that LINC01554 could decrease glucose consumption (Figure 3A), lactate production (Figure 3B), pyruvate production (Figure 3C), and increase ATP level (Figure 3D). The inhibitory effect of LINC01554 on aerobic glycolysis could be reversed when LINC01554 was knocked out (Figure 3A-D). These results implied that LINC01554 could inhibit aerobic glycolysis in HCC cells.
LINC01554 exerts strong tumor-suppressive function
Enhanced aerobic glycolytic effect has been recognized as the hallmark of cancer cells. More energetic requirements, which supplied by the intermediates generated from aerobic glycolysis, are needed for cancer cell division. Therefore, based on the observation that LINC01554 inhibited the aerobic glycolysis in HCC cells, the suppressive impact of LINC01554 on HCC tumorigenesis was then characterized by both in vitro and in vivo functional assays. Cell growth, non-adherent colony formation and foci formation assays were performed to assess the in vitro function of LINC01554. Compared with empty vector-transfected cells, LINC01554-transfected cells showed slower cell growth rate (Figure 3E), poorer colony formation ability in soft agar (Figure 3F) and lower foci formation frequency (Figure 3G). However, after introducing miR-365a-3p mimics, the inhibitory effect of LINC01554 on cell growth was dramatically impaired (Figure S5B). To further study the tumor-suppressive role of LINC01554 in vivo, empty vector and LINC01554-transfected cells were injected subcutaneously to the left and right dorsal flanks of nude mice (n = 6), respectively. The result showed that tumors derived from LINC01554-transfected cells grew much slowly with smaller size and lighter weight, compared with tumors developed from empty vector-transfected cells (Figure 3H and Figure S5C). Both in vitro and in vivo tumor suppressive effects of LINC01554 could be reversed in LINC01554-KO cells (Fig. 3E, G-H and Figure S5C). Moreover, proliferation marker Ki67 and expression of PKM2 by IHC staining was much lower in xenograft with LINC01554-transfected cells than that with empty-vector transfected cells, but higher in xenograft tumors developed from LIN01554-KO cells compared with xenograft tumors derived from LINC01554-WT cells (Figure 3I, Figure S5E). Thus, these findings strongly recommended that LINC01554 exerted tumor-suppressive function.
Figure 3
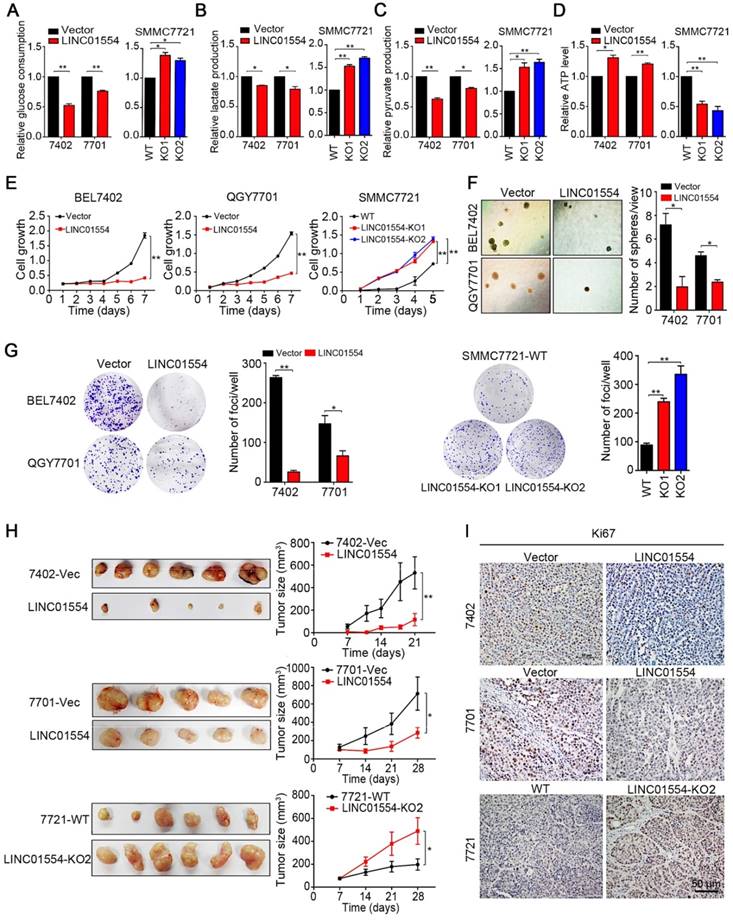
LINC01554 exerts tumor-suppressive function through inhibiting aerobic glycolysis in HCC cells. Detection of glucose consumption (A), lactate production (B), pyruvate production (C), and intracellular ATP level (D) in LINC01554-transfected cells, knockout cells and their vectors. *, P < 0.05; **, P < 0.01 in independent Student's t test. (E) CCK8 proliferation assay was used to compare cell growth rates between LINC01554-transfected, LINC01554-knockout and their vectors. Non-adherent colony formation assays (F) and foci formation assays (G) and were used to compare colony formation abilities between LINC01554-transfected, LINC01554-knockout and their controls. Error bars represent SD in triplicate experiments (*, P < 0.05; **, P < 0.01 in independent Student's t test). (H) Images of xenograft tumors derived from LINC01554-transfected cells, knockout cells and their vectors in nude mice. Tumor growth curves were summarized in the line chart. The average tumor volume was expressed as the mean standard deviation of 6 mice (*, P < 0.05; **, P < 0.01 in independent Student's t test). (I) Representative IHC images of Ki67 expressions in xenograft tumors derived from LINC01554-transfected cells, LINC01554-knockout cells and their vectors. Scale bar = 50 μm. Vector, empty vector-transfected cells; LINC01554, LINC01554-transfected cells; WT, wild-type cells; KO, LINC01554-knockout cells.
LINC01554 inhibits Akt/mTOR signaling pathway
To determine signaling pathway affected by LINC01554 in inhibiting tumor growth, KEGG pathway analysis was performed using COEXPREdb [34], which was based on microarray and RNA-Seq data. The result showed that LINC01554 was related to PI3K/Akt signaling pathway (Figure S5D), which plays pivotal role in cell proliferation. Also, combined with mTOR, PI3K/Akt/mTOR signaling pathway has been recognized as a central signaling pathway coordinating nutrient availability, including aerobic glycolysis [35]. Our result revealed that phosphorylated Akt (p-Akt) decreased in LINC01554-transfected cells compared with control cells (Figure 4A). mTOR is the downstream of Akt pathway and upstream of p70 S6 kinase. To examine the effect of LINC01554 on mTOR pathway, phosphorylated mTOR (p-mTOR) and phosphorylated p70 S6 kinase (p-p70 S6K) were detected. In line with our hypothesis, p-mTOR and p-p70 S6K were all reduced in LINC01554-tranfected cells compared with vectors (Figure 4A, left). The inhibitory effect of LINC01554 on Akt/mTOR pathway was abolished in LINC01554-KO cells (Figure 4A, right). Result from IHC staining also presented that p-Akt and p-mTOR expression level were lower in the xenograft tumors originated from LINC01554-transfected cells, but higher in xenograft tumors derived from LINC01554-KO cells compared to their vectors, respectively (Figure S5E). These findings strongly suggested that LINC01554 could restrain Akt/mTOR pathway.
To further confirm the inhibitory role of LINC01554 on Akt/mTOR signaling pathway and explore the clinical translation prospects of LINC01554, an Akt inhibitor, MK2206, was introduced to in vitro functional assays in both LINC01554- transfected cells and LINC01554-KO cells. MK2206 is a small molecular inhibitor of Akt and has been currently tested in the clinical trials of cancers treatment. In our study, both cell growth assay and foci formation assay were dramatically inhibited by MK2206 with the increasing concentrations in LINC01554-transfected cells compared to LINC01554- KO cells (Figure 4B-C). In addition, the phosphorylation of Akt and mTOR was markedly inhibited in a dose-dependent manner in LINC01554-transfected cells (Figure 4D). However, in LINC01554-KO cells, the suppressive impact of MK2206 on Akt and mTOR phosphorylation was attenuated (Figure 4D, the most right). Moreover, to determine whether LINC01554 impaired aerobic glycolysis in HCC cells via Akt/mTOR signaling pathway, glucose metabolism was measured in LINC01554-KO cells after treatment with Akt inhibitor MK2206. Both glucose consumption and lactate production were decreased after introduction of MK2206 (Figure S6A-B).
To explore whether HCC patients with high expression of LINC01554 would benefit from MK2206 as potential therapeutic strategy, HCC mice xenograft model derived from LINC01554-transfected cells was constructed. When subcutaneous tumors grew to the range from 80 - 100 mm3 in volume, MK2206 (100 mg/kg) in 30% captisol was administrated orally every second day for two weeks. Control groups were given 30% captisol. Notably, 2 weeks later, the MK2206 groups presented slower growth rate compared to vehicle groups in both BEL7402 and QGY7701 cells (Figure 4E). Proteins of xenograft tumors in different groups were extracted to validate the effect of MK2206 on AKT/mTOR pathway. As Figure 4F showed, phosphorylated mTOR was significantly decreased, indicating that Akt/mTOR pathway was effectively inhibited. These results further supported that LINC01554 inhibited Akt/mTOR signaling pathway and more importantly, it might serve as an indicator for introducing MK2206 to HCC therapy.
Discussion
Despite the pathogenesis of HCC has been widely investigated, the pivotal molecular mechanism for its initiation and progression still remains unclear, thereby restricting the development of effective therapeutic strategies. Recently, extensive studies have revealed that molecular aberration in metabolic events is strongly relevant to initiation and progression of cancers. It is well-known that increased aerobic glycolysis is one of the features of cancer cells, which has been exploited to detect and image tumors through positron emission tomography-computed tomography (PET/CT). As liver is an organ with high glucose metabolic activity, the dysfunction of sustaining glucose metabolism homeostasis may contribute to the pathogenesis of HCC. In the recent two decades, long noncoding RNAs has been proved to act crucial biological functions in embryonic development and diseases, including cancers. LINC01554 has been reported to be associated with advancing fibrosis of non-alcoholic fatty liver disease (NAFLD) patients and survival of esophageal carcinoma patients in previous study [36, 37]. However, whether LINC01554 contributes to HCC development is still unidentified. In this study, we found that LINC01554 was frequently downregulated in HCCs. Clinical analysis reveals that downregulation of LINC01554 is associated with adjacent organ invasion, tumor size, advanced tumor stage and poor prognosis of HCC patients. Besides HCC, Database exploring results also unraveled that LINC01554 was downregulated in some cancers, including cholangiocarcinoma, testicular germ cell tumors, skin cutaneous melanoma and ovarian serous cystadenocarcinoma.
Figure 4
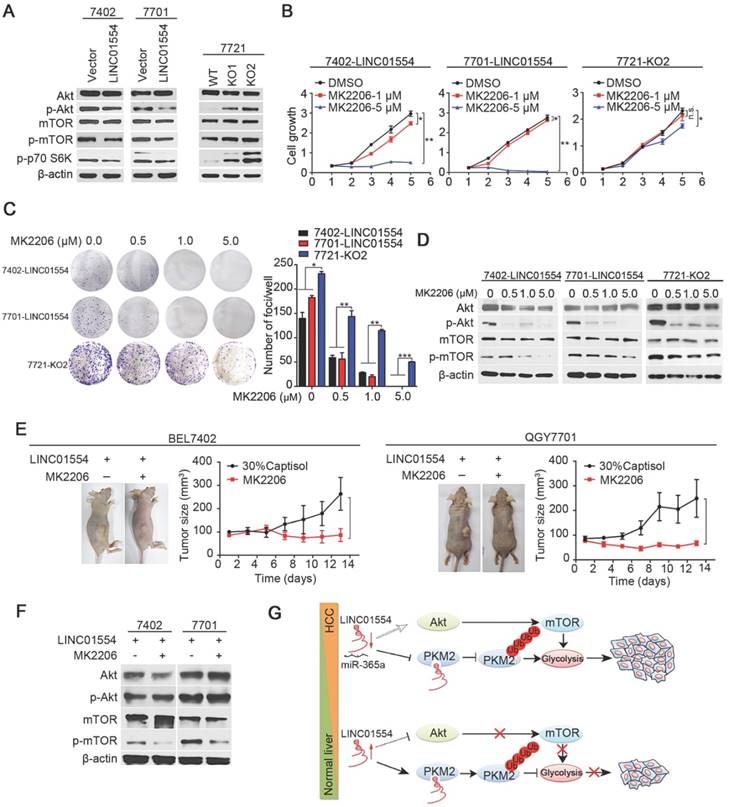
LINC01554 inhibits Akt/mTOR signaling pathway. (A) Western blots analysis of Akt/mTOR signaling in LINC01554-transfected cells, knockout cells and their controls, including Akt, phospho-Akt (Ser473), mTOR, phospho-mTOR (Ser2448) and phospho-p70 S6 kinase (Ser371). Vector, empty vector-transfected cells; LINC01554, LINC01554-transfected cells; WT, wild-type cells; KO, LINC01554-knockout cells. Cell growth assay (B) and foci formation assay (C) of LINC01554-transfected and -knockout cells after treatment with varying concentrations of MK2206. Error bars represent SD in triplicate experiments (*, P < 0.05; **, P < 0.01; ***, P < 0.001 in independent Student's t test). (D) Representative western blot analysis of Akt/mTOR signaling pathway, including Akt, phospho-Akt (Ser473), mTOR, phospho-mTOR (Ser2448) in LINC01554-transfected and -knockout cells that were treated with increasing concentrations of MK2206 for 24 h. β-actin served as loading control. (E) Representative images of nude mice bearing tumors derived from LINC01554-transfected cells after treatment with 100 mg/kg MK2206 and 30% captisol in saline (control) by gavage for 2 weeks. Tumor sizes in nude mice separately bearing xenograft tumors of BEL7402 and QGY7701 LINC01554-transfected cells were quantified. The average tumor size was expressed as the mean standard deviation of 6 mice (*, P < 0.05 in independent Student's t test). (F) Akt and mTOR signaling in indicated xenograft tumors were analyzed by western blotting. (G) A graphic illustration of the tumor-suppressive role of LINC01554 in HCC. In HCC cells, LINC01554 is downregulated by high expression of miR-365a, resulting in attenuating the ubiquitin-mediated degradation of PKM2 and inhibitory effect on Akt/mTOR signaling pathway, subsequently enhancing aerobic glycolytic level and eventually promoting proliferation of HCC cells.
Extensive evidence in previous studies has illustrated the interaction between lncRNA and miRNA could act in the noncanonical function model [26, 38-39]. In the present study, we found miR-365a-3p could directly bind to LINC01554 and subsequently downregulate its expression level. miR-365a has been reported to serve as an oncogene that promoting tumor growth and metastasis in laryngeal squamous cell carcinoma [40]. Here, we also found miR-365a-3p was upregulated in HCC cell lines and clinical samples, which was significantly associated with decreased LINC01554 expression. Furthermore, our results prove that miR-365a-3p directly targeted 3'-UTR of LINC01554 to inhibit LINC01554 expression at transcriptional level. These findings suggest that the high expression of miR-365a accounts for downregulation of LINC01554 in HCC.
Functions of long noncoding RNAs are closely related to their subcellular localization [29]. Subcellular fractionation assay and RNA FISH showed that LINC01554 mainly accumulated in the cytoplasm, suggesting that LINC01554 might interact with cytoplasmic proteins. RNA immunoprecipitation was conducted and a series of glycolytic enzymes were validated. PKM2, one protein pulled down by LINC01554, drew our interest. PKM2 is a speed-limited enzyme at the late stage of glycolysis. It has been widely related to many human cancers [41-42]. Our further study found that LINC01554 negatively regulated PKM2 through ubiquitin-mediated degradation. However, whether LINC01554 promotes ubiquitination of PKM2 directly by shifting its conformational structure resulting in exposure of recognition domain to ubiquitin-proteins, or just serves as the scaffold to provide a platform for interaction between PKM2 and certain proteins remains to be further investigated.
Functional assays in vitro and in vivo revealed that LINC01554 exerted tumor-suppressive function and impeded aerobic glycolysis. Enhanced aerobic glycolysis is a metabolic phenomenon of rapid proliferating cells, including cancer cells. PI3K/Akt/ mTOR pathway is one of the central signaling pathways to coordinate aerobic glycolytic and cellular biosynthesis in malignant cells [35]. Our finding unraveled that LINC01554 could restrain Akt/mTOR signaling pathway to strengthen the inhibitory effect on aerobic glycolytic in HCC cells, ultimately abolishing the cell growth advantages. An Akt inhibitor, MK2206, was used to validate the inhibitory role of LINC01554 on Akt/mTOR. MK2206 is an oral allosteric inhibitor of pan-Akt, which is able to block the autophosphorylation of threonine 308 and serine 473 domains of target proteins. Currently, it has been reported to be in the phase II clinical trials of many solid tumors, including non-small-cell and small cell lung carcinoma (NCT01306045), colon and rectal cancer (NCT01802320), breast carcinoma (NCT01776008) and hepatocellular carcinoma (NCT01239355). In line with our hypothesis, the inhibitory effect of MK2206 on cell growth, and phosphorylation of Akt and mTOR were attenuated in LINC01554-KO cells. Conversely, the cell proliferation, and phosphorylation of Akt and mTOR were significantly suppressed by MK2206 in LINC01554-transfected cells. Most importantly, in vivo functional assay suggests that patients with high expression of LINC01554 might achieve better therapeutic effects from the Akt inhibitor MK2206.
In summary, our findings first define LINC01554 as a tumor suppressor in hepatocellular carcinoma and it might serve as potential prognostic biomarker for HCC patients. LINC01554 downregulation empowers cancer cells acquiring high aerobic glycolysis to sustain cells growth advantages, through regulating PKM2 and Akt/mTOR signaling pathway (Figure 4G). Last but not least, nude mice bearing tumors derived from LINC01554-transfected cells benefit more from oral administration of Akt inhibitor MK2206, which strongly recommends that LINC01554 may provide rationale for precision therapy of MK2206 in HCC patients.
Abbreviations
ADP: adenosine diphosphate; ATP: adenosine triphosphate; ATP5A1: ATP synthase alpha 1; CUDR: cancer upregulated drug resistant; CHX: cycloheximide; FISH: fluorescence in situ hybridization; GEPIA: gene expression profiling interactive analysis; G6PD: glucose-6-phosphate dehydrogenase; HCC: hepatocellular carcinoma; HOTAIR: HOX transcript antisense RNA; LncRNA: long noncoding RNA; LINC01554: long intergenic noncoding RNA 01554; lncRNA-ATB: lncRNA activated by tumor growth factor-beta; LET: low expression in tumor; MALAT1: metastasis associated lung adenocarcinoma transcript 1; mTOR: mechanistic target of rapamycin; miR-365a: microRNA 365a; NEAT1: nuclear paraspeckle assembly transcript 1; NAFLD: fibrosis of non-alcoholic fatty liver disease; PEP: phosphoenolpyruvate; PKM2: pyruvate kinase isoform muscle 2; PKM1: pyruvate kinase isoform muscle 1; PKL: pyruvate kinase isoform liver; PKR: pyruvate kinase isoform red blood cell; PET/CT: positron emission tomography- computed tomography; PGK1: phosphoglycerate kinase1; PHGDH: phosphoglycerate dehydrogenase; qRT-PCR: quantitative reverse transcription polymerase chain reaction; RIP: RNA immunoprecipitation; sgRNA: single guide RNA; TCGA: the cancer genome atlas; XIST: X inactive specific transcript.
Supplementary Material
Supplementary figures and tables.
Acknowledgements
This study was supported by grants from the National Key R&D Program of China (2017YFC1309000), National Science and Technology Major Project of China (2018ZX10723204-006-005), the National Natural Science Foundation of China (81672357, 81772554, 81472255 and 81472250), the Shenzhen Peacock Team Project (KQTD 2015033117210153), Hong Kong RGC Theme-based Research Scheme fund (T12-704/16-R), RGC Collaborative Research Funds (C7038-14G), RGC GRF (17143716), and the Sun Yat-sen University Major Development Program (16ykjc34). XY Guan is Sophie YM Chan Professor in Cancer Research.
Author's Contributions
Y.L.Z. and L. L. contributed equally to conception and design, acquisition, analysis and interpretation of data and drafting the article. Y.X.J., B.Z.Z., J.C. L. participated in experiment of RNA immunoprecipitation, mass spectrometry and RNA FISH, respectively. J.Z. H. analyzed the expression status of LINC01554 in HCC through TCGA database. Y.H. Z., M.Q.L., T.T. Z., X.J. B. contributed to cell culture. Y.F.Y. provided human HCC tumors and nontumor tissues. X.Y. G. and Y. L. contributed equally to conception, design and supervise the research, and give final approval of the version to be submitted and any revised version.
Competing Interests
The authors have declared that no competing interest exists.
References
1. Choo SP, Tan WL, Goh BK. et al. Comparison of hepatocellular carcinoma in Eastern versus Western populations. Cancer. 2016
2. Torre LA, Bray F, Siegel RL. et al. Global cancer statistics, 2012. CA Cancer J Clin. 2015;65:87-108
3. Tay Y, Rinn J, Pandolfi PP. The multilayered complexity of ceRNA crosstalk and competition. Nature. 2014;505:344-52
4. Wang KC, Chang HY. Molecular mechanisms of long noncoding RNAs. Mol Cell. 2011;43:904-14
5. Gupta RA, Shah N, Wang KC. et al. Long non-coding RNA HOTAIR reprograms chromatin state to promote cancer metastasis. Nature. 2010;464:1071-76
6. Gutschner T, Hammerle M, Eissmann M. et al. The noncoding RNA MALAT1 is a critical regulator of the metastasis phenotype of lung cancer cells. Cancer Res. 2013;73:1180-89
7. Yildirim E, Kirby JE, Brown DE. et al. Xist RNA is a potent suppressor of hematologic cancer in mice. Cell. 2013;152:727-42
8. Cabili MN, Trapnell C, Goff L. et al. Integrative annotation of human large intergenic noncoding RNAs reveals global properties and specific subclasses. Genes Dev. 2011;25:1915-27
9. Mercer TR, Dinger ME, Mattick JS. Long non-coding RNAs: insights into functions. Nat Rev Genet. 2009;10:155-9
10. Song J, Wu X, Liu F. et al. Long non-coding RNA PVT1 promotes glycolysis and tumor progression by regulating miR-497/HK2 axis in osteosarcoma. Biochem Biophys Res Commun. 2017;490:217-24
11. Liu X, Gan B. lncRNA NBR2 modulates cancer cell sensitivity to phenformin through GLUT1. Cell Cycle. 2016;15:3471-81
12. Chen L, Li Y, Lin CH. et al. Recoding RNA editing of AZIN1 predisposes to hepatocellular carcinoma. Nat Med. 2013;19:209-16
13. Tang Z, Li C, Kang B. et al. GEPIA: a web server for cancer and normal gene expression profiling and interactive analyses. Nucleic acids research. 2017;45:W98-W102
14. Gatenby RA, Gillies RJ. Why do cancers have high aerobic glycolysis? Nature reviews Cancer. 2004;4:891-9
15. Lunt SY, Muralidhar V, Hosios AM. et al. Pyruvate kinase isoform expression alters nucleotide synthesis to impact cell proliferation. Mol Cell. 2015;57:95-107
16. David CJ, Chen M, Assanah M. et al. HnRNP proteins controlled by c-Myc deregulate pyruvate kinase mRNA splicing in cancer. Nature. 2010;463:364-8
17. Yang F, Huo XS, Yuan SX. et al. Repression of the long noncoding RNA-LET by histone deacetylase 3 contributes to hypoxia-mediated metastasis. Mol Cell. 2013;49:1083-96
18. Yang F, Zhang H, Mei Y. et al. Reciprocal regulation of HIF-1alpha and lincRNA-p21 modulates the Warburg effect. Mol Cell. 2014;53:88-100
19. Volders PJ, Verheggen K, Menschaert G. et al. An update on LNCipedia: a database for annotated human lncRNA sequences. Nucleic acids research. 2015;43:D174-80
20. Ma NF, Hu L, Fung JM. et al. Isolation and characterization of a novel oncogene, amplified in liver cancer 1, within a commonly amplified region at 1q21 in hepatocellular carcinoma. Hepatology. 2008;47:503-10
21. Song Y, Li J, Zhu Y. et al. MicroRNA-9 promotes tumor metastasis via repressing E-cadherin in esophageal squamous cell carcinoma. Oncotarget. 2014;5:11669-80
22. Ewald F, Grabinski N, Grottke A. et al. Combined targeting of AKT and mTOR using MK-2206 and RAD001 is synergistic in the treatment of cholangiocarcinoma. Int J Cancer. 2013;133:2065-76
23. Chen J, Lan T, Zhang W. et al. Platelet-activating factor receptor-mediated PI3K/AKT activation contributes to the malignant development of esophageal squamous cell carcinoma. Oncogene. 2015;34:5114-27
24. Lee JS, Chu IS, Mikaelyan A. et al. Application of comparative functional genomics to identify best-fit mouse models to study human cancer. Nat Genet. 2004;36:1306-11
25. Llovet JM, Pena CE, Lathia CD. et al. Plasma biomarkers as predictors of outcome in patients with advanced hepatocellular carcinoma. Clin Cancer Res. 2012;18:2290-2300
26. Paraskevopoulou MD, Georgakilas G, Kostoulas N. et al. Experimentally verified and computationally predicted microRNA targets on long non-coding RNAs. Nucleic Acids Res. 2013;41:D239-45
27. Chen X, Liang H, Zhang CY. et al. miRNA regulates noncoding RNA: a noncanonical function model. Trends Biochem Sci. 2012;37:457-9
28. Quinn JJ, Chang HY. Unique features of long non-coding RNA biogenesis and function. Nat Rev Genet. 2016;17:47-62
29. Chen LL. Linking Long Noncoding RNA Localization and Function. Trends Biochem Sci. 2016;41:761-72
30. Lunt SY, Vander Heiden MG. Aerobic glycolysis: meeting the metabolic requirements of cell proliferation. Annu Rev Cell Dev Biol. 2011;27:441-64
31. Hay N. Reprogramming glucose metabolism in cancer: can it be exploited for cancer therapy? Nat Rev Cancer. 2016;16:635-49
32. Sun Q, Chen X, Ma J. et al. Mammalian target of rapamycin up-regulation of pyruvate kinase isoenzyme type M2 is critical for aerobic glycolysis and tumor growth. PNAS. 2011;108:4129-34
33. Wang J, Maldonado MA. The ubiquitin-proteasome system and its role in inflammatory and autoimmune diseases. Cell Mol Immunol. 2006;3:255-61
34. Okamura Y, Aoki Y, Obayashi T. et al. COXPRESdb in 2015: coexpression database for animal species by DNA-microarray and RNAseq-based expression data with multiple quality assessment systems. Nucleic acids research. 2015;43:D82-6
35. DeBerardinis RJ, Lum JJ, Hatzivassiliou G. et al. The biology of cancer: metabolic reprogramming fuels cell growth and proliferation. Cell Metab. 2008;7:11-20
36. Ryaboshapkina M, Hammar M. Human hepatic gene expression signature of non-alcoholic fatty liver disease progression, a meta-analysis. Sci Rep. 2017;7:12361
37. Fan Q, Liu B. Identification of a RNA-Seq Based 8-Long Non-Coding RNA Signature Predicting Survival in Esophageal Cancer. Med Sci Monit. 2016;22:5163-72
38. Cao C, Sun J, Zhang D. et al. The long intergenic noncoding RNA UFC1, a target of MicroRNA 34a, interacts with the mRNA stabilizing protein HuR to increase levels of beta-catenin in HCC cells. Gastroenterology. 2015;148:415-26
39. Zheng J, Huang X, Tan W. et al. Pancreatic cancer risk variant in LINC00673 creates a miR-1231 binding site and interferes with PTPN11 degradation. Nat Genet. 2016;48:747-57
40. Geng J, Liu Y, Jin Y. et al. MicroRNA-365a-3p promotes tumor growth and metastasis in laryngeal squamous cell carcinoma. Oncol Rep. 2016;35:2017-26
41. Jiang Y, Li X, Yang W. et al. PKM2 regulates chromosome segregation and mitosis progression of tumor cells. Mol Cell. 2014;53:75-87
42. Jiang Y, Wang Y, Wang T. et al. PKM2 phosphorylates MLC2 and regulates cytokinesis of tumour cells. Nat Commun. 2014;5:5566
Author contact
![]() Corresponding authors: Xin-Yuan Guan or Yan Li, State Key Laboratory of Oncology in South China, Collaborative Innovation Center for Cancer Medicine, Sun Yat-Sen University Cancer Center, Guangzhou 510062, China. Tel: 86-20-87343166; Fax: 86-20-87343170; Email: xyguanhk (Xin-Yuan Guan); Email: liyanorg.cn (Yan Li).
Corresponding authors: Xin-Yuan Guan or Yan Li, State Key Laboratory of Oncology in South China, Collaborative Innovation Center for Cancer Medicine, Sun Yat-Sen University Cancer Center, Guangzhou 510062, China. Tel: 86-20-87343166; Fax: 86-20-87343170; Email: xyguanhk (Xin-Yuan Guan); Email: liyanorg.cn (Yan Li).
Citation styles
APA
Zheng, Y.L., Li, L., Jia, Y.X., Zhang, B.Z., Li, J.C., Zhu, Y.H., Li, M.Q., He, J.Z., Zeng, T.T., Ban, X.J., Yuan, Y.F., Li, Y., Guan, X.Y. (2019). LINC01554-Mediated Glucose Metabolism Reprogramming Suppresses Tumorigenicity in Hepatocellular Carcinoma via Downregulating PKM2 Expression and Inhibiting Akt/mTOR Signaling Pathway. Theranostics, 9(3), 796-810. https://doi.org/10.7150/thno.28992.
ACS
Zheng, Y.L.; Li, L.; Jia, Y.X.; Zhang, B.Z.; Li, J.C.; Zhu, Y.H.; Li, M.Q.; He, J.Z.; Zeng, T.T.; Ban, X.J.; Yuan, Y.F.; Li, Y.; Guan, X.Y. LINC01554-Mediated Glucose Metabolism Reprogramming Suppresses Tumorigenicity in Hepatocellular Carcinoma via Downregulating PKM2 Expression and Inhibiting Akt/mTOR Signaling Pathway. Theranostics 2019, 9 (3), 796-810. DOI: 10.7150/thno.28992.
NLM
Zheng YL, Li L, Jia YX, Zhang BZ, Li JC, Zhu YH, Li MQ, He JZ, Zeng TT, Ban XJ, Yuan YF, Li Y, Guan XY. LINC01554-Mediated Glucose Metabolism Reprogramming Suppresses Tumorigenicity in Hepatocellular Carcinoma via Downregulating PKM2 Expression and Inhibiting Akt/mTOR Signaling Pathway. Theranostics 2019; 9(3):796-810. doi:10.7150/thno.28992. https://www.thno.org/v09p0796.htm
CSE
Zheng YL, Li L, Jia YX, Zhang BZ, Li JC, Zhu YH, Li MQ, He JZ, Zeng TT, Ban XJ, Yuan YF, Li Y, Guan XY. 2019. LINC01554-Mediated Glucose Metabolism Reprogramming Suppresses Tumorigenicity in Hepatocellular Carcinoma via Downregulating PKM2 Expression and Inhibiting Akt/mTOR Signaling Pathway. Theranostics. 9(3):796-810.
This is an open access article distributed under the terms of the Creative Commons Attribution (CC BY-NC) license (https://creativecommons.org/licenses/by-nc/4.0/). See http://ivyspring.com/terms for full terms and conditions.