Theranostics
13.3
Impact Factor
- Current Issue
- Advance Articles
- Volume 16; 2026
- Volume 15; 2025
- Volume 14; 2024
- Volume 13; 2023
- Volume 12; 2022
- Archive
- Cover Images
- Cover Suggestion
- Special Issues
Top
Introduction
Methods
Results
Discussion
Abbreviations
Supplementary Material
Acknowledgements
References
Introduction
Methods
Results
Discussion
Abbreviations
Supplementary Material
Acknowledgements
References
International Journal of Biological Sciences
International Journal of Medical Sciences
 Global reach, higher impact

Theranostics 2019; 9(1):232-245. doi:10.7150/thno.28447 This issue Cite
Research Paper
Artificial intelligence-based decision-making for age-related macular degeneration
De-Kuang Hwang1,2,3*, Chih-Chien Hsu1,2,3*, Kao-Jung Chang3*, Daniel Chao4, Chuan-Hu Sun5, Ying-Chun Jheng5,6, Aliaksandr A. Yarmishyn5, Jau-Ching Wu3,14, Ching-Yao Tsai3,7, Mong-Lien Wang3,5,8, Chi-Hsien Peng9, Ke-Hung Chien10,11, Chung-Lan Kao2,3,12, Tai-Chi Lin1,2,3, Lin-Chung Woung3,7, Shih-Jen Chen1,3 ![]() , Shih-Hwa Chiou1,2,3,5,12,13
, Shih-Hwa Chiou1,2,3,5,12,13
1. Department of Ophthalmology, Taipei Veterans General Hospital, Taipei, Taiwan
2. Institute of Clinical Medicine, National Yang-Ming University, Taipei, Taiwan
3. School of Medicine, National Yang-Ming University, Taipei, Taiwan
4. Clinical Ophthalmology, Shiley Eye Institute, University of California, San Diego, USA
5. Department of Medical Research, Taipei Veterans General Hospital, Taipei, Taiwan
6. Department of Physical Therapy and Assistive Technology, National Yang-Ming University, Taipei, Taiwan
7. Department of Ophthalmology, Taipei City Hospital, Taipei, Taiwan
8. Institute of Environmental Health, National Yang-Ming University, Taipei, Taiwan
9. Department of Ophthalmology, Shin Kong Wu Ho-Su Memorial Hospital & Fu-Jen Catholic University, Taipei Taiwan
10. Department of Ophthalmology, Tri-Service General Hospital & National Defense Medical Center, Taipei, Taiwan
11. Institute of Pharmacology, National Yang-Ming University, Taipei, Taiwan
12. Department of Physical Medicine and Rehabilitation, Taipei Veterans General Hospital
13. Genomic Research Center, Academia Sinica, Taipei, Taiwan.
14. Department of Neurosurgery, Neurological Institute, Taipei Veterans General Hospital, Taipei, Taiwan
*Equal contributions (co-first)
Received 2018-7-11; Accepted 2018-10-25; Published 2019-1-1
Citation:
Hwang DK, Hsu CC, Chang KJ, Chao D, Sun CH, Jheng YC, Yarmishyn AA, Wu JC, Tsai CY, Wang ML, Peng CH, Chien KH, Kao CL, Lin TC, Woung LC, Chen SJ, Chiou SH. Artificial intelligence-based decision-making for age-related macular degeneration. Theranostics 2019; 9(1):232-245. doi:10.7150/thno.28447. https://www.thno.org/v09p0232.htm
Other stylesAbstract

Artificial intelligence (AI) based on convolutional neural networks (CNNs) has a great potential to enhance medical workflow and improve health care quality. Of particular interest is practical implementation of such AI-based software as a cloud-based tool aimed for telemedicine, the practice of providing medical care from a distance using electronic interfaces.
Methods: In this study, we used a dataset of labeled 35,900 optical coherence tomography (OCT) images obtained from age-related macular degeneration (AMD) patients and used them to train three types of CNNs to perform AMD diagnosis.
Results: Here, we present an AI- and cloud-based telemedicine interaction tool for diagnosis and proposed treatment of AMD. Through deep learning process based on the analysis of preprocessed optical coherence tomography (OCT) imaging data, our AI-based system achieved the same image discrimination rate as that of retinal specialists in our hospital. The AI platform's detection accuracy was generally higher than 90% and was significantly superior (p < 0.001) to that of medical students (69.4% and 68.9%) and equal (p = 0.99) to that of retinal specialists (92.73% and 91.90%). Furthermore, it provided appropriate treatment recommendations comparable to those of retinal specialists.
Conclusions: We therefore developed a website for realistic cloud computing based on this AI platform, available at
Keywords: deep learning, convolutional neural network, artificial intelligence (AI), AI-based website, telemedicine, cloud website
Introduction
Artificial intelligence (AI) has proved to be applicable in multifarious fields, including medical tests and diagnostics. For instance, in microscopic examinations, AI can reliably predict certain fluorescent labels on transmitted light microscopy images of unlabeled, fixed, or live biological samples [1]. In ophthalmology, AI can correctly identify diseases as accurately as specialists [2]. Medical imaging provides vital clues for diagnosing doctors. Because of the development of graphics processing units (GPUs), nowadays AI can quickly review and classify substantial imaging data through a process called deep learning, which has been improved and optimized through methods such as a convolutional neural networks (CNNs) [2]. Kermany et al. developed an optical coherence tomography (OCT) imaging diagnostic tool based on a deep learning framework for screening patients with choroidal neovascularization (CNV), diabetic macular edema (DME), and drusen [2]. Several studies have used AI to detect individual disease manifestations, such as intraretinal fluid, drusen, or quantification of macular fluid, based on OCT imaging [3-5]. The first and only FDA-authorized AI system, IDx, designed to autonomously detect diabetic retinopathy, has been announced recently. Still, the extent to which AI can make correct medical assessments and recommendations remains controversial.
Telemedicine is defined as the practice of providing medical care from a distance using electronic interfaces [6]. Since the early 1990s, it has been used to overcome distance barriers and improve access to medical services unavailable in remote rural communities. Telemedicine-based care can occur between clinicians and patients, among clinicians, or between patients and surrogates (e.g., a coach, pharmacy technician, patient navigator, or interactive module or game). Patients and clinicians can engage in real-time virtual consultations through a stepwise (store-and-forward) process in which data are uploaded for review by a clinician prior to consultation or remote monitoring of a patient. For example, through the acquisition of non-mydriatic fundus photographs by non-ophthalmologists or primary care physicians, ophthalmologists can remotely diagnose patients with vision-threatening diabetic retinopathy [7]. The benefits of store-and-forward telemedicine comprise both the increase of information delivery between different specialists and hospitals, as well as prevention of omissions or loss of records. However, efficiently obtaining immediate diagnosis and treatment recommendations without increasing medical specialists' workload or procedural costs is a major problem. Cloud computing represents the fastest developing area in health care. Omnipresent on-demand access to virtually endless resources combined with a pay-per-use model offers a new method of delivering and using services. Cloud computing is commonly used in genomics, proteomics, and molecular medicine, but applications in other fields remain insufficient [8]. Whether established cloud-based telemedicine could be combined with AI technology to improve medical workflow remains unclear.
Age-related macular degeneration (AMD) mainly affects elderly people and accounts for 8.7% of all cases of blindness in the developed countries [9]. The global prevalence of AMD is 8.69%, being higher among Europeans than among Asians or Africans [9]. AMD is classified as either dry or wet AMD. Dry AMD is characterized by multiple drusen deposits and rarely affects vision. Dry AMD can progress not only to geographic atrophy but also to wet AMD, which is characterized by active CNV and leads to significant vision impairment. Intravitreal injection of anti-vascular endothelial growth factor (anti-VEGF) drugs is considered to be the optimal treatment for CNV. However, any improvement is accompanied by long-term monthly intravitreal injections and uncertainty concerning the treatment duration and possible recurrence of CNV [10]. Screening and early detection of active CNV are therefore crucial. This was demonstrated with the studies using ForeseeHome, a home-based visual field monitoring system, which showed earlier detection of CNV and improved visual outcomes compared to standard care [11]. In cost effective analysis, monitoring patients with CNV in one eye is a cost-saving measure, but for patients with low CNV risk it is generally not cost-effective [12]. OCT is a noninvasive, noncontact diagnostic technique that allows reliable detection of CNV activity and identification of pathological lesions of the retina and choroid [13]. However, with the increase of the aging population worldwide, the number of patients with AMD is expected to grow, thus requiring efficient disease management based on OCT imaging analysis in clinical practice. To achieve this aim, an AI-based cloud service that can correctly diagnose and recommend medical treatment and enable patients or clinicians to upload patient data and immediately obtain information promises to be efficient, convenient, and inexpensive. In this study, we aimed to develop such cloud computing tool specifically for diagnosing and managing AMD (Figure 1). By combining the concepts of AI and cloud computing, this platform can open new opportunities for telemedicine. In contrast to Kermany et al., who used only InceptionV3 model to identify CNV, DME, and drusen by inputting OCT image data [2], we trained three CNN models (VGG16, InceptionV3, and ResNet50) to identify normal macula and three types of AMD: dry AMD (drusen), inactive wet AMD, and active wet AMD. We provided not only theoretical proof of AI's ability, but also developed a website for a cloud service based on this AI platform, available at https://www.ym.edu.tw/~AI-OCT/. Regardless of physical location, connected patients or clinicians can upload OCT images without preprocessing and immediately obtain information on AMD types and recommended treatment from this user-friendly AI- and cloud-based website.
Methods
AMD classification
In patients with dry type AMD, multiple drusen deposits can be found in the macula. In wet AMD, CNV is found beneath the macula and is comorbid with subretinal exudation or hemorrhage. Both drusen and CNV can be clearly identified on OCT scans. Vision is seldom affected by drusen in patients with dry AMD, whereas in those with wet AMD, active CNV often leads to severe vision impairment. Several examinations are used to clinically evaluate CNV activity, including indirect ophthalmoscopy, fundus photography, fundus fluorescence angiography (FAG), and OCT. Yellowish exudate and hemorrhage can be detected through indirect ophthalmoscopy and fundus photography, and late-phase hyperfluorescent lesions with leakage can be observed through FAG. FAG remains the gold standard for initial diagnosis of CNV, but studies have revealed that OCT results are sensitive in differentiating CNV activity and thus were used in previous clinical trials to access the need of retreatment of CNV (14). Signs indicating active CNV include subretinal fluid, intraretinal cysts or hyporeflective space, and subretinal hyperreflective exudate. When the CNV is inactive, subretinal fluid and intraretinal cysts disappear. In our study, we divided patients into normal, dry AMD, active wet AMD and inactive AMD—patients with different disease stages requiring different treatment strategies (Figure 1B).
Figure 1
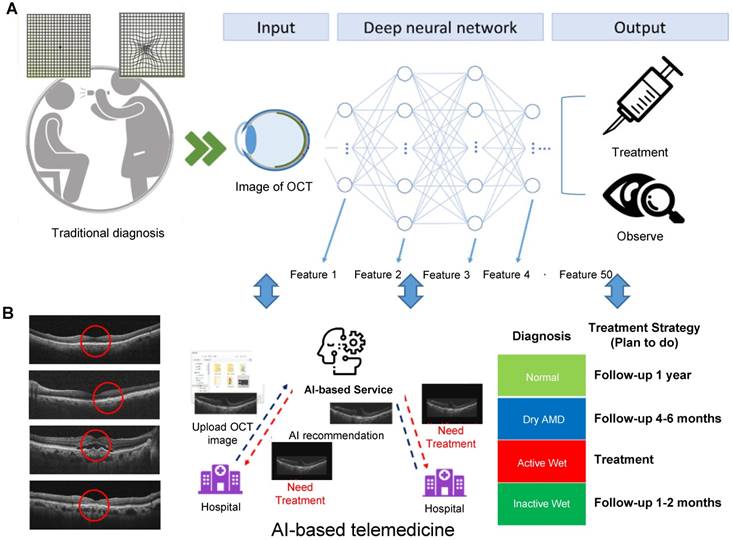
Approach to developing an AI-based cloud computing service for diagnosing AMD and providing medical guidance. (A) The main architecture of our AI model is a CNN consisting of many layers. Each layer extracts different OCT image features; subsequently, all of the extracted features are integrated. The AMD type is determined and a method of treatment is suggested. (B) Subsequently, a website for this new AI-based medical image diagnosis system was developed, where users can upload OCT images to the cloud. The AI software analyzes the images and, based on the results, indicates the AMD type and the action to be taken. Disease staging and treatment plans can be autogenerated simply by importing OCT scans.
Image collection and labeling
The initial OCT image data were collected from patients with AMD who sought medical help at the Department of Ophthalmology of Taipei Veterans General Hospital in Taipei, Taiwan, between January 1 and December 31, 2017. In addition, 174 normal controls were included. The study was approved by the hospital's Institutional Review Board and informed consent was obtained from patients and healthy control subjects. Two senior retina specialists were recruited to classify the OCT images into four categories and label the OCT image features, based on which the AI model was established. Normal, dry AMD (drusen), and wet AMD with active or inactive CNV were defined as types 1, 2, 3, and 4, respectively. Finally, experienced ophthalmologists verified all the data based on OCT, color fundus, and FAG images and clinical records, thereby confirming that the OCT image classification and labeling was consistent with the proper diagnosis (Figure 2).
Image pre-processing and model development
The initial OCT data were collected from three OCT devices of two types, Zeiss Cirrus HD-OCT 4000 and Optovue RTVue-XR Avanti, thus their formats and resolutions were different. We performed initial quality control, filtering out images with low resolution or improper format. The inclusion criteria were 3499 × 2329, 2474 × 2777, or 948 × 879 raw image formats. Subsequently, we performed data augmentation procedure by reversing all of the OCT images to obtain mirror images, thus doubling their total number. The mirror images would be different from the original images in the positions of features, such as optic nerve, shape, and location of subretinal lesions (e.g., drusen, RPED, or fluid). The augmented dataset was used only for training, but not for verification of AI models. We also normalized the images by changing their sizes and resolutions before using them to develop the AI model (Figure 2). By establishing the same standard for all images, the normalization process resulted in improved training efficiency. The equation for altered resolution is P′i = (Pi - Pmean) / Pstd. For each OCT image, Pi denotes each pixel, Pmean and Pstd are the mean and standard deviation, respectively, of all pixels, and P′i is the resulting altered pixel.
Figure 2
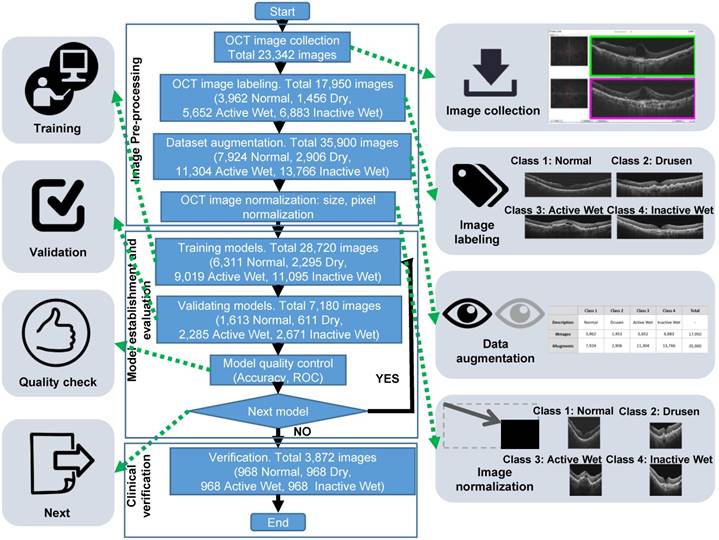
Workflow diagram demonstrating the process and different stages of preparation of the OCT image dataset and training CNN models. The three major stages were image preparation (top box), which included the consecutive steps of image collection, labeling by four classes, dataset augmentation by horizontal flipping, and image cropping and normalization; CNN training (middle box) performed with randomly selected 80% of the image dataset (28,720 images), with the remaining 20% (7,180) used for validation aimed to evaluate whether the models required further modification and retraining. The final stage (bottom box), was verification of the best model from the training stage performed using an independent set of 3,872 images.
After image processing, the database images were divided into two groups: 80% of the images formed a training group, and the remaining images formed a validation group. The OCT images in the training and validation groups were used to establish and validate the models, respectively. The AI models had different CNN architectures, namely, ResNet50, InceptionV3, and VGG16; these have already been widely used in image recognition, with demonstrated efficiency. These architectures include hyperparameters such as batch size, epoch, learning rate, and optimizer that can be adjusted to enhance recognition accuracy. The training results of the AI models were evaluated using data from the validation group. Moreover, the AI models were established using a QNAP TS-1685 Linux-based server with an Intel Xeon CPU, an NVIDIA QUADRO GP100 16 GB GPU card, and 64 GB available RAM for training and validation.
Verification of final AI models and comparison between reviewers and AI
The top three models were used for verification with all four condition types: normal, dry (drusen), active and inactive wet AMD. For verifying the established AI models, we randomly selected 3,872 (968 of each type) qualified OCT images from 100 AMD patients and 100 non-AMD controls who visited and were treated in our hospital before 2017. For 18 AMD patients, the sequences of 10 OCT images were taken at different time points for analyzing the ability of the AI model to track the disease activity longitudinally. None of the images from this verification dataset were used for CNN training. We used not only our own OCT images, but also other clinical images used by Kermany et al [2]. Moreover, four reviewers were recruited to compare the AI models and clinical reviewers for performance. Reviewers 1 and 2 were qualified retinal specialists in our hospital, and reviewers 3 and 4 were medical students. Our verification data included 3,872 images divided equally into four categories, with each category containing 968 images. The other 750 clinical OCT images from Kermany et al. [2] were divided into only three categories (normal, wet, dry), each category containing 250 images.
Statistical analysis
A confusion matrix was used to present the results of clinical verification and compare the predictions of the AI models with ophthalmologists' prediction of each category. The confusion matrix visualized AI model performance, comprising four combinations of prediction and ground truth (label): true positive (TP), false positive (FP), false negative (FN), and true negative (TN). P and N represented the prediction, and T and F indicated whether it was correct. For example, in a normal OCT image category, TP meant that the AI model provided a correct prediction for OCT images with the normal label, FP meant that it misjudged the image as belonging to some other category, FN meant that it incorrectly predicted an image from the normal category, and TN meant that its prediction was correct for OCT images without the normal label. AI model performance was indicated by three major outcomes, namely, accuracy, specificity, and sensitivity, which were measured according to the confusion matrix by using the following equations:
Accuracy = (TP + TN) / (TP + FP + TN + FN)
Specificity = TN / (FP + TN)
Sensitivity = TP / (TP + FN)
A receiver operating characteristic (ROC) curve was applied to represent AI model performance, with its X and Y axes defined as the false positive rate (FPR) and true positive rate (TPR), respectively, and a value between 0 and 1. The TPR resulted from the sensitivity equation, whereas the FPR was measured by subtracting the specificity value from 1. The closer the ROC curve was to the upper left corner, the more satisfactorily the AI model performed. The area under the curve (AUC) of ROC was also used to assess AI model performance, with the AUC value being between 0.5 and 1; the higher the value, the more correct the AI model's predictions.
Results
Preparation of OCT image dataset and training CNN models
To train CNN models for differentiation of OCT images of normal and AMD-affected retinas, we used the approach outlined in Figure 2. Initially, we collected 23,342 clinical OCT images from 583 patients with AMD and 174 nonpatients. After image quality control, 17,950 images were selected for further CNN training, among which 3,962 had been labeled by clinicians as normal, 1,453 as dry AMD, 5,652 as active wet AMD, and 6,883 as inactive wet AMD. To improve deep learning efficiency, this dataset was augmented by flipping each image from left to right, thus doubling the total number of images to 35,900. Moreover, all images were adjusted to the same size and resolution. They were subsequently randomly divided into two groups, with 80% (28,720 images) used as a training set, and 20% (7,180 images) used as a validation set. Three CNN architectures (ResNet50, InceptionV3, and VGG16) were tested using the training dataset, and the performance of different models based on these three types was verified using the validation dataset. The top-performing ResNet50, InceptionV3, and VGG16 models were further verified using an independent set of 3,872 OCT images, with 968 images in each category. Furthermore, the OCT images employed by Kermany et al. [2] were also obtained and used to verify the established models.
Establishing AI models
After testing several models, ResNet50, VGG16, and InceptionV3 were used to establish CNN-based AI models. In the case of ResNet50, for example, the CNN architecture comprised several layers: convolution layers, max pooling layers, and a fully connected layer, as shown in Figure 3 and Figure S1. The function of the convolution layers was to extract the image features used to differentiate image classes. First, the AI model transformed the OCT image into an RGB image to execute transfer learning. The extracted features were presented as a grayscale diagram. The max pooling layer filtered the features and reduced the feature map dimensionality for computational efficiency. Finally, the fully connected layer integrated all the filtered features and performed image recognition.
As shown in Figure 3C, multiple features were extracted using the ResNet50 CNN model. While the features in the top layers were mostly general, less specific shapes, in the bottom layers they were more essential and specific. The grayscale diagram was subsequently transferred to a heat map, representing what the AI model designated as significant regions; the redder the region, the more significant the AI model deemed it. After adjustment of parameters, our results showed that VGG16, InceptionV3, and ResNet50 all exhibited high accuracy during verification. Several hundred models were tested to identify the optimal performance and define optimum parameters, as shown in Figure S2. Layers were trained through stochastic gradient descent in batches of 64 images per step, using an Adam Optimizer with a learning rate of 0.001. Training for all categories was run for 100 epochs and the best models with the minimal value of loss (corresponding to 91th, 88th, and 65th epochs for VGG16, InceptionV3 and ResNet50, respectively) were selected and used for the verification (Figure S2).
Figure 3
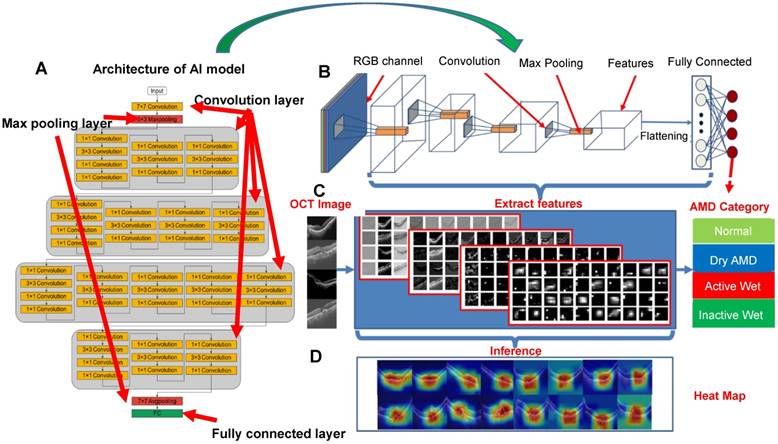
Evaluation of CNN model performance, using ResNet50 as an example. (A-B) Architecture of ResNet50 consisting of convolution layers, max pooling layers and a fully connected layer (output layer). (C) Image features extracted from convolution layers at different depths. (D) Representative heat maps demonstrating discriminative image regions, that is, regions with the highest feature density.
Verification of the final model
For verifying the established AI models, we randomly selected 3,872 (968 of each type) qualified OCT images from 100 AMD patients and 100 non-AMD controls who visited and were treated in our hospital before 2017. The confusion matrices shown in Figure 4A represent AI model performance in diagnosing all four AMD types. The accuracies of the VGG16, InceptionV3, and ResNet50 AI models were 91.40% (3539/3872), 92.67% (3588/3872), and 90.73% (3513/3872), respectively (Table 1). The receiver operating characteristic (ROC) curves and area under curves (AUC) of different CNN models are shown in Figure 4B. The AUCs of the VGG16, InceptionV3, and ResNet50 models were 0.983, 0.978, and 0.987, respectively. All CNN models demonstrated high sensitivity (>99%) for the normal retina (Table 1). Similarly, inactive wet type AMD was also identified with very few false positives (>96% sensitivity, Table 1). On the other hand, dry type AMD (drusen) and active wet AMD were relatively frequently false positively classified as inactive wet, i.e., our AI models had the lowest specificity for the latter class (Figure 4A and Table 1). After checking several misclassified images and feature density heatmaps carefully, we found that the AI sometimes misclassified the active wet AMD as inactive if subretinal fluid was shallow or located at the periphery (Figure 4C). Also, the AI usually misclassified dry AMD (drusen) as inactive wet AMD if the drusenoid RPE detachment was large or confluent (Figure 4C). In relatively rare cases, the AI misclassified inactive wet AMD as active wet AMD if the neovascular scar was big and the reflective signal of OCT was irregular (Figure 4C).
Figure 4
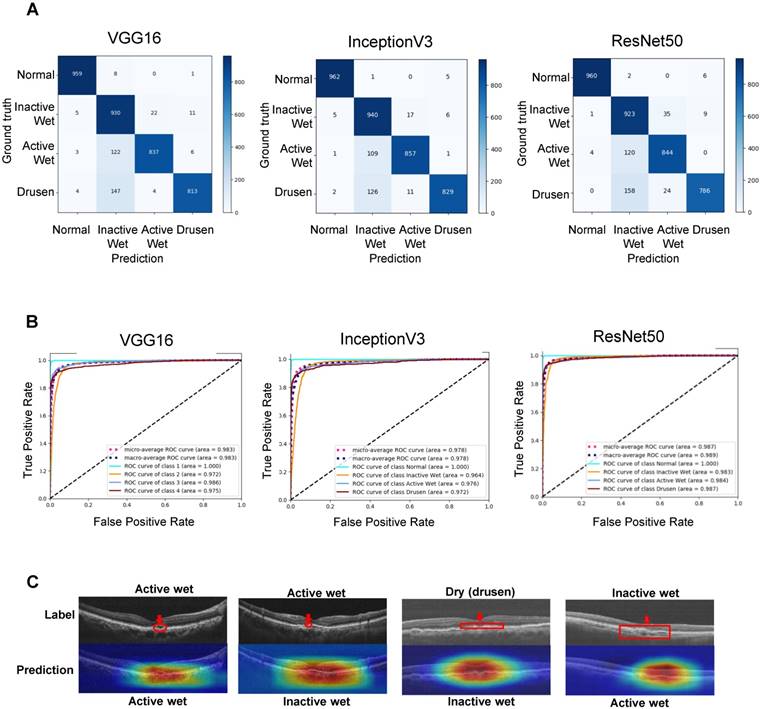
Verification of the performance of the final CNN models. (A) Confusion matrices demonstrating the prediction accuracies of the three CNN models. (B) Receiver operating characteristic (ROC) curves demonstrating the accuracies of prediction of AMD types. Areas under the macroaverage ROC curves are almost equal to those of the microaverage ROC curves of three CNN models, indicating a balanced testing set. The ROC coverage area for each disease subtype is also shown. (C) OCT images and feature heatmaps demonstrating some cases of misclassification. An image of correctly classified active wet AMD is shown on the left for reference. The areas containing misclassified features are marked in red.
Since we applied an approach of augmentation of training dataset by horizontal flipping of OCT images, we also tested the CNN model performance when they were trained with an unaugmented dataset of original 17,950 images. The verification showed that the accuracies of such models were marginally lower than when using the augmented training dataset (90.47% vs. 91.4%, 92.67% vs. 90.73, 90.24% vs. 90.73% for VGG16, ResNet50 and InceptionV3, respectively) (Figure S3 and Table S1). Moreover, for the classes that were more frequently misclassified as false positives (dry and active wet), there was an even more drastic decrease in sensitivity when training with the unaugmented dataset. For example, the sensitivities for dry AMD were 83.99% (VGG16), 85.64% (InceptionV3), and 81.20% (ResNet50) when these CNNs were trained with the augmented dataset (Table 1), and 81.30% (VGG16), 80.37% (InceptionV3), and 78.41% (ResNet50) when trained with the unaugmented dataset (Table S1). In light of this, we used CNNs trained with the augmented dataset for other experiments and development of the cloud-based software.
Table 1
Verification summary of three AI models performance using our hospital's dataset showing the parameters of accuracy (the percentage of true positives and true negatives of all classes among total number of verification images), sensitivity for each class (percentage of true positives among all positives) and specificity for each class (percentage of true negatives among all negatives).
| VGG16 | InceptionV3 | ResNet50 | |
|---|---|---|---|
| Accuracy | 91.40% | 92.67% | 90.73% |
| Sensitivity (normal) | 99.07% | 99.38% | 99.17% |
| Sensitivity (dry AMD) | 83.99% | 85.64% | 81.20% |
| Sensitivity (inactive wet AMD) | 96.07% | 97.11% | 95.35% |
| Sensitivity (active wet AMD) | 86.47% | 88.53% | 87.19% |
| Specificity (normal) | 99.54% | 99.70% | 99.80% |
| Specificity (dry AMD) | 99.34% | 99.57% | 99.45% |
| Specificity (inactive wet AMD) | 90.40% | 91.82% | 90.24% |
| Specificity (active wet AMD) | 99.05% | 98.99% | 97.84% |
Furthermore, we also used the OCT images employed by Kermany et al. [2] to verify the accuracy of our AI models. All three CNN-based AI models performed with high accuracy (>90%) when these images were used for verification (Table 2). Consistent with the verification results from our dataset, all models had high sensitivity to normal retinas and lower sensitivity to dry AMD (Table 2).
Table 2
Verification summary of three AI models performance using the dataset previously analyzed by Kermany et al. [2]. Shown are the parameters of accuracy (the percentage of true positives and true negatives of all classes among total number of verification images), sensitivity for each class (percentage of true positives among all positives) and specificity for each class (percentage of true negatives among all negatives).
| VGG16 | InceptionV3 | ResNet50 | |
|---|---|---|---|
| Accuracy | 91.20% | 96.93% | 95.87% |
| Sensitivity (normal) | 100% | 100% | 99.6% |
| Sensitivity (dry AMD) | 74.4% | 90.80% | 90% |
| Sensitivity (active wet AMD) | 99.2% | 100% | 98% |
| Specificity (normal) | 95.2% | 97.4% | 97.2% |
| Specificity (dry AMD) | 100% | 100% | 99.4% |
| Specificity (active wet AMD) | 91.6% | 98% | 97.2% |
Detecting condition changes within sequenced OCT images
After sorting the images by AMD-affected eyes and time series, our results indicated that the AI platform provided fast and precise detection of condition changes in the OCT images (Figure 5A); as soon as a new large drusen developed from a normal retina or a new active CNV appeared, the AI model would detect it, even if the change was small. Moreover, we chose 18 cases that had been longitudinally followed up 10 times to compare the accuracy of diagnosis and prediction of disease or treatment changes on these 10 occasions. As the heat map matrix in Figure 5B illustrates, in large image series (more than 10 OCT images in 1-2 years) the AI model clearly distinguished active CNV scars from inactive ones. This could assist in deciding whether to treat or observe during the follow-up period of patients with wet AMD.
Comparison of performance of AI model and clinical specialists in detecting AMD progression
Initially, we observed that the AI model could detect AMD type changes by analyzing the time series of OCT images obtained from the same patient, such as drusen development from normal retina and appearance of active CNV in initially dry AMD-affected retina (Figure S4). The accuracy of detection was identical or even better than that of four clinical reviewers, even though the changes were relatively small. To evaluate the performance of the AI model in more detail, we chose 18 AMD cases that have been followed in a time series of 10 consecutive checkups and compared the accuracy of diagnosis and treatment-associated changes between the ResNet50 AI model and four reviewers, two of whom were experienced retinal specialists in our hospital (Reviewers 1 and 2) and two were less experienced medical students (Reviewers 3 and 4). As shown by hierarchical clustering of prediction accuracy scores, the AI model and experienced Reviewers 1 and 2 had similarly high prediction accuracy scores, which clustered together; on the other hand, less experienced Reviewers 3 and 4 demonstrated markedly worse prediction accuracy scores, which clustered separately from the cluster of the AI, Reviewer 1 and 2 (Figure 5A). Then, we analyzed the prediction efficiency of the AI as compared to the reviewers within the time series of different lengths. The sequences of the first 2, 4, 6, 8 and 10 images from the original 10-image series were analyzed and it was revealed that both AI and experienced Reviewers 1 and 2 had similarly high mean prediction accuracies for all 5 time series (Figure 5B). In contrast, less experienced Reviewers 3 and 4 demonstrated significantly lower mean prediction accuracies in all series, with a steady decrease in accuracy with increasing length of the series (Figure 5B). Figure S5 shows five typical cases of predictions in a 10-times time series.
Figure 5
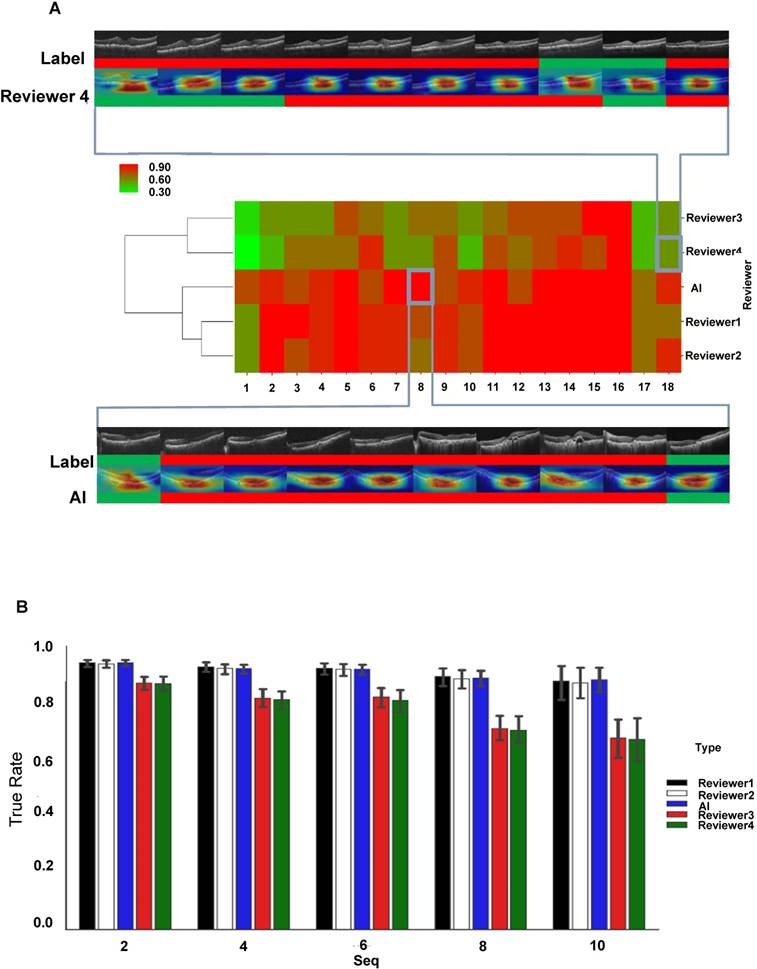
Comparison of the performance of the AI model and clinical specialists in detecting AMD progression. (A) Hierarchical clustering of prediction accuracy scores of 18 AMD cases, each consisting of 10 consecutive follow-ups. The scores labeled red signify high prediction accuracy and green, low accuracy. A typical case of low prediction score in 10 follow-ups (4 wrong predictions out of 10) is shown at the top and a high prediction accuracy case (0 wrong predictions out of 10) is shown at the bottom, where green color represents inactive wet AMD and red color active wet AMD. (B) Mean prediction accuracies of the AI model and four reviewers within time series of different lengths (2, 4, 6, 8 and 10 observations). Error bars represent standard deviations.
Figure 6
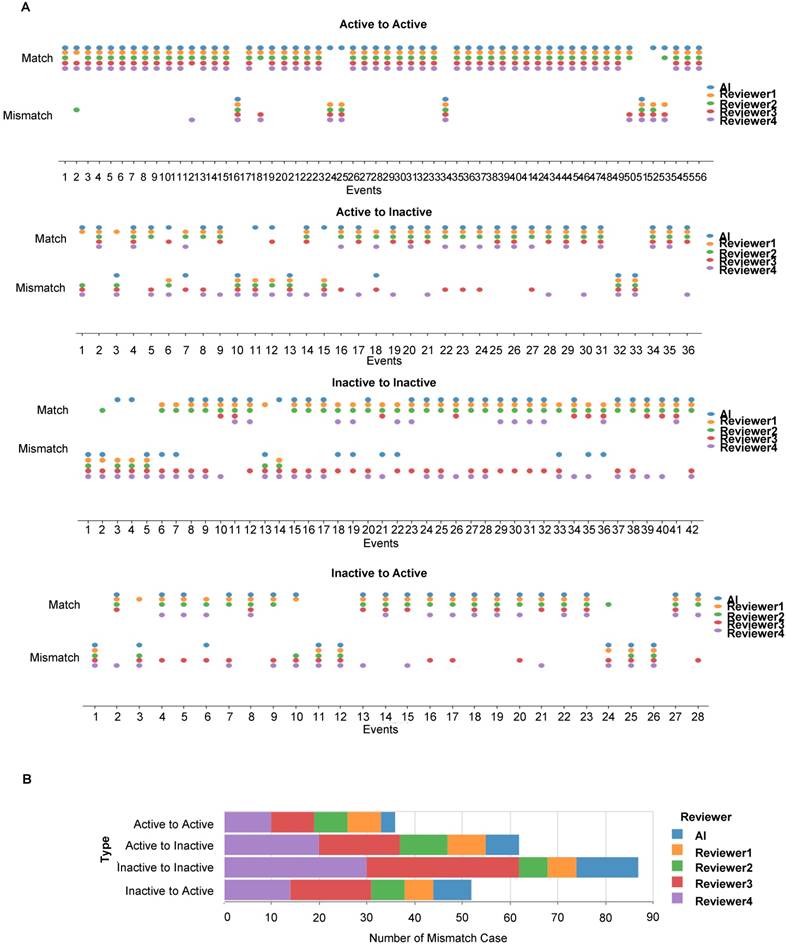
Longitudinal disease tracking of active and inactive CNV status changes between any two consecutive OCT images along a time series by the AI model and four clinical reviewers. (A) Scoring of all correctly (match) and incorrectly (mismatch) identified active-active, inactive-inactive, active-inactive and inactive-active status changes in pairs of consecutive OCT images. (B) Quantification of incorrectly (mismatch) identified cases of AMD status change.
Next, we scored the cases of correct identification of AMD status changes between any two consecutive OCT images in the time series, namely no change between active AMD, no change between inactive AMD, change from active to inactive and change from inactive to active types (Figure 6A). Misdiagnoses occurred less frequently when two consecutive images showed persistently active lesions and most frequently when these were persistently inactive (Figure 6B). More misdiagnoses were consistently made by reviewers 3 and 4.
To summarize, our results indicated that the AI models exhibited non-inferior performance in diagnosing and predicting disease or treatment changes when compared with retinal specialists in our hospital and superior performance when compared with medical students trained in ophthalmology.
Development of cloud-based AMD diagnostic service
This study demonstrated the utility of a CNN-based AI platform for analyzing OCT images to classify AMD types and provide medical recommendations. Having verified the AI platform as already described, we integrated the CNNs into a cloud-based service available on the following website: https://www.ym.edu.tw/~AI-OCT/ . The website consists of four tabs: Main, Tutorial, OCT Suggest, and Contact Us (Figure S6A). The Main tab describes the resources and website structure, and the Tutorial tab contains instructions on how to use the resources. OCT Suggest opens the interface for actual image analysis, which is organized into four consecutive steps: 1) Upload OCT file, 2) Select area of analysis, 3) Select AI model for diagnosis, and 4) Diagnosis result (Figure 7 and Figure S6B). Clicking on the OCT Suggest tab opens a dialogue box for uploading an image file. After uploading, the OCT image is displayed on the webpage, and the area to be analyzed can be selected. When one of the three AI models (ResNet50, VGG16, or Inception V3) has been selected, analysis is started by clicking on the OCT Analysis tab. In addition, the image can be rotated by 90°. The analysis normally takes 3-6 s, after which the webpage displays the diagnosis results and a heat map displaying the position of lesion features in the OCT image.
Figure 7
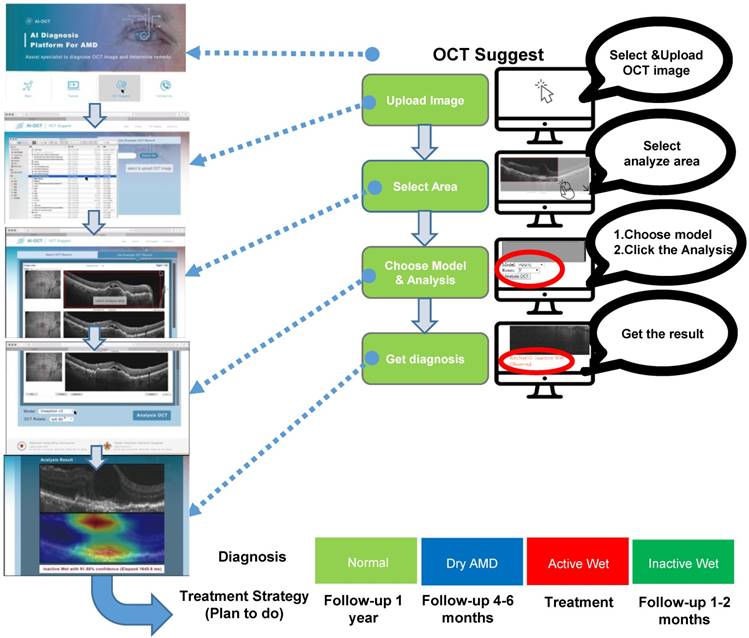
Interface outline and user guide of the cloud-based AI-OCT software. The consecutive steps of OCT image analysis include image upload, area selection, choice of one of three CNN models, and diagnosis output (shown on the right). Typical screenshots of the interface for each of these steps are shown on the left. The output (bottom) includes AMD type classification and suggestion for the action to be taken.
Discussion
AI has proved to be useful in various fields. Deep learning algorithms based on CNNs are increasingly finding application in medical diagnostics and could reduce the workload of medical personnel. Although some studies have demonstrated that AI can identify diseases with accuracy similar to that of human specialists, the extent of AI's involvement in medical decision-making remains controversial. In this study, we integrated the concepts of cloud computing and telemedicine with AI in diagnosing AMD and providing treatment recommendations, thereby demonstrating that smart health practices may lead to accurate diagnostic tools, more effective patient care, and devices that improve quality of life. Although an AI system that can diagnose diseases and provide treatment strategy decisions can benefit both doctors and patients, accessing such a service is difficult when it is located solely at a research center. By means of a user-friendly cloud computing website, our AI model can be used by anyone who has a computer and an Internet connection, marking a major breakthrough in current AI-based medical diagnostics and treatment decision-making.
Kermany et al. presented human-labeled datasets for researchers to use in training CNNs to “read” OCT image layers and integrate them into predicted disease classifications [2]. Similarly, Prahs et al. attempted to train their deep learning algorithm to impersonate a physician in treatment decision-making [15]. In our study, rather than only training a completely blank network, we also used fully connected feed-forward networks to fix the weights in the lower levels already optimized to recognize structures generally found in images and retrain the weights of upper levels through back propagation. In contrast to Kermany et al., who used only an InceptionV3-based model [2], we trained three different CNN models to identify normal macula and three AMD types. Through a transfer and deep learning process, we observed that the trained VGG16, InceptionV3, and ResNet50 models identified AMD types with accuracies of 91.40%, 92.67%, and 90.73%, respectively. No one model surpassed the other two when the test conditions were changed. However, our models seemed to perform relatively unsatisfactorily in recognizing dry AMD. To verify our AI system's performance, we also used the OCT image dataset employed by Kermany et al. [2] containing only images of normal macula, active CNV AMD, and dry AMD. We determined that our CNN models could identify OCT images of normal macula and CNV with sensitivities of 98%-100% (Table 2), whereas their sensitivity in identifying dry AMD ranged from 74.4% to 90.8% (Table 2).
Interestingly, it was clearly seen that the trained AI models identified the crucial areas and features (e.g., subretinal exudate, sub-RPE lesions) for discrimination of image classes correctly (Figure 3). To analyze the errors made by the AI, we identified all images that were misclassified by the established models. Among them, 109 to 122 (33.4% to 38.3%) were active wet AMD images misclassified as inactive wet AMD, 126 to 158 (44.0% to 44.3%) were dry AMD (drusen) images misclassified as inactive wet AMD, and 22 to 35 (6.0% to 9.7%) were inactive wet AMD images misclassified as active wet AMD. After checking these images and heatmaps carefully, we found that the AI sometimes misclassified the active wet AMD as inactive if subretinal fluid was shallow or located at the periphery. Also, the AI has misclassified dry AMD (drusen) as inactive wet AMD if the drusenoid RPE detachment was large or confluent. In relatively rare cases, the AI misclassified inactive wet AMD as active wet AMD if the neovascular scar was big and the reflective signal of OCT was irregular (Figure 4C).
The accuracy of dry AMD recognition can be improved by increasing the number of dry AMD images in the training process, which may improve the recognition rate by counteracting possible learning bias in the AI system caused by the presence of drusen in OCT images of active and inactive CNV. Another method that could increase the recognition rate is by using three models in combination. Disputed results could be reanalyzed by specialists, similar to the procedure followed when physicians disagree in their interpretation of the results. However, if no specialist can be found to interpret the results, the most severe discrimination results among the three models should be considered as the final diagnosis, and a patient should be referred to a hospital if the condition requires treatment. This can reduce ophthalmologists' workload in terms of analyzing OCT images.
We believe that not only classifying individual OCT images, but also detecting changes in disease activity are potentially important applications of our AI-based technique. The former is useful for screening patients, and the latter would be useful in following individual patients and advising them on the actions to be taken. If a patient has already been diagnosed with wet AMD by a clinician, our AI model could also be used for monitoring his/her disease activity later on. It should be noted that our AI-based software was not designed originally for longitudinal analysis, and better prediction could be achieved if longitudinal information, e.g., labeled time-series of OCT images, was also included in the training and prediction model. Fortunately, our results showed that even without such design, our model could achieve an accuracy rate as high as 95.29% in detecting disease activity change from 10 sequenced images.
Furthermore, we introduced the concept of telemedicine into our platform to ensure that our AI system would be widely used. The benefits of telemedicine include improving access to medical services, providing previously unavailable care options, and reducing medical costs [16]. The website developed to provide a cloud service based on this AI platform is located at https://www.ym.edu.tw/~AI-OCT/. It is accessible to all users, and a step-by-step tutorial is provided in Figure S4B. Doctors or patients can upload their OCT images and immediately obtain information on AMD types and treatment recommendations (Figure S7). Even in remote places with few medical services, this website can help patients access their OCT image reports immediately and learn whether they should seek further treatment, provided that an optician or a general practitioner (e.g., in hospitals without an ophthalmologist) with an OCT device is available to perform the examination. Another strength of our study is that we analyzed images from three different OCT devices and resized them to 224 × 224 pixels. This can assist the AI system to identify images from various types of OCT devices at different medical facilities. However, if the image quality is too low, for example brightness or sharpness are poor, or the format of an image is not jpg or png, the AI may have low prediction accuracy or could even not analyze an image. Moreover, in several cases, high-quality OCT images cannot be obtained due to cataract or other ocular conditions, and such cases were excluded from our training dataset. In this situation, other factors, such as visual symptoms and results from ophthalmoscopy, should be considered simultaneously for identifying disease activity clinically. Although OCT devices have continually and greatly improved since they were invented [17], the corresponding analytical software has not undergone similar progress. Therefore, integrating an AI-based image discrimination system into OCT devices to provide medical diagnoses and advice automatically is appropriate.
To summarize, this paper proposes AI software based on three different CNN models that can differentiate normal macula and three AMD types and provide treatment recommendations. To implement the telemedicine concept, we also developed a website with a cloud service based on this AI platform. In its present state, the website can help doctors and patients who wish to ascertain a patient's AMD status and receive treatment recommendations. It should be noted that for OCT images with other retinal diseases, such as diabetic macular edema and macular dystrophies, our AI system might show a wrong diagnosis. Therefore, patients need to attend a hospital to perform the OCT exam, and the decision on treatment should be based not solely on the results from the AI classifier but, most importantly, on clinical judgement. However, this software can be used in some areas where ophthalmologists (especially retinal specialists) are scarce and can help the health care provider to decide whether the patient should be referred or not. Also, our software will suggest the patient to seek medical help if active CNV is suspected. The definite diagnosis and treatment should be performed by a retinal specialist based on the clinical evidence and experience.
Abbreviations
AMD: age-related macular degeneration; AI: artificial intelligence; AUC: area under the curve; CNN: convolutional neural network; CNV: choroidal neovascularization; DME: diabetic macular edema; FAG: fluorescence angiography; FN: false negative; FP: false positive; FPR: false positive rate; FWA: frequency-weighted accuracy; OCT: optical coherence tomography; OCTA: optical coherence tomography angiography; ROC: receiver operating characteristic; TN: true negative; TP: true positive; TPR: true positive rate; VEGF: vascular endothelial growth factor.
Supplementary Material
Supplementary figures and tables.
Acknowledgements
This study was funded by the Ministry of Science and Technology (MOST) (105-2633-B-009-003, 105-3011-B010-001, 106-2633-B-009-001, 106-2319-B-001-003, 106-2119-M-010-001, 106-3114-B-010-002, and 107-2633-B-009-003), Academia Sinica and MOST (MOST 104-0210-01-09-02, 105-0210-01-13-01, 106-0210-01-15-02, and 107-0210-01-19-01), Taipei Veterans General Hospital (V104E14-001-MY3-2, V105C-077, V106E-004-2, V106C-001, V107C-139, and V107E-002-2), the Department of Health Cancer Center Research of Excellence (MOHW105-TDU-B-211-134003, MOHW105-TDU-B-211-133017, MOHW106-TDU-B-211-113001, and MOHW107-TDU-B-211-123001), NRPB Human iPSC Alliance-Core Service (MOST 105-2325-B-010-005), VGH, TSGH, NDMC, AS Joint Research Program (VTA105-V1-5-1, and VTA107-V1-5-1), VGH, NTUH Joint Research Program (VN106-02、VN107-16), and National Health Research Institutes (NHRI-EX106-10621BI, and NHRI-EX107-10621BI), Taiwan. This work was also financially supported by the “Cancer Progression Research Center, National Yang-Ming University” and “Aiming for the SPROUT Project-Center for Intelligent Drug Systems and Smart Bio-devices (IDS2B)” of National Chiao Tung University from the Featured Areas Research Center Program within the framework of the Higher Education Sprout Project by the Ministry of Education (MOE) in Taiwan.” Furthermore, special thanks to IEI x QNAP team's contribution in deploying a reliable AI server and proceeding AI model to make a fabulous success in this study.
Competing Interests
The authors have declared that no competing interest exists.
References
1. Christiansen EM, Yang SJ, Ando DM. et al. In silico labeling: predicting fluorescent labels in unlabeled images. Cell. 2018;173:792-803
2. Kermany DS, Goldbaum M, Cai W. et al. Identifying medical diagnoses and treatable diseases by image-based deep learning. Cell. 2018;172:1122-31
3. Zhao R, Camino A, Wang J. et al. Automated drusen detection in dry age-related macular degeneration by multiple-depth, en face optical coherence tomography. Biomed Opt Express. 2017;8:5049-64
4. Lee CS, Tyring AJ, Deruyter NP. et al. Deep-learning based, automated segmentation of macular edema in optical coherence tomography. Biomed Opt Express. 2017;8:3440-8
5. Schlegl T, Waldstein SM, Bogunovic H. et al. Fully automated detection and quantification of macular fluid in OCT using deep learning. Ophthalmology. 2018;125:549-58
6. McDonnell ME. Telemedicine in complex diabetes management. Curr Diab Rep. 2018;18:42
7. Surendran TS, Raman R. Teleophthalmology in diabetic retinopathy. J Diabetes Sci Technol. 2014;8:262-6
8. Griebel L, Prokosch HU, Kopcke F. et al. A scoping review of cloud computing in healthcare. BMC Med Inform Decis Mak. 2015;15:17
9. Wong WL, Su X, Li X. et al. Global prevalence of age-related macular degeneration and disease burden projection for 2020 and 2040: a systematic review and meta-analysis. Lancet Glob Health. 2014;2:e106-16
10. Mitchell P, Korobelnik JF, Lanzetta P. et al. Ranibizumab (Lucentis) in neovascular age-related macular degeneration: evidence from clinical trials. Br J Ophthalmol. 2010;94:2-13
11. Chew EY, Clemons TE, Harrington M. et al. Effectiveness of different monitoring modalities in the detection of neovascular age-related macular degeneration: the HOME study, report number 3. Retina. 2016;36:1542-7
12. Wittenborn JS, Clemons T, Regillo C. et al. Economic evaluation of a home-based age-related macular degeneration monitoring system. JAMA Ophthalmol. 2017;135:452-9
13. Hee MR, Puliafito CA, Wong C. et al. Optical coherence tomography of central serous chorioretinopathy. Am J Ophthalmol. 1995;120:65-74
14. Fung AE, Lalwani GA, Rosenfeld PJ. et al. An optical coherence tomography-guided, variable dosing regimen with intravitreal ranibizumab (Lucentis) for neovascular age-related macular degeneration. Am J Ophthalmol. 2007;143:566-83
15. Prahs P, Radeck V, Mayer C. et al. OCT-based deep learning algorithm for the evaluation of treatment indication with anti-vascular endothelial growth factor medications. Graefes Arch Clin Exp Ophthalmol. 2018;256:91-8
16. Hjelm NM. Benefits and drawbacks of telemedicine. Journal Telemed Telecare. 2005;11:60-70
17. Huang D, Swanson EA, Lin CP. et al. Optical coherence tomography. Science. 1991;254:1178-81
Author contact
![]() Corresponding author: Shih-Hwa Chiou, MD. PhD. Department of Medical Research, Taipei Veterans General Hospital; Institute of Pharmacology, Institute of Clinic Medicine, School of Medicine, National Yang-Ming University & Genomic Research Center, Academia Sinica, Taipei, Taiwan. E-mail: shchiougov.tw
Corresponding author: Shih-Hwa Chiou, MD. PhD. Department of Medical Research, Taipei Veterans General Hospital; Institute of Pharmacology, Institute of Clinic Medicine, School of Medicine, National Yang-Ming University & Genomic Research Center, Academia Sinica, Taipei, Taiwan. E-mail: shchiougov.tw
Citation styles
APA
Hwang, D.K., Hsu, C.C., Chang, K.J., Chao, D., Sun, C.H., Jheng, Y.C., Yarmishyn, A.A., Wu, J.C., Tsai, C.Y., Wang, M.L., Peng, C.H., Chien, K.H., Kao, C.L., Lin, T.C., Woung, L.C., Chen, S.J., Chiou, S.H. (2019). Artificial intelligence-based decision-making for age-related macular degeneration. Theranostics, 9(1), 232-245. https://doi.org/10.7150/thno.28447.
ACS
Hwang, D.K.; Hsu, C.C.; Chang, K.J.; Chao, D.; Sun, C.H.; Jheng, Y.C.; Yarmishyn, A.A.; Wu, J.C.; Tsai, C.Y.; Wang, M.L.; Peng, C.H.; Chien, K.H.; Kao, C.L.; Lin, T.C.; Woung, L.C.; Chen, S.J.; Chiou, S.H. Artificial intelligence-based decision-making for age-related macular degeneration. Theranostics 2019, 9 (1), 232-245. DOI: 10.7150/thno.28447.
NLM
Hwang DK, Hsu CC, Chang KJ, Chao D, Sun CH, Jheng YC, Yarmishyn AA, Wu JC, Tsai CY, Wang ML, Peng CH, Chien KH, Kao CL, Lin TC, Woung LC, Chen SJ, Chiou SH. Artificial intelligence-based decision-making for age-related macular degeneration. Theranostics 2019; 9(1):232-245. doi:10.7150/thno.28447. https://www.thno.org/v09p0232.htm
CSE
Hwang DK, Hsu CC, Chang KJ, Chao D, Sun CH, Jheng YC, Yarmishyn AA, Wu JC, Tsai CY, Wang ML, Peng CH, Chien KH, Kao CL, Lin TC, Woung LC, Chen SJ, Chiou SH. 2019. Artificial intelligence-based decision-making for age-related macular degeneration. Theranostics. 9(1):232-245.
This is an open access article distributed under the terms of the Creative Commons Attribution (CC BY-NC) license (https://creativecommons.org/licenses/by-nc/4.0/). See http://ivyspring.com/terms for full terms and conditions.