Impact Factor
- Issue 9; 2026
- Issue 8; 2026
- Issue 7; 2026
- Issue 6; 2026
- Issue 5; 2026
- Volume 16; 2026
- Advance Articles
- Past Issues
- Cover Images
- Cover Suggestion
- Index & Coverage
- Special Issues
Introduction
Results
Discussion
Acknowledgements
Materials and Methods
Supplementary Material
References
International Journal of Biological Sciences
International Journal of Medical Sciences
 Global reach, higher impact

Theranostics 2018; 8(22):6132-6148. doi:10.7150/thno.28027 This issue Cite
Research Paper
Development of a smartphone-based rapid dual fluorescent diagnostic system for the simultaneous detection of influenza A and H5 subtype in avian influenza A-infected patients
Seon-Ju Yeo1*, Homan Kang2*, Tung Duy Dao1*, Bui Thi Cuc1, Anh Thi Viet Nguyen1, Trinh Thi Thuy Tien1, Nguyen Le Khanh Hang3, Hoang Vu Mai Phuong3, Le Thi Thanh3, Le Quynh Mai3, Yoonhyuk Rah4, Kyoungsik Yu4, Ho-Joon Shin5, Chom-Kyu Chong6, Hak Soo Choi2, Hyun Park1 ![]()
1. Zoonosis Research Center, Department of Infection Biology, School of Medicine, Wonkwang University, Iksan, 570-749, Republic of Korea
2. Gordon Center for Medical Imaging, Department of Radiology, Massachusetts General Hospital and Harvard Medical School, Boston, MA 02114, USA
3. National Institute of Hygiene and Epidemiology, No 1- Yersin street, Hanoi, Vietnam
4. School of Electrical Engineering, Korea Advanced Institute of Science and Technology, Daejeon, 305-338, Republic of Korea
5. Department of Microbiology, Ajou University School of Medicine, and Department of Biomedical Science, Ajou University Graduate School of Medicine, Suwon 16499, Republic of Korea
6. GenBody Inc., 3-18, Eopseong 2-gil, Seobuk-gu, Cheonan, 31077, Republic of Korea
* These authors contributed equally to this work.
Received 2018-6-22; Accepted 2018-10-30; Published 2018-11-29
Abstract

Accurate and rapid diagnosis of highly pathogenic avian influenza A H5N1 is of critical importance for the effective clinical management of patients. Here, we developed a rapid and simultaneous detection toolkit for influenza A H5 subtype viruses in human samples based on a bioconjugate of quantum dots (QDs) assembly and a smartphone-based rapid dual fluorescent diagnostic system (SRDFDS).
Methods: Two types of QDs were assembled on a latex bead to enhance the detection sensitivity and specificity of influenza A infection (QD580) and H5 subtype (QD650). The dual signals of influenza A and H5 subtype of H5N1-infected patients were detected simultaneously and quantified separately by SRDFDS equipped with two emission filters.
Results: Our results showed a high sensitivity of 92.86% (13/14) and 78.57% (11/14), and a specificity of 100% (38/38, P < 0.0001) and 97.37% (37/38) for influenza A and H5 subtype detection, respectively.
Conclusion: Therefore, our multiplex QD bioconjugates and SRDFDS-based influenza virus detection toolkit potentially provide accurate and meaningful diagnosis information with improved detection accuracies and sensitivities for H5N1 patients.
Keywords: smartphone-based rapid dual fluorescent diagnostic system, quantum dot, H5N1, clinical patients
Introduction
Avian influenza (AI) viruses are distinct from human seasonal influenza viruses and are not easily transmissible to humans [1]. However, AI viruses may occasionally infect humans through direct or indirect contact, resulting in disease symptoms ranging from a mild illness to death. AI has become a global concern with a mortality rate of approximately 60% [2]. In this context, the H5N1 virus is highly contagious among birds and can be deadly, especially in domestic poultry and humans. Therefore, an on-site surveillance/alert system for the highly pathogenic avian influenza (HPAI) A H5N1 would prevent widespread exposure to the virus and identify potential patients/animals for immediate attention and treatment. Improved case management of diseases with common flu symptoms is especially crucial in densely populated areas [3]. An adequate H5 subtype-specific diagnostic toolkit for on-site monitoring has not been developed, and current field-level point-of-care testing (POCT) is not recommended for screening AI infections in clinical samples due to insufficient sensitivity and poor accuracy [4]. Simultaneous detection of multiple biomarkers using antigen-specific antibodies can increase the diagnostic accuracy and sensitivity of POCT. Thus, many researchers have attempted to design a molecular diagnostic method for the simultaneous detection of influenza A and B as well as their subtypes [5-7].
Multiplex detection has recently received great attention, and microfluidic devices have emerged as a promising diagnostic platform because of their favorable material transport process, rapid turnaround time, and low sample/reagent consumption [8, 9]. However, several challenges in mass production, particularly sensor fabrication costs, limit their clinical application for POCT [10]. Given the demand for multiplex testing and the major advantages of the lateral flow assay over alternative rapid diagnostic platforms, this study aimed to adapt the simplicity of the membrane-based lateral flow assay and multiplex techniques. Various fluorescent materials have been applied for lateral flow assays as alternative to conventional gold nanoparticles to detect influenza A as POCT [11-16]. Also, self-contained and disposable diagnostic devices have been developed [15, 17-19].
There is a critical need for POCT diagnostics in healthcare which can have a positive impact on the quality of life worldwide [20]. POCT devices of interest include smartphones [20], wearable devices [21], other complementary metal-oxide-semiconductor (CMOS) imaging devices [22], and strip readers [23]. Among them, devices integrating with personal computer have revolutionized research in recent decades, and smartphones are now finding increasing application in a wide variety of research domains as they are expedited by the integrated data capture, processing capability (e.g., lab in a phone), operability, compact form, relatively low cost, and very widespread circulation [24].
Given that assays combining nanoparticles with consumer electronic devices have almost exclusively utilized optical readout, we assessed the potential for quantum dots (QDs) nanoparticle-based electrochemical assays with readout through a smartphone. In particular, QDs have attracted considerable attention because of their improved quantum yield (QY), optical stability, and potential for multiplexing in POCT [25, 26]. The application of QDs in lateral flow strips via an aptamer is widely used in POCT [27, 28].
Despite the versatile tunability of the emission peaks of QDs in multiplexed diagnostic systems, few reports show their application in clinical diagnostics [29, 30]. Since high-fluorescent QDs are usually synthesized at elevated temperatures in organic solvents, they are only soluble in non-polar organic solvents, which are not suitable for biological applications, water compatibility, and bioconjugation. When QDs are covered with hydrophilic shells using tedious processing [31], the signal is too weak for the visible readouts of POCT requiring encapsulation of many QDs in an individual nanoparticle [32].
Detection of two influenza A virus subtypes (H5 and H9) via single QD-based immunoassay was previously reported by Wu et al. [33]; however, it was not simultaneous detection of two antigens of one subtype virus by two different QDs. Single QD was also successfully used to detect H7N9 by combined magnetic capture, but this was performed under a UV detector rather than POCT [34]. Also, a laboratory immunoassay for detecting H5N1 using QD was developed and tested in chicken samples [35]. Thus, no multiplex POCT diagnostic system for detecting two antigens of a single virus has yet been developed to reliably perform the primary screening.
We had previously developed a portable smartphone-based rapid fluorescent diagnostic system (SRFDS) [13]. In this study, it was advanced to a multiplex AI virus detection toolkit and readout system equipped with a portable SRDFDS using two emission filters. The system was designed to simultaneously detect both influenza A and its H5 subtype on a single strip using two QD signals (580 nm and 650 nm) and provides quantitative analysis with high accuracy. This system can be used for the accurate and early diagnosis of influenza viral infections for POCT in clinical settings.
Results
Characterization of QD-latex-monoclonal antibody bioconjugate
Nanobiomaterials require water-soluble QDs of high quality [36, 37]. We synthesized water-soluble and stable core-multi-shell QDs (CdSe/CdS/ZnS) using the standard hot injection method with TOPO ligand as the stabilizing agent. Subsequently, ligand exchange was carried out to replace the hydrophobic TOPO ligands with hydrophilic MPA ligands. The emission wavelength could be tuned by controlling the QD core size, and two types of QDs (QD580 and QD650 at 580 nm and 650 nm emissions, respectively) were synthesized. The QYs of the QDs were calculated as 70% and 48% for QD580 and QD650, respectively (Fig. S1). The diameters of QD580 and QD650 were 5.4 ± 1.5 nm and 9.3 ± 2.0 nm, respectively (Fig. S2). This high QY (>70%) has been reported to be measurable under UV light [38]; however, few studies have investigated the required QYs for a relatively low sensitivity detection tool such as POCT. When we observed the fluorescence signals of the QDs under a UV lamp after a strip assay with a high concentration of viruses (160 hemagglutinin units [HAU]/ml) (Fig. 1A), intensities of both QD580 and QD650 conjugates were inconclusive in both the test and control lines, indicating that QDs alone are not suitable for sensitive virus detection in POCT.
Characterization of bioconjugates with or without latex substrate. (A) The bioconjugate complex with QDs and monoclonal antibody (mAb) (without latex) was tested on a strip with the H5N3 virus; images were then taken under UV exposure. (B) Schematic illustration of the synthesis of the bioconjugate with latex, QDs, and mAbs. (C) TEM of the bioconjugate complexes; (i) Latex beads; (ii) Latex + QD580 complexes; (iii) Latex + QD580 + mAb complexes; (iv) Latex + QD650 complexes; (v) Latex + QD650 + mAb complexes. (D) The diameters of each bioconjugate were calculated (n = 30) and plotted. (E) Latex, QDs, and mAbs were conjugated together and tested on nitrocellulose-coated with anti-influenza A or anti-influenza H5 subtype using a fluorescent immunochromatographic test. The images of the test line were captured under UV illumination. (F) The fluorescent pixel values of the latex conjugate were plotted. CL, control line; TL, test line. ***, P < 0.001.
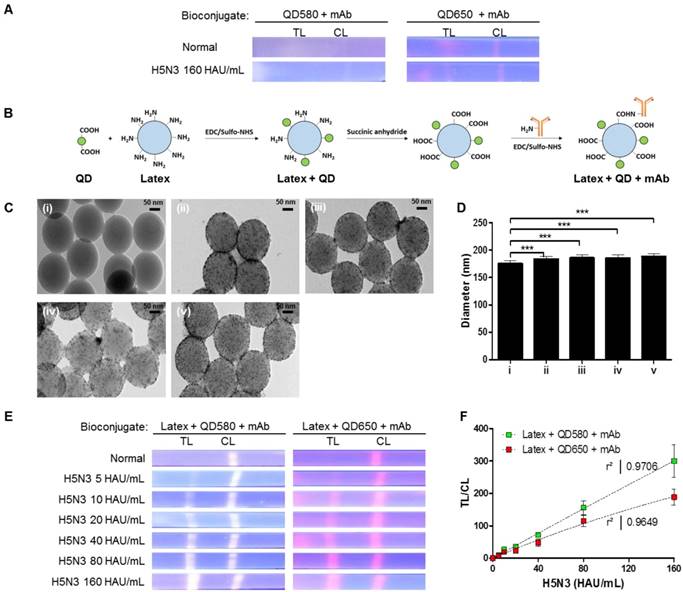
To amplify the fluorescence intensity, QDs were assembled onto an amine-functionalized latex template using the EDC/NHS coupling method (Fig. 1B). All remaining amine groups on the latex bead surface were converted to carboxylate groups for conjugation with monoclonal antibodies (mAbs). As shown in Fig. 1C, a large number of hydrophilic MPA-capped CdSe/CdS/ZnS QDs were attached to latex beads, as confirmed by transmission electron microscopy (TEM) analysis. Following conjugation of the QDs with mAbs, the sizes of the complexes increased to 185.83 ± 5.25 nm for latex + QD580 + mAb, and 188.38 ± 5.28 nm for latex + QD650 + mAb, compared to the latex alone (175.09 ± 5.27 nm) (n = 30 per sample) (Fig. 1D). This diameter of the latex was chosen because it was relatively bigger than the antibody (hydrodynamic diameter of ∼10 nm) [39] and the QDs (10 nm). Empirically, a latex larger than 175 nm caused precipitation on the membrane thereby hindering the lateral flow, and smaller than 100 nm latex could not efficiently carry the antibody and QDs on the surface. According to our computational calculations of the average diameter of the QDs, latex, and length of MPA ligands, the surface of the latex was conjugated with an average of 2,243 numbers of QD580 and 924 of QD650 beads per latex, respectively (details of this calculation are shown in Supplementary Information Scheme S1).
Each latex bioconjugate was tested using a rapid fluorescent immunochromatographic assay, and fluorescent images were captured under UV light. Pixels were counted using ImageJ software to determine the dynamic range of quantification (Fig. 1E). The ImageJ software was used to interpret the raw data in two dimensions with the length and width of the band defined by the repeated 'rectangle tool' such that the chemiluminescent signal emitted from the band was registered as a peak rising out of the test line (TL) or control line (CL). In this study, each TL was subtracted from the background and was normalized by the ratio of the density of CL to calculate TL/CL in Fig 1. As shown in Fig. 1F, both latex bioconjugates had a high linear regression (QD580 conjugate: r2 = 0.9706, and QD650 conjugate: r2 = 0.9649) for the H5N3 virus at concentrations of 5-160 HAU/mL (Fig. S3).
Design of the SRDFDS platform
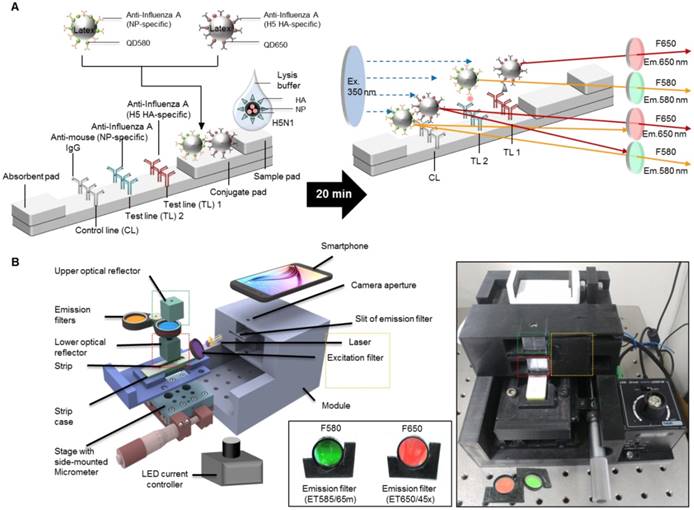
To determine the presence of AI virus antigens on the strips, image acquisition and fluorescence intensity estimation were performed on two TLs and a CL on a lateral flow immunoassay strip using SRDFDS. Two bioconjugates were simultaneously used with SRDFDS to achieve high fluorescence detection sensitivity within a single strip and to analyze a separate lateral flow reaction accurately (Fig. 2A). The fluorescence intensity of the two QDs bioconjugates was measured by a smartphone detector utilizing the same platform containing a pair of parabolic mirrors between the lateral flow strip and the smartphone's camera [13]. However, current SRDFDS was designed to get fluorescent signals of two QDs separately in the CL, using two different emission filters (580 nm and 650 nm) which were inserted into the module (Fig. 2B). In the lateral flow, a control line was used to confirm completion of the testing reaction by capturing the antibody on the conjugate. Our study was performed using both conjugate mouse monoclonal antibodies. As the species of anti-influenza A NP and H5 subtype were the same, anti-mouse IgGs coated on one control line were expected to capture both conjugates. With emission filters, the fluorescent signal of each conjugate captured on the control line could be obtained, separately. The emission filter at 580 nm had 585 nm wavelength (at center) and 65 nm bandwidth, while the emission filter at 650 nm had 650 nm wavelength (at center) and 45 nm bandwidth, indicating that the two emission filters could discriminate each QD signal at one CL.
The smartphone-based fluorescence detector is presented on the right side of Fig. 2B. To measure each fluorescence value under different emission filters, the fluorescence intensity values of each line were measured after changing the position of the line with a micrometer. The LED current controller regulated the energy level independent of the detector. As described previously, an application running on the Android operating system was developed to enable non-experts to easily complete a fluorescence immunochromatographic diagnostic test and report its results via wireless communication through step-by-step instructions displayed on the smartphone's touchscreen [13]. After completing the measurements, the test result was obtained by computing the ratio of fluorescence intensity (TL1/CL or TL2/CL).
Strategy to analyze SRDFDS results
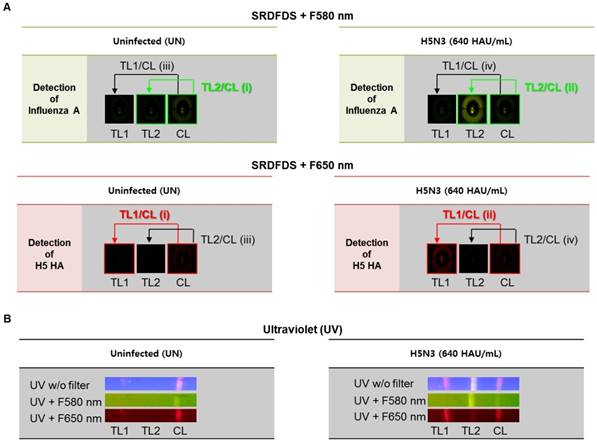
To achieve a simultaneous diagnostic performance, dual quantum dots-mediated separate fluorescence signals for each test line (TL) and control line (CL) with two different emission filters must be measured. SRDFDS can normalize the positive sample compared to the negative sample using each value of TL/CL [TL1/CL for H5-HA detection with 580 nm emission filter (F580 nm) and TL2/CL for influenza A with 650 nm emission filter (F650 nm)] and the fold of control. Finally, all results obtained by SRDFDS can be analyzed with dual fluorescence signals leading to accurate diagnostic result using only TL1/CL or TL2/CL.
Fig. 3A shows the strategy of signal analyses measured by SRDFDS. The TL2/CL value at 580 nm and TL1/CL value at 650 nm of the positive sample (ii in Figure 3A) were divided by the corresponding values of the uninfected sample (i in Figure 3A) to normalize and obtain the final TL/CL value (fold of control). The TL/CL values of the counterpart test lines (iii and iv) were also obtained to check cross-reactions and further increase accuracy. As shown in Table 1, inter-assay coefficients of variation (CV) were less than 11 % for all TC/CL values. Following SRDFDS measurements, all diagnostic strips were observed under UV excitation with or without two emission filters to further confirm the accuracy of the assay (Fig. 3B).
Overview of the smartphone-based rapid dual fluorescent diagnostic system (SRDFDS). (A) Schematic presentation of the multiplexed lateral flow strip with two simultaneous conjugates. To induce the lateral flow reaction toward the test line (TL) and control line (CL), virus particles in lysis buffer were dropped on the sample pad. After 20 min, each conjugate was posted on each test line, while the unreactive bioconjugates flowed further and were caught by the anti-mouse IgG on the CL. To normalize each conjugate reaction on the strip, counterpart fluorescence values of the conjugates in the CL were excluded using two different emission filters (580 nm and 650 nm) with the smartphone-based fluorescence detector containing a reflective light concentrator module and two emission filters. HA, hemagglutinin; NP, nucleoprotein. (B) Schematic representation of the smartphone-based fluorescence detector with a reflective light concentrator module and two emission filters. An image of the smartphone-based fluorescence detectors is shown with two different emission filters for 580 nm (ET585/65nm; F580) and 650 nm (ET650/45 nm; F650) on the right panel. Location of upper- and lower optical reflectors is presented in green and red dotted boxes, respectively. Orange dotted-lined box indicates the position of the laser and excitation filter.
TL/CL values in test line and counterpart test line and inter-assay coefficients of variation (CV) measured by SRDFDS
| Each test line | Virus titer | Mean | SD | CV % | Inter-Assay CV |
|---|---|---|---|---|---|
| Influenza A (F580) | 40 HAU/mL | 3.32 | 0.16 | 5.09 | 6.10 % |
| 160 HAU/mL | 8.90 | 0.63 | 7.10 | ||
| H5 HA (F580) | 40 HAU/mL | 1.19 | 0.11 | 9.23 | 8.16 % |
| 160 HAU/mL | 1.38 | 0.10 | 7.14 | ||
| Influenza A (F650) | 40 HAU/mL | 0.79 | 0.07 | 9.20 | 10.99 % |
| 160 HAU/mL | 2.60 | 0.33 | 12.78 | ||
| H5 HA (F650) | 40 HAU/mL | 3.61 | 0.24 | 6.71 | 9.14 % |
| 160 HAU/mL | 15.77 | 1.82 | 11.56 |
Optimization of the lysis buffer
For developing a dual diagnostic system, it was essential to optimize the fluorescent immunochromatographic strip test (FICT) conditions to prevent cross-reactivity of two test lines with two target antigens on one viral particle. For accurate normalization of each TL/CL, both conjugates must interact with only one test line. CL indicates the leftover conjugate amount after lateral flow. If some fraction of the conjugate is randomly captured by the counter test line, its concentration would be decreased thereby increasing the TL/CL value. Therefore, in the case of cross-reaction, a high TL/CL is inaccurate.
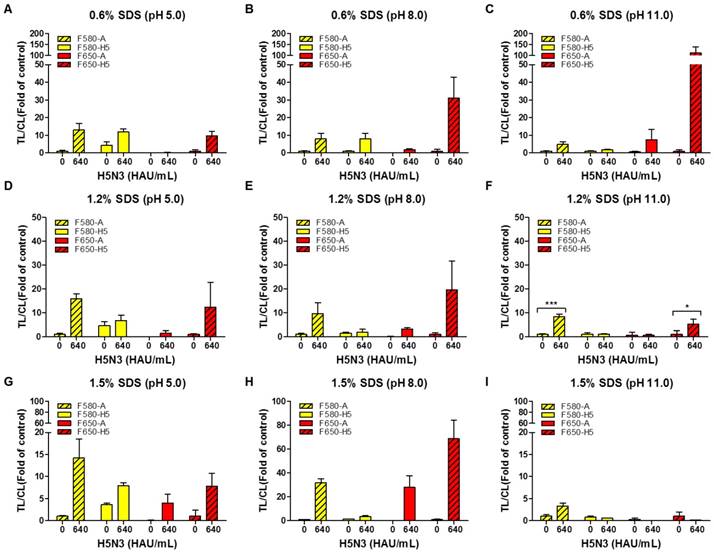
For one virus particle to specifically bind to the bioconjugate in each TL, all viral antigens need to be released making the composition of the lysis buffer a critical factor. We, therefore, tested different concentrations of sodium dodecyl sulfate (SDS) at different pH values to determine the suitable range for a specific reaction without interference by the other TL. As displayed in Fig. 4, the lysis buffer was tested with different concentrations of SDS (0.6, 1.2, and 1.5%) at different pH values (5, 8, and 11) using 100-fold dilution of both conjugates with H5N3 virus (640 HAU/mL).
As the rapid diagnostic strip was not ELISA-based and lacked multiple washing steps, it readily showed nonspecific reactions based on the characteristics of an antibody. The H5 HA-specific antibody at TL1 cross-reacted with the influenza A antibody conjugate (QD580) in 0.6% SDS at pH 5.0 which was reduced at higher pH values (Fig. 4A-C). The QD580 conjugate showed a non-specific reaction at TL1 regardless of the presence of the virus affecting TL/CL at normalization. The reduced amount of CL was due to the waste of the conjugate at the other test line rendering the normalization of TL/CL inaccurate. As 0.6% SDS in lysis buffer (pH 11.0) (Fig. 4C) was not sufficient in removing the cross signaling at TL1, we increased the SDS concentration at different pH values (Fig. 4D-F). As displayed in Fig. 4F, compared with 1.5% SDS (Fig. 4G-4I), the lysis buffer with 1.2% SDS at pH 11.0 led to a more consistent TL/CL value at each TL without cross signaling. Therefore, of the nine different combinations of SDS and pH tested, 1.2% SDS at pH 11.0 was most effective in suppressing the cross-reaction of both QD bioconjugates against counterpart test line. The performance of the current smartphone-based diagnostic system was, therefore, further optimized to increase the TL/CL ratio by adjusting the two variables in the lysis buffer (1.2% SDS and pH 11.0). All raw SRDFDS results are shown in Fig. S4.
Optimization of the dilution factor of bioconjugates
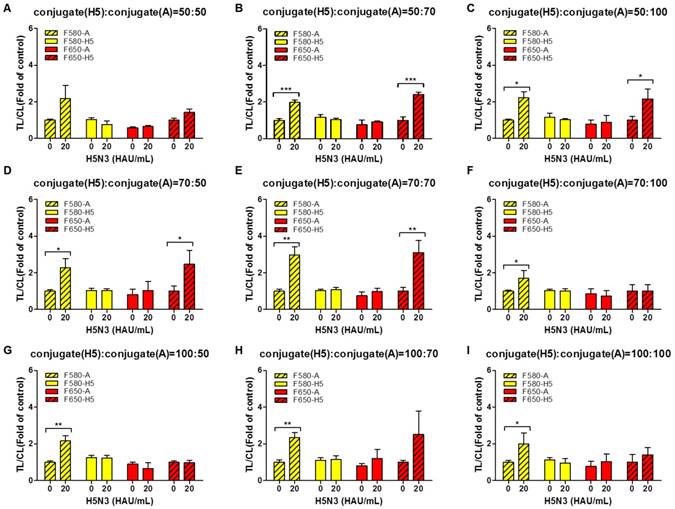
To increase the TL/CL ratio, different dilutions (50, 70, and 100 folds) of QD580-conjugated anti-influenza A NP and QD650-conjugated anti-H5 HA antibody were applied to SRDFDS in the optimized lysis buffer (1.2% SDS and pH 11.0) in the following combinations:
The 50-, 70-, and 100-fold diluted QD650 conjugate (to detect H5 HA) was mixed with differentially diluted QD580 conjugate (to detect influenza A NP) with 50-, 70-, and 100-fold dilutions (Fig. 5A-5I). The highest concentrations of bioconjugates (H5 HA conjugate: influenza A conjugate=50:50) not only interfered with migration on the strips, but also increased the relative CL value decreasing the TL/CL ratio, indicating that there is no significant difference between the negative sample and H5N3 (20 HAU/mL) in terms of 'fold of control' (Fig. 5A).
Analysis of dual fluorescence signals of the smartphone-based rapid dual fluorescent diagnostic system (SRDFDS). (A) The assay was conducted with two QD conjugates for 20 min in the presence of the H5N3 virus. SRDFDS was used to observe two fluorescent signals using separate emission filters, and test line (TL)/control line (CL) values were calculated by smartphone. TL2/CL at F580 nm (green box) or TL1/ CL at F650 nm (red box) indicate influenza A and H5 HA, respectively. TL1/CL and TL2/CL of virus sample (ii) were divided by TL1/CL and TL2/CL of each uninfected sample (i), respectively, to obtain normalized value (fold of control). Normalized TL/CL values of counterpart test lines (iii and iv) also confirmed to ascertain that there was no cross-reactivity. (B) Under a UV light, fluorescent signals at TL1, TL2, and CL on the strip were observed without (w/o) or with two emission filters (F580 nm or F650 nm). TL1, H5 subtype-specific test line; TL2, influenza A test line; CL, control line to normalize TL.
Optimization of lysis buffers for SRDFDS with two QD bioconjugates. Various concentrations of SDS (0.6, 1.2, and 1.5%) at different pH values (5.0, 8.0, and 11.0) in lysis buffer were tested using 100-fold diluted conjugates. In lysis buffer, 0.6% SDS was dissolved at three different pHs (A, B, and C). 1.2% SDS was dissolved in lysis buffers of different pHs (D, E, and F). 1.5% SDS was dissolved in lysis buffers of different pHs (G, H, and I). All data (n = 3) are shown as the mean ± SD. F 580-A, TL2/CL of influenza A taken with the 580 nm emission filter; F 580-H5, TL1/CL of H5 taken with the 580 nm emission filter; F 650-A, TL2/CL of influenza A taken with the 650 nm emission filter; F 650-H5, TL1/CL of H5 taken with the 650 nm emission filter. TL1, H5 subtype-specific test line; TL2, influenza A test line; CL, control line to normalize TL. *, P < 0.05; ***, P < 0.001.
As shown in Fig. 5B - 5E, at 20 HAU/mL of H5N3 virus, the following combinations of the dilutions of QD650-conjugated anti-H5 HA antibody: QD580-conjugated anti-influenza A NP showed a significant difference without any cross-reactions in the TL/CL value of counterpart: 50-fold:70-fold (P < 0.001); 50-fold:100-fold (P < 0.05); 70-fold:50-fold (P < 0.05); 70-fold:70-fold (P < 0.01). Further study was performed with diluents of 50-fold and 70-fold of QD650-conjugated anti-H5 HA and QD580-conjugated anti-influenza A NP, respectively. All raw SRDFDS results are shown in Fig. S5.
Quantitative analysis of SRDFDS
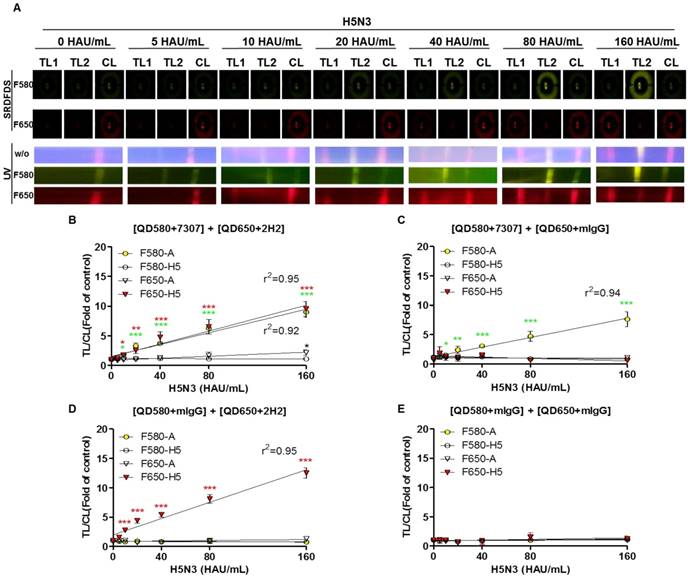
After establishing the ideal conditions for the bioconjugate to detect both influenza A and HA on the strip, we examined the quantitative range of SRDFDS for detecting the H5N3 virus using a serial dilution of the virus. Representative images taken using SRDFDS and UV were compared in the presence of the two bioconjugates and are displayed in Fig. 6A. The fluorescence signals of each TL increased at their respective wavelengths for concentrations of up to 160 HAU/mL proportional to the virus titer by both SRDFDS and UV. At 160 HAU/mL, TL2 of the influenza A showed cross-reaction at F650 (P < 0.05) under UV. On the contrary, we did not identify any cross-reactivity of QD650-conjugated anti-H5 HA at TL1 of H5 HA at F580, indicating that this emission filter (F580) could discriminate the fluorescence signal of TL1 derived from QD650 conjugate.
We determined the limit of detection (LOD) in our immunoassay based on the statistics shown in Fig. 6B-6E. Using F580, the virus titer corresponding to the LOD of influenza A NP was 10 HAU/mL [TL/CL: 1.80 ± 0.13 (mean ± SD)] (P < 0.05). The virus titer corresponding to the LOD of H5 HA at F650 was 10 HAU/mL [TL/CL: 1.77 ± 0.24 (mean ± SD)] (P < 0.05).
The LODs obtained from multiplexed QD conjugates for different emission filters were compared to those with one bioconjugate and a negative control conjugate (one antibody was replaced with anti-mouse IgG). The LOD of the single conjugate was still 10 HAU/mL for both influenza A (P < 0.05) and H5 HA (P < 0.001). At the high titer of 160 HAU/mL, there were no cross signals from the conjugates at both emission filters, indicating that at this high virus titer, there was no random binding of the conjugate due to cross-signaling or loss of conjugate on the counterpart TL. It implied that the problem of optical leaking at F650 used in SRDFDS could be ignored in computing TL/CL because the lack of random binding of the conjugate to test lines and non-wasted conjugate leftover resulted in an accurate TL/CL value.
The negative control conjugates showed a clear reaction from lateral flow in SRDFDS. All raw SRDFDS results are shown in Fig. S6. The RNA copy number of the LOD (10 HAU/mL) for SRDFDS was determined by reverse transcription-polymerase chain reaction (rRT-PCR) (Fig. S7). The LOD of the fluorescent immunochromatographic strip test (FICT; 10 HAU/mL) corresponded to a Ct value of 27.86 ± 0.26 (mean ± SD) and 3.3 × 10⁵ ± 5.2 × 10³ (mean ± SD) RNA/μL for influenza A NP, and a Ct value of 28.27 ± 0.095 (mean ± SD) and 5.9 × 10⁵ ± 3.9 × 10³ (mean ± SD) RNA/μL for H5 HA. The accuracy of SRDFDS was examined by computing the inter-assay coefficient of variation (CV) (Table 1). The virus titer of spiked specimens was adjusted to 40 or 160 HAU/mL by mixing 10 µL of the appropriate virus stock with 90 µL of nasopharyngeal specimens. The ratios of TL/CL derived from all experiments were then plotted for comparison. TL/CL between the negative control and specimens with the virus at 40 HAU/mL or 160 HAU/mL showed a significant difference for influenza A and H5 HA at the relevant emission filter (P < 0.001). The analytical error rate was computed by the inter-assay CV based on replicates of 40 HAU/mL and 160 HAU/mL. The inter-assay CV of SRDFDS for influenza A detection using F580 was 6.10%, and that of H5 HA detection using F650 was 9.14%, demonstrating that SRDFDS is an accurate technique because the range of inter-assay CVs was below 15% [40]. All raw SRDFDS results are shown in Fig. S8. Intraday CV was measured by calculating the relative standard deviation (RSD) between 20 and 160 HAU/mL [41]. RSD of influenza A was 2.798 ± 0.7 % (mean ± SD) and that of H5 was 4.73 ± 1.3 % (mean ± SD), indicating that this assay was reliable (Fig. S9).
Optimization of dilution factors of the two bioconjugates for SRDFDS. Conjugates at different dilution factors (50, 75, and 100) were tested in lysis buffer (1.2% SDS and pH 11.0) at 20 HAU/mL of H5N3 virus. 50-fold diluted QD650 conjugate to detect H5 HA was mixed with 50-, 70-, and 100-fold diluted QD580 conjugates to detect influenza A NP (A, B, and C). 70-fold diluted QD650 conjugate to detect H5 HA was mixed with 50-, 70-, and 100-fold diluted QD580 conjugate to detect influenza A NP (D, E, and F). 100-fold diluted QD650 conjugate to detect H5 HA was mixed with 50-, 70-, and 100-fold diluted QD580 conjugate to detect influenza A NP with (G, H, and I). All data (n = 3) are shown as the mean ± SD. F 580-A, TL2/CL of influenza A taken with the 580 nm emission filter; F 580-H5, TL1/CL of H5 taken with the 580 nm emission filter; F 650-A, TL2/CL of influenza A taken with the 650 nm emission filter; F 650-H5, TL1/CL of H5 taken with the 650 nm emission filter. *, P < 0.05; **, P < 0.01; ***, P < 0.001.
Limit of detection (LOD) of SRDFDS. (A) SRDFDS was carried out using diagnostic strips with two QD conjugates [anti-influenza A (7307) conjugated with QD580, and anti-H5 HA (2H2) conjugated with QD650]. The fluorescence images of serially diluted H5N3 virus (10-160 HAU/mL) were captured after 20 min with SRDFDS including two emissions filters (top panel). Serially diluted H5N3 viruses (10-160 HAU/mL) were dissolved in human nasopharyngeal samples at a 1:10 dilution ratio. The fluorescence images under UV light were captured without a filter (naked eye) or with each filter (bottom panel). F580, 580 nm emission filter; F650, 650 nm emission filter. (B) The TL/CL values of SRDFDS obtained in the presence of two QD conjugates [anti-influenza A (7307) conjugated with QD580, and anti-H5 HA (2H2) conjugated with QD650] was plotted. (C) The result of two QD conjugates [anti-influenza A (7307) conjugated with QD580 and anti-mouse IgG conjugated with QD650] was plotted. (D) The result of two QD conjugates [anti-mouse IgG conjugated with QD580 and anti-H5 HA (2H2) conjugated with QD650 nm] was plotted. (E) The result of two QD conjugates [anti-mouse IgG conjugated with QD580 and anti-mouse IgG conjugated with QD650] was plotted *, P < 0.05; **, P < 0.01; ***, P < 0.001.
Characterization of SRDFDS
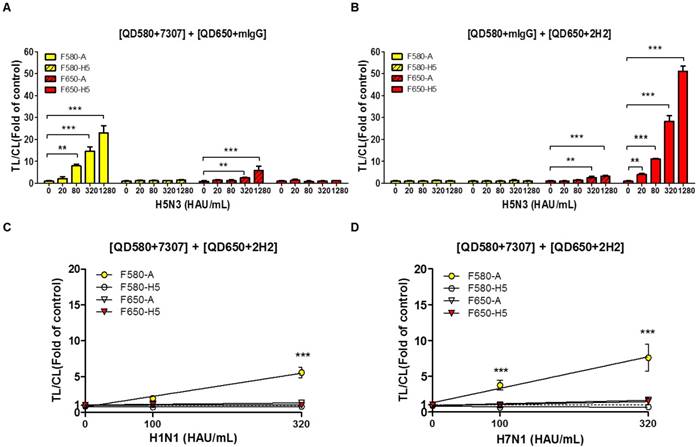
A significant advantage of QDs is that they can be designed to possess distinct emission spectra. Furthermore, the emission filter eliminates the fluorescent signal of the other QD, because it absorbs only the wavelengths emitted by each QD and blocks all external fluorescent signals. In this study, the range of optically leaky fluorescent signal derived from the counterpart QD was examined at each emission filter, and the random binding of the antibody conjugate to counterpart test line was analyzed using relatively high titer of virus (up to 1,280 HAU/mL). To replicate the multiplex QD condition of SRDFDS, QD-conjugated mouse IgG (mIgG) was mixed with QD580-conjugated anti-influenza A (7307) or QD650-conjugated anti-H5 HA (2H2). The mixture of QD580-conjugated influenza A NP antibody (7307) and QD650-conjugated mIgG was anticipated to be detected at F580 only. However, the TL/CL value derived from this mixture was significantly different at 320 HAU/mL (P <0.01) and 1,280 HAU/mL (P <0.001) for detecting influenza A at F650 implying that the F650 could not eliminate the leaky fluorescent signal derived from the mixture and that the viral concentration of 320-1,280 HAU/mL may also have influenced the cross signaling of QD580 at F650 (Fig. 7A). Also, QD580-conjugated anti-influenza A NP (7307) antibody did not bind to the test line of H5 HA even at 1,280 HAU/mL, indicating that it did not possess any cross-reactivity with the H5 HA TL.
In the mixture of the QD650-conjugated anti-H5 HA (2H2) and QD580-conjugated mIgG, we found no leaky fluorescent signals in the H5 HA TL at F580 even though TL/CL of H5 HA reached 50, indicating that the F580 totally eliminated the QD650 fluorescent signal. However, the same mixture showed significant cross-reactivity (P <0.01) by QD650 conjugate at test line of influenza A NP in the presence of 320 HAU/mL of the H5N3 virus at F650 (Fig. 7B). This result implied that if the diagnostic result of H5 had a TL/CL value of <10 at ~160 HAU/mL, there was no cross-reaction between QD650-conjugated anti-H5 HA (2H2) and TL of influenza A NP. However, at a concentration of >320 HAU/mL with a TL/CL value of >10 in the anti-influenza A NP TL, QD650-conjugated anti-H5 HA appeared to bind to both TLs of the influenza A NP and the H5 HA. The raw FICT results are presented in Fig. S10.
H5 subtype-specificity of SRDFDS was confirmed by testing the H1N1 and H7N1 viruses in specimens at a titer of 100 and 320 HAU/mL using multiplex QD conjugates. These samples only showed positive reactions for the influenza A TL but not the H5 HA (P <0.001) (Fig. 7C and 7D). The raw FICT results are presented in Fig. S11.
Characteristics of SRDFDS for cross-reactivity. (A) Cross-reactive fluorescence signals derived from counter QD conjugates were measured with anti-influenza A (7307) conjugated with QD580 and anti-mouse IgG conjugated with QD650. (B) Cross-reactive fluorescence signals derived from counter QD conjugates were measured with anti-mIgG conjugated with QD580and anti-H5 HA (2H2) conjugated with QD650. Specificity of H5 subtype of SRDFDS was confirmed using two other subtypes of influenza A H1N1 and H7N1 using two QD conjugates [anti-influenza A (7307) conjugated with QD580, and anti-H5 HA (2H2) conjugated with QD650]. Two different titers (100 and 320 HAU/mL) of H1N1 (C) and H7N1 (D) were tested. mIgG, mouse IgG;**, P < 0.01; ***, P < 0.001.
Summary of confirmed clinical H5N1 cases
| WHO number | ID # of H5N1-Patient (condition) | SRDFDS (F580) | SRDFDS (F650) | RDT | |||||||
|---|---|---|---|---|---|---|---|---|---|---|---|
| Influenza A (TL/CL)a | Binary decision | H5 subtype (TL/CL) | Binary decision | Influenza A (TL/CL) | Binary decision | H5 subtype (TL/CL)b | Binary decision | Influenza A | H5 subtype | ||
| VN 100 | HN31323 (Died) | 3.015229 | +c | 0.86226 | - | 1.543994 | + | 2.436656 | + | ++ | + |
| VN 101 | HN31388 (Died) | 1.134799 | + | 0.783615 | - | 0.929327 | - | 1.618479 | + | - | - |
| VN 102 | HN 31394 (Died) | 1.319824 | + | 0.933822 | - | 1.31077 | + | 2.585017 | + | + | - |
| VN 104 | HN 31412 (Died) | 1.569141 | + | 0.884962 | - | 0.781649 | - | 1.461974 | + | + | - |
| VN 103 | HN 31413 (Died) | 1.029201 | + | 0.927551 | - | 0.716693 | - | 1.183629 | + | - | - |
| unknown | HN 31633 (unknown) | 1.852751 | + | 0.696401 | - | 0.42691 | - | 1.998384 | + | - | - |
| VN 105 | HN 31432 (Died) | 7.007594 | + | 0.586058 | - | 4.415967 | + | 3.649366 | + | +++ | + |
| VN 106 | HN 31461 (Died) | 7.933741 | + | 0.779657 | - | 5.075783 | + | 7.431674 | + | +++ | - |
| VN 107 | HN 31604 (unknown) | 2.285176 | + | 0.561886 | - | 0.999415 | - | 2.452928 | + | + | + |
| VN 109 | HN 31641 (unknown) | 4.223218 | + | 0.734558 | - | 3.315596 | + | 4.201969 | + | + | - |
| VN 110 | HN 31673 I, II, III (unknown) | 1.252749 | + | 0.482183 | - | 0.338941 | - | 2.077125 | + | + | + |
| VN 116 | HN 36250 (unknown) | 1.163247 | + | 0.386676 | - | 0.52115 | - | 0.46166 | - | - | - |
| VN 118 | HN 36282 (unknown) | 1.431718 | + | 0.508205 | - | 0.114384 | - | 0.364808 | - | - | - |
| VN 119 | HN 36285 (unknown) | 0.811577 | -d | 0.345209 | - | 0.115766 | - | 0.229321 | - | - | - |
a, Cut-off =1.
b, Cut-off =1.
c, Positive result.
d, Negative result.
Clinical performance of SRDFDS
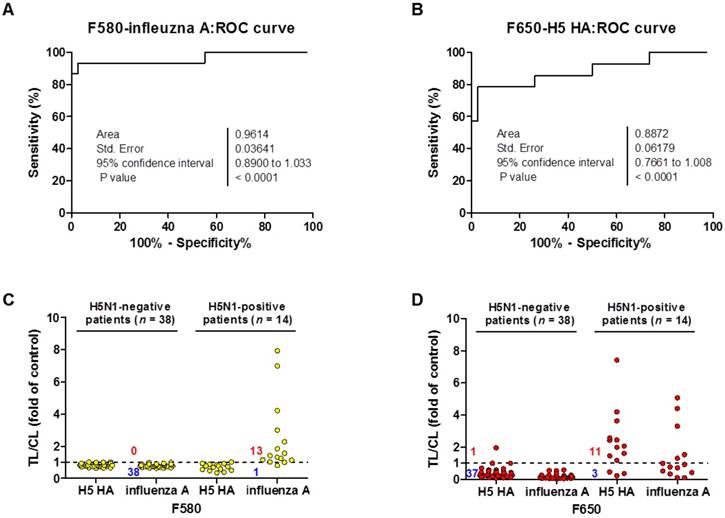
For actual measurements with clinical samples, specimens from 14 patients confirmed to be infected with H5N1 (clade 2.3.4), listed as WHO case numbers, were tested at the National Institute of Hygiene and Epidemiology (NIHE), Hanoi, Vietnam. The detailed characterization of patients has been described in a previous report [13]. Patients from # 16 (VN 100) to # 29 (VN 119) were used in our analysis for the evaluation of SRDFDS. These H5N1-confirmed patients (four females, nine males, and one unknown) with the mean age of 18.5 years (range, 2―40) were enrolled between 2007 and 2010. Sample collection was performed within a week of the onset of the illness. Among the 14 cases, 7 patients died within two weeks of the onset of the illness, showing 50% mortality (Table 2).
For binary diagnostic decision, the TL/CL threshold cut-off value for H5N1 was determined to be 0.77 for influenza A and 0.25 for H5 HA from receiver-operating characteristic (ROC) curve analysis; all TL/CL values were normalized based on this cut-off value (positive if TL/CL > 1, negative otherwise). The ROC curve analysis resulted in an area under the curve (AUC) value of 0.96 (95% confidence interval [CI]: 0.89-1.033) for the diagnosis of influenza A (P < 0.0001) (Fig. 8A). The diagnosis of H5 HA showed an AUC of 0.89 (95% CI: 0.76-1.008; P < 0.0001) (Fig. 8B), indicating that SRDFDS had high accuracy to predict H5N1 infection for both influenza A and H5 HA. Of the H5N1 positive 14 patients, only one case showed a false-negative TL/CL value while the other cases showed above the threshold TL/CL values for influenza A detection at F580. The non-infected control group (n = 38) showed no false-positive cases for influenza A (Fig. 8C). When detecting H5 HA in the patients, SRDFDS showed eleven positive cases and three false negative cases based on the threshold TL/CL value at F650 (Fig. 8D). Five cases with a higher TL/CL value than the other cases showed cross-reactivity at different emission filter (Fig. 8B). Four out of five cases with a positive TL/CL at F580 were also strongly positive at F650 for influenza A detection. Detailed results of the TL/CL values from SRDFDS and RDT are presented in Table 3.
Clinical validation of SRDFDS with H5N1-infected patient samples. A third-party field trial of SRDFDS was performed using human throat swab specimens collected from H5N1-infected patients (n = 14) in Vietnam, and negative control patients from Vietnam and Korea (n = 38). Each receiver operating characteristic (ROC) curve was plotted for influenza A (A) and H5 subtype (B). The accuracy of the SRDFDS was determined based on the area under the ROC curve (AUC). The cut-off value used for the detection of H5N1 was applied to determine the presence of the virus. All fluorescence levels of TL/CL against negative control group or positive patients were plotted for prediction of infection by influenza A and H5 subtype using two different emission filters for 580 nm (F580) (C) and 650 nm (F650) (D), respectively.
Clinical performance of SRDFDS
| Assay | Diagnosis | Performance | % | 95% CI |
|---|---|---|---|---|
| SRDFDS | Influenza A | Sensitivity | 92.86 (13/14) | 66.13% to 99.82% |
| Specificity | 100.00 (38/38) | 90.75% to 100.00% | ||
| H5 HA | Sensitivity | 78.57 (11/14) | 49.20% to 95.34% | |
| Specificity | 97.37 (37/38) | 86.19% to 99.93% | ||
| RDT | Influenza A | Sensitivity | 57.14 (8/14) | 28.86% to 82.34% |
| Specificity | 100 (38/38) | 90.75% to 100.00% | ||
| H5 HA | Sensitivity | 28.57 (4/14) | 8.39% to 58.10% | |
| Specificity | 100 (38/38) | 90.75% to 100.00% |
Among the negative control patients, only one case of a metapneumovirus (MPV)-infected patient showed a false-positive for H5 HA detection with higher TL/CL values than the threshold. As seen in Table 3, SRDFDS showed a sensitivity of 92.86% (13/14) (95% CI: 66.13-99.82) and a specificity of 100% (38/38) (95% CI: 90.75-100.00; P < 0.0001) for influenza A detection. For H5 HA detection, SRDFDS showed a sensitivity of 78.57% (11/14) (95% CI: 49.20-95.34) and a specificity of 97.37% (37/38) (95% CI: 86.19-99.93; P < 0.0001). All results are presented in Figs. S12 and S13. The same antibodies were used to perform a simple, rapid diagnostic test (RDT) using colloidal gold nanoparticles (GenBody Inc., Cheonan, Republic of Korea) to test the same patients. H5N1-infected patients showed eight positive cases out of 14 for influenza A (sensitivity: 57.14%; 95% CI: 28.86-82.34%) and four positive cases out of 14 for H5 HA (sensitivity: 28.57%; 95% CI: 8.39-58.10%). The control group (n = 38) showed no false-positive cases for the detection of influenza A or H5 HA. All results from RDT are presented in Figs. S14 and S15.
Based on these results, the H5N1-specific SRDFDS we developed had superior specificity and sensitivity for the detection of H5N1 HPAI virus strains (clade 2.3.4). The reactivity of mAbs to other H5N1 (clade 1) was also confirmed, indicating the capability of SRDFDS to detect multiple clades of H5N1 HPAI (Fig. S16).
Discussion
Since November 2003, WHO reported more than 700 human cases of Asian HPAI H5N1 viruses mostly from fifteen countries across Asia, Africa, the Pacific, Europe, and the Near East [42]. Due to high cross-reactivity and antigenic variability, H5-subtype-specific rapid diagnostic systems have been developed and tested mainly in wild birds and not in humans [43]. Therefore, there is an urgent need to develop more sensitive and H5 subtype-specific on-site monitoring systems. However, H5-subtype-specific rapid diagnostic systems have only been rarely developed.
QD-based electrochemical assays have been extensively explored because of their optical properties, tunability, and potential for multiplexing in POCT. So far, preventing nonspecific reactions in QDs and increasing solubility have been major challenges because the use of high-temperature organometallic synthetic procedures produces monodisperse nanocrystals with a passivated surface containing a monolayer of hydrophobic surfactant ligands [44-46]. QDs are insolubly monodispersed with a very wide range of possible emission spectra ranging from ultraviolet to near-infrared that can be controlled by simply changing their size, composition, and structure [36, 37]. For water compatibility and bioconjugation, QDs are covered with a hydrophilic shell which is a popular method to solubilize QDs in aqueous media and improve their signal intensity through encapsulation with polymers [31, 32]. To apply QDs to POCT, encapsulation of QDs with a polymer was routinely used to amplify the fluorescent signal, and few trials have attempted to use polymers on QD surface for POCT systems [31, 32, 47]. This may reflect the weakness of the fluorescent signal of QDs making it difficult to be captured by POCT. An additional method of encapsulating many QDs in one particle was suggested to amplify the fluorescent signal from the QD nanoparticles [32].
Currently, a rapid dual POCT system has been developed that detects two different pathogen species rather than two antigen targets in one pathogen [33]. However, simultaneous detection of two antigens of one pathogen, HPAI H5N1, would strengthen the primary screening of POCT and inform clinicians of the H5-infection potential, although the patient may test negative due to the relatively small amount of H5-specific antigen compared to influenza A NP antigen.
To overcome this limitation, in this study, we developed a novel method using CdSe/CdS/ZnS QDs for POCT and evaluated the clinical feasibility of this multiplex diagnostic system. We also employed a unique method for coating QDs on the surface of a latex increasing the sensitivity of the fluorescent signal, thus improving the sensitivity of the POCT system (Fig. 1A and 1E).
In order to increase the accuracy of POCT, each TL value on the lateral flow strip needs to be normalized against that of the CL [30].
In a previous study, a single QD was used to detect two different viruses. Most of the multiplex QD-labeled strips, which possessed an extremely high sensitivity (0.016 HAU of H5 and 0.25 HAU of influenza A as a limit of detection), were used without accurate normalization of the CL resulting in qualitative rather than quantitative detection of targets [33]. Other groups have applied a single QD for detecting only one target antigen of one viral particle rather than for simultaneous targeting of two antigens of one viral particle. Chen and colleagues studied fluorescence-linked immunosorbent assay (FLISA) with chicken samples and Cui et al. examined influenza virus using an electron microscope for imaging; however, none of these systems was a rapid diagnostic system [35, 48]. Li's group developed a QD-linked rapid diagnostic system, which needed additional HCL and Br2 treatment steps to measure fluorescence intensity [49].
In contrast, our assay provides a rapid system for detecting two antigens of one virus simultaneously resulting in the reliability of the screening data. Two different QDs and emission filters were used for targeting two different components of the same virus on a single strip. All components of the viral antigens needed to be separated from the virion to prevent cross-reactions on the counterpart TL. In our study, the bioconjugate of latex, QDs, and mAb was used for the simultaneous identification of influenza A and H5 subtype with no cross-reactivity at a concentration of 5-160 HAU/mL. This assay showed a good linear regression at a TL/CL range of 1-10 (Fig. 6), which corresponds to the TL/CL ranges in clinical patients (Fig. 8).
As reported by de Jong et al. a fatal case had H5N1 viral loads of about 5.8 log10 cDNA copies (nose) and 7.5 log10 cDNA copies (throat) [50]. The rRT-PCR in our study of 5.9 log 10 cDNA corresponded to the limit of detection of our assay for H5 HA and 5 - 6.5 log 10 cDNA copies corresponded to the quantitative range of 5-160 HAU/mL. Taken together, we believe that our limit of detection and quantitative range enabled detection of a fatal H5N1 human case. We have provided evidence by diluting HPAI H5N1 virus in addition to H5N3, which showed a good linear regression in this TL/CL range (Fig. S17). As Fig. 7 shows, the cross-reactivity of influenza A TL obtained by F650 nm at 160 HAU/mL was not derived from the random binding of QD650 conjugate to influenza A test line. Except for one patient (VN 102) (TL/CL;1.31), four patients (VN 100, VN 105, VN 106, and VN 109), who had TL/CL value of > 3 against influenza A detection, were positive at F650 and were not due to the random binding of QD650 conjugate but simple optical leaking. As this optical leaking did not interfere with TL1/CL or TL2/CL results in patients, clinical readouts to diagnose influenza A and H5 HA measured by SRDFDS could be considered reliable.
Our system was limited by random binding of QD650 conjugate at influenza A TL at an extremely high titer, such as 320-1200 HAU/mL, due to the use of a less than perfect lysis buffer, where the fluorescence signal of QD580 was captured by F650. In contrast, the F580 excluded the fluorescent signal from QD650 conjugates completely while QD650 conjugates targeting H5 HA were cross-reactive to the TL of influenza A NP at concentrations greater than 320 HAU/mL, indicating that the NP- and HA antigens of single virus particle were not completely separated at this high titer.
For influenza A diagnosis, an isothermal nucleic acid amplification-based integrated system, Alere i influenza A&B test, had an excellent performance showing a sensitivity of 87.2-93.8% and specificity of 62.5-100% [51, 52]. Moreover, an antigen detection kit showed a sensitivity of 60-80% [53, 54]. Therefore, our result is comparable to that of the isothermal nucleic acid amplification-based integrated system and could be more accurate than that of the rapid diagnostic system. However, no commercialized H5 subtype-specific rapid diagnostic system is currently available. Here, we have developed an assay that provides a reliable primary screening result to clinicians by furnishing dual information for highly pathogenic H5N1 virus-infected patients with 50% mortality. As laboratory immunoassay, we conducted sandwich fluorescence-linked immunosorbent assay (FLISA)with the QD conjugates and found that SRDFDS was more sensitive than FLISA (Fig. S18). Furthermore, the lowest virus titer of a commercial RDT (influenza A) was 80 HAU/mL, indicating that our SRDFDS improved the performance to recognize the same virus by 8 folds over the commercial RDT kit (Fig. S19).
To the best of our knowledge, our study is the first to clinically evaluate a rapid kit with the ability to detect influenza A and H5-subtype simultaneously in human samples. This assay was designed to develop an efficient QD-based method with more than 50% QY; we believe that our study could adapt current QDs to the POCT platform based on lateral flow test strips via latex conjugation.
In summary, the H5 subtype-specific SRDFDS developed in this study allowed for the accurate identification of influenza A and HA subtype for the rapid detection of H5N1 HPAI viruses in human clinical samples. This multiplexing of the QD-based SRDFDS system can lay the foundation for the rapid and simultaneous detection of subtype-specific influenza virus samples in a clinical setting.
Acknowledgements
This research was supported by the Priority Research Centers Program through the National Research Foundation of Korea (NRF), funded by the Ministry of Education (NRF-2015R1A6A1A03032236) and the Bio & Medical Technology Development Program of the NRF funded by the Korean government, MSIP (2014M3A9E2064699).
Author contributions
SY and HK designed and optimized all immunoassays under the guidance of HC and HP. TD synthesized and characterized quantum dots. BC, NA, and TT conducted all immunoassays. NH, HP, LT, and LM conducted the clinical study. YR and KY developed the diagnostic device. HS and CC developed monoclonal antibody and strip. SY, HK, HC, and HP wrote the paper with input from all other authors.
Materials and Methods
Reagents
Aliphatic amine latex beads (0.2% w/v 0.1 μm) were purchased from Life Technologies (Carlsbad, CA, USA). N-(3-Dimethylaminopropyl)-N′-ethylcarbodiimide hydrochloride (EDC) and N-Hydroxysulfosuccinimide sodium salt (Sulfo-NHS) were acquired from Thermo Fisher Scientific (Waltham, MA, USA). All other chemicals were purchased from Sigma Aldrich (St. Louis, MO, USA). All procedures to synthesize TOPO-capped CdSe/CdS/ZnS QD multi-shells (CdSe/CdS/ZnS QD-TOPO) were carried out in an inert Ar atmosphere using the conventional Schlenk line technique. Briefly, CdSe nanocrystal cores were synthesized from CdO, TOPO, HDA, and DDPA following the method of Reiss et al [55]. The TOPO-capped CdSe/CdS/ZnS QD multi-shells were synthesized using the successive ion layer adsorption and reaction (SILAR) method [56]. The CdS and ZnS shells were grown consecutively over a CdSe core at an optimized temperature of 240 °C. Water-soluble MPA-capped CdSe/CdS/ZnS QDs were prepared by exchanging the TOPO ligand in the synthesized TOPO-capped CdSe/CdS/ZnS QDs with the 3-mercaptopropionic acid ligand. The reaction conditions in this ligand-exchange method were achieved by using tetramethylammonium hydroxide (TMAOH), an organic base, to improve the reactivity of the thiol with the CdSe/CdS/ZnS QD surface [57]. The detailed procedure for the synthesis of QDs is described in the Supplementary Methods. One H5 subtype-specific monoclonal antibody (mAb) (2H2) (detection) was developed by Professor Ho-Joon Shin (Ajou University, Suwon, Korea) and Professor Hyun Park (Wonkwnag University, Iksan, Korea); H5 subtype-specific mAb (1C5) (capture) was donated by Dr. Chom-Kyu Chong (GenBody Inc., Cheonan, Korea). Two monoclonal antibodies, anti-influenza A-7307 (detection) and A-7304 (capture) targeting nucleoprotein (NP), were purchased from Medix Biochemica (Espoo, Finland).
Characterization of QDs
High-resolution transmission electron microscopy (HR-TEM) was performed using a JEM-2010F electron microscope (JEOL, Tokyo, Japan) with an accelerating voltage of 200 kV[58]. For TEM sampling, 0.2% sample solutions were drop-casted onto a carbon-coated copper grid and the solvents were evaporated in a vacuum. UV-Vis absorption spectra were obtained using a SCINCO S-3150 spectrometer. Photoluminescence (PL) spectroscopy and QY measurements were performed using a He-Cd (Kimmon Electric Co., IK3501R-G, Tokyo, Japan) excitation source at 480 nm, as well as a photodiode array detector (IRY1024, Princeton Instrument Co., Trenton, NJ, USA). Nuclear magnetic resonance (NMR) data were collected using a superconducting FT-NMR at 300 MHz (Varian, Palo Alto, CA, USA). Chemical shifts were reported in parts per million (ppm). High-resolution X-ray diffraction (XRD) patterns were collected using an X'Pert PRO Multi-Purpose X-ray diffractometer (PANalytical, Almelo, Netherlands) equipped with a Cu Kα source operated at 40 kV and 30 mA. Thermogravimetric analysis (TGA) was conducted using a METTLER TOLEDO SDTA851e under N2.
Viruses
Avian influenza virus H5N3, H7N1, H1N1, and influenza B were obtained from the Centers for Disease Control & Prevention, Korea. All viruses were cultured by egg inoculation and titrated by a hemagglutination assay as described previously [12].
Conjugation of QDs
For conjugation of QDs to the antibodies, 13 µL (0.26 nmol) of QDs were mixed with 460 μL 0.1 M sodium phosphate (pH 8.0) containing 10 μL 0.01 M EDC and 15 μL 0.01 M Sulfo-NHS for 1 h. After removing excessive EDC and Sulfo-NHS by centrifugation for 5 min at 27,237 × g, precipitated QDs were incubated with 0.1 M sodium phosphate (pH 8.0) and 20 μL antibodies (1 mg/ml) for 3 h. To remove unbound reactants, the mixture was centrifugated for 5 min at 27,237 × g, and the precipitated QDs were dissolved in 500 μL 0.1 M phosphate (pH 8.0) containing 0.1% bovine serum albumin (BSA). For conjugation of the QDs to the latex, 25 µL latex beads (2% w/v, 200 nm) and 50 µL QDs (580 nm or 650 nm) were added to 175 µL 0.1 M sodium phosphate (pH 8.0) and rotated for 1 h at 25 °C with 100 µL 20 mM EDC and 150 µL 20 mM Sulfo-NHS. Excess EDC and Sulfo-NHS were removed by centrifugation at 27,237 × g for 5 min. Next, 400 µL succinic anhydride (60 mg/mL) in 0.1 M sodium phosphate was added to completely exchange -NH2 groups to -COOH groups on the surface of the latex-QD complex which was activated by adding 1.3 µL 50 mM EDC and 10 µL 0.5 M Sulfo-NHS in 0.05 M MES buffer (pH 6.1). Activated latex-QDs were then mixed with 75 µL antibody (1 mg/mL) in 1 mL 0.05 M MES buffer (pH 6.1) and allowed to react for 6 h at 25 °C. After centrifugation at 27,237 × g for 5 min, the latex-QD- antibody complex was collected, washed with storage buffer (2 mM borax, 0.1% BSA, pH 9.0), resuspended in 200 µL storage buffer, and stored in the dark at 4 °C. To conjugate mouse serum IgG with latex-QDs, the same molar ratio of mouse serum IgG to antibody was used.
Fabrication of lateral flow strip
Nitrocellulose membrane (#HF180, EMD Millipore, Darmstadt, Germany) was used for antibody coating. Conjugate pads (#G028, EMD Millipore), sample pad (#C083, EMD Millipore), and an absorbent pad (#G048, EMD Millipore) were prepared on the backing card (#754104, Rockville, MD, USA). The nitrocellulose membrane was coated with 0.2 μg of goat anti-mouse IgG (Life Technology) on the control line (CL). Two test lines (0.8 μg/lane) were coated with anti-influenza H5 subtype (1C5) (Test line 1: TL 1) and anti-influenza A NP (7304) (Test line 2: TL 2), respectively. After drying the membrane at 30 °C for two hours, the diagnostic strip was tested by FICT assay.
Smartphone-based rapid dual fluorescent diagnostic system (SRDFDS)
Test strips containing four components each (a sample application pad, a conjugate pad, a nitrocellulose membrane, and an absorbent pad) were used. The control line (CL) was coated with 2 mg/mL anti-mouse IgG. Test line 1 (TL1) was coated with 2.5 mg/mL anti-influenza H5 subtype-specific HA1 mouse monoclonal antibody 1C5. Test line 2 (TL2) was coated with anti-influenza A NP mouse monoclonal antibody 7304. The conjugate pad or each strip was prepared by dropping 2 μL of diluents of two bioconjugates and the strip was preserved in room temperature before use. For measurements, 75 µL samples and 75 µL lysis buffer were mixed and applied to the sample pad for lateral flow. After 20 min, the result was read by the smartphone-based rapid fluorescent diagnostic system (SRDFDS). During lateral flow on the strip, the influenza virus in the sample reacted with the latex-QD-antibody. The ratio of TL/CL was measured by the smartphone's camera with two fluorescent filters (one filter each for the 580 nm and 650 nm emission wavelengths).
Development of portable fluorescence detector for SRDFDS
A lightweight and compact (18 × 12 × 14 cm3) module for portable fluorescence detection was designed to fit a smartphone (Galaxy S3, Samsung Electronics, Korea) and was fabricated by a 3D printer (Cubicon Single, 3D Cubicon, Seongnam, Korea). A black ABS filament was used to make a light and robust module while reducing light scattering. The module included a custom-made parabolic metal-coated light concentrator placed between the specimen strip and smartphone camera for efficient collection of the fluorescence signal [13]. An LED (M365D2, Thorlabs, Newton, NJ, USA) connected to a power supply (LEDD1B, Thorlabs) was used for fluorescence excitation. An OD4 bandpass filter with a center wavelength of 365 nm (#65-069, Edmund Optics) and OD4 400 nm short pass filter (#84-689, Edmund Optics, Barrington, NJ, USA) were used to cut-off longer wavelengths for crosstalk minimization. Two bandpass emission filters with center wavelengths of 585 nm and 650 nm (ET585/65m, ET650/45x, Chroma, Bellows Falls, VT, USA) were used for separate collection of the fluorescence signals.
A translational stage with a side-mounted micrometer (XR50P, Thorlabs) was placed on the bottom plate of the module for accurate position control of the specimen. A custom-made plate was fixed on top of the micrometer stage to hold the specimen strip. The module was designed to ensure convenient switching of the emission optical filters, which were placed between the parabolic metal structure and the smartphone camera. Once the conjugates were dropped onto the specimen strip, it was inserted onto the stage. Initial detection was tested on the CL position, which showed fluorescence in all cases. The most accurate position was found by adjusting the actuator of the stage, and the signal data was analyzed using a smartphone application and sent to an online server. Analysis of the signal was based on the pictures taken by the smartphone's camera. A mobile app for the smartphone determines the intensity of the whole fluorescent area in addition to the band area. The smartphone's camera acquires the collected fluorescent light, and the total intensities are estimated by averaging the pixel intensity values.
The reflective light concentrator structure with an LED module and the smartphone's camera aperture were placed close to each other as previously described [13]. The reflectors were coated with aluminum to improve the light reflection. The reflectivity of aluminum coating was about 90% in the visible wavelength range. The smartphone used in this study had an 8-million-pixel camera. Diagnostic results, including positive and negative virus infection decisions based on the cut-off value along with the measurement locations, were automatically posted on an online database.
Clinical study cohort
The proposed diagnostic system was evaluated at the National Institute of Hygiene and Epidemiology (NIHE), Hanoi, Vietnam, with throat swab samples from H5N1-confirmed patients (n = 14) listed by the WHO between 2003-2010.
For the H5N1-negative control group, Vietnamese patients with an unknown disease (n = 3), respiratory syncytial virus (RSV) (n = 17), metapneumovirus (MPV) (n = 4), bocavirus (HBO) (n = 2), parainfluenza virus (PIV) (n = 5), human rhinovirus (HRV) (n = 5), co-infection of RSV and coronavirus (CoV) (n = 1), CoV NL63 (n = 2), co-infection of human enterovirus (HEV) and CoV (n =1), and a Korean patient with unknown disease (n = 1) were tested using SRDFDS. This research was approved by the Wonkwang University Hospital Institutional Review Board (approval no.: WKIRB-201607-HRBR-078).
All patients had an acute respiratory infection and agreed to participate in the study, and informed consents were processed before taking specimens. Nucleic acid was extracted from specimens from all patients using the RNeasy Mini kit (Qiagen, Mississauga, ON, Canada) and amplified by commercial multiplex assay (Seegene Inc., Seoul, Korea). The R-Mix rapid cell culture method (Quidel, San Diego, CA, USA) was used for the diagnoses of specimens.
For the rapid test, patient throat swab samples were directly applied to assays, and results were read in 20 min.
Statistics
The mean, SD, linear regression, Student's t-test, and one-way analysis of variance (ANOVA) were conducted using GraphPad Prism. Results were presented as the mean ± SD. Statistical analysis was performed using a one-way ANOVA between multiple groups. A value of P < 0.05 was considered significant. ROC curves and 95% CIs were computed to confirm assay sensitivity and specificity.
Supplementary Material
Supplementary figures.
Competing Interests
The authors have declared that no competing interest exists.
References
1. WHO. Avian and other zoonotic influenza. 2018.
2. Poovorawan Y, Pyungporn S, Prachayangprecha S, Makkoch J. Global alert to avian influenza virus infection: from H5N1 to H7N9. Pathog Glob Health. 2013;107:217-23
3. Bottcher L, Woolley-Meza O, Araujo NA, Herrmann HJ, Helbing D. Disease-induced resource constraints can trigger explosive epidemics. Sci Rep. 2015;5:16571
4. Chen Y, Wang D, Zheng S, Shu Y, Chen W, Cui D. et al. Rapid diagnostic tests for identifying avian influenza A(H7N9) virus in clinical samples. Emerg Infect Dis. 2015;21:87-90
5. Baumann R, Kaempfer S, Chegou NN, Oehlmann W, Loxton AG, Kaufmann SH. et al. Serologic diagnosis of tuberculosis by combining Ig classes against selected mycobacterial targets. J Infect. 2014;69:581-9
6. Ma X, Xu H, Shi L, Yang P, Zhang L, Sun X. et al. A multiplex PCR assay for the detection of five influenza viruses using a dual priming oligonucleotide system. BMC Infect Dis. 2015;15:93
7. Cui D, Zhao D, Xie G, Yang X, Huo Z, Zheng S. et al. Simultaneous detection of influenza A subtypes of H3N2 virus, pandemic (H1N1) 2009 virus and reassortant avian H7N9 virus in humans by multiplex one-step real-time RT-PCR assay. Springerplus. 2016;5:2054
8. Araz MK, Tentori AM, Herr AE. Microfluidic Multiplexing in Bioanalyses. Journal of Laboratory Automation. 2013;18:350-66
9. Dincer C, Bruch R, Kling A, Dittrich PS, Urban GA. Multiplexed Point-of-Care Testing - xPOCT. Trends Biotechnol. 2017;35:728-42
10. Mohd Hanafiah K, Arifin N, Bustami Y, Noordin R, Garcia M, Anderson D. Development of Multiplexed Infectious Disease Lateral Flow Assays: Challenges and Opportunities. Diagnostics (Basel). 2017:7
11. Yeo SJ, Bao DT, Seo GE, Bui CT, Kim DTH, Anh NTV. et al. Improvement of a rapid diagnostic application of monoclonal antibodies against avian influenza H7 subtype virus using Europium nanoparticles. Sci Rep. 2017;7:7933
12. Yeo SJ, Huong DT, Hong NN, Li CY, Choi K, Yu K. et al. Rapid and quantitative detection of zoonotic influenza A virus infection utilizing coumarin-derived dendrimer-based fluorescent immunochromatographic strip test (FICT). Theranostics. 2014;4:1239-49
13. Yeo SJ, Choi K, Cuc BT, Hong NN, Bao DT, Ngoc NM. et al. Smartphone-Based Fluorescent Diagnostic System for Highly Pathogenic H5N1 Viruses. Theranostics. 2016;6:231-42
14. Sakurai A, Takayama K, Nomura N, Kajiwara N, Okamatsu M, Yamamoto N. et al. Fluorescent immunochromatography for rapid and sensitive typing of seasonal influenza viruses. PLoS One. 2015;10:e0116715
15. Li Y, Hong M, Lin Y, Bin Q, Lin Z, Cai Z. et al. Highly sensitive electrochemical immunoassay for H1N1 influenza virus based on copper-mediated amplification. Chem Commun (Camb). 2012;48:6562-4
16. Zhang P, Vemula SV, Zhao J, Du B, Mohan H, Liu J. et al. A highly sensitive europium nanoparticle-based immunoassay for detection of influenza A/B virus antigen in clinical specimens. J Clin Microbiol. 2014;52:4385-7
17. Shah KG, Singh V, Kauffman PC, Abe K, Yager P. Mobile Phone Ratiometric Imaging Enables Highly Sensitive Fluorescence Lateral Flow Immunoassays without External Optical Filters. Anal Chem. 2018;90:6967-74
18. Miller AC, Singh I, Koehler E, Polgreen PM. A Smartphone-Driven Thermometer Application for Real-time Population- and Individual-Level Influenza Surveillance. Clin Infect Dis. 2018;67:388-97
19. Huang S, Abe K, Bennett S, Liang T, Ladd PD, Yokobe L. et al. Disposable Autonomous Device for Swab-to-Result Diagnosis of Influenza. Anal Chem. 2017;89:5776-83
20. Ra M, Muhammad MS, Lim C, Han S, Jung C, Kim WY. Smartphone-Based Point-of-Care Urinalysis Under Variable Illumination. IEEE J Transl Eng Health Med. 2018;6:2800111
21. King K, Grazette LP, Paltoo DN, McDevitt JT, Sia SK, Barrett PM. et al. Point-of-Care Technologies for Precision Cardiovascular Care and Clinical Research: National Heart, Lung, and Blood Institute Working Group. JACC Basic Transl Sci. 2016;1:73-86
22. Adiguzel Y, Kulah H. CMOS cell sensors for point-of-care diagnostics. Sensors (Basel). 2012;12:10042-66
23. Ozkan H, Kayhan OS. A Novel Automatic Rapid Diagnostic Test Reader Platform. Comput Math Methods Med. 2016;2016:7498217
24. McGonigle AJS, Wilkes TC, Pering TD, Willmott JR, Cook JM, Mims FM. et al. Smartphone Spectrometers. Sensors (Basel). 2018:18
25. Jun B-H, Hwang DW, Jung HS, Jang J, Kim H, Kang H. et al. Ultrasensitive, biocompatible, quantum-dot-embedded silica nanoparticles for bioimaging. Adv Funct Mater. 2012;22:1843-9
26. Medintz IL, Uyeda HT, Goldman ER, Mattoussi H. Quantum dot bioconjugates for imaging, labelling and sensing. Nature materials. 2005;4:435-46
27. Zhang Y, Wang TH. Quantum dot enabled molecular sensing and diagnostics. Theranostics. 2012;2:631-54
28. Bruno JG. Application of DNA Aptamers and Quantum Dots to Lateral Flow Test Strips for Detection of Foodborne Pathogens with Improved Sensitivity versus Colloidal Gold. Pathogens. 2014;3:341-55
29. Wu R, Zhou S, Chen T, Li J, Shen H, Chai Y. et al. Quantitative and rapid detection of C-reactive protein using quantum dot-based lateral flow test strip. Anal Chim Acta. 2018;1008:1-7
30. Chen Z, Liang R, Guo X, Liang J, Deng Q, Li M. et al. Simultaneous quantitation of cytokeratin-19 fragment and carcinoembryonic antigen in human serum via quantum dot-doped nanoparticles. Biosens Bioelectron. 2017;91:60-5
31. Di Nardo F, Anfossi L, Giovannoli C, Passini C, Goftman VV, Goryacheva IY. et al. A fluorescent immunochromatographic strip test using Quantum Dots for fumonisins detection. Talanta. 2016;150:463-8
32. Zhang P, Lu H, Chen J, Han H, Ma W. Simple and sensitive detection of HBsAg by using a quantum dots nanobeads based dot-blot immunoassay. Theranostics. 2014;4:307-15
33. Wu F, Yuan H, Zhou C, Mao M, Liu Q, Shen H. et al. Multiplexed detection of influenza A virus subtype H5 and H9 via quantum dot-based immunoassay. Biosens Bioelectron. 2016;77:464-70
34. Wu M, Zhang ZL, Chen G, Wen CY, Wu LL, Hu J. et al. Rapid and Quantitative Detection of Avian Influenza A(H7N9) Virions in Complex Matrices Based on Combined Magnetic Capture and Quantum Dot Labeling. Small. 2015;11:5280-8
35. Chen L, Sheng Z, Zhang A, Guo X, Li J, Han H. et al. Quantum-dots-based fluoroimmunoassay for the rapid and sensitive detection of avian influenza virus subtype H5N1. Luminescence. 2010;25:419-23
36. Mussa Farkhani S, Valizadeh A. Review: three synthesis methods of CdX (X = Se, S or Te) quantum dots. IET Nanobiotechnol. 2014;8:59-76
37. Yu WW, Chang E, Drezek R, Colvin VL. Water-soluble quantum dots for biomedical applications. Biochem Biophys Res Commun. 2006;348:781-6
38. Shen H, Yuan H, Niu JZ, Xu S, Zhou C, Ma L. et al. Phosphine-free synthesis of high-quality reverse type-I ZnSe/CdSe core with CdS/Cd(x)Zn(1 - x)S/ZnS multishell nanocrystals and their application for detection of human hepatitis B surface antigen. Nanotechnology. 2011;22:375602
39. Mason BD, Zhang-van Enk J, Zhang L, Remmele RL Jr, Zhang J. Liquid-liquid phase separation of a monoclonal antibody and nonmonotonic influence of Hofmeister anions. Biophys J. 2010;99:3792-800
40. Thomsson O, Strom-Holst B, Sjunnesson Y, Bergqvist AS. Validation of an enzyme-linked immunosorbent assay developed for measuring cortisol concentration in human saliva and serum for its applicability to analyze cortisol in pig saliva. Acta Vet Scand. 2014;56:55
41. Coppe BC, Borille BT, Fiorentin TR, Jacques AL, Fagundes AC, Castro SM. et al. Multianalytical Method Validation for Qualitative and Quantitative Analysis of Solvents of Abuse in Oral Fluid by HS-GC/MS. Int J Anal Chem. 2016;9:1029286
42. CDC. Highly Pathogenic Asian Avian Influenza A (H5N1) in People. 2015.
43. Nguyen LT, Nakaishi K, Motojima K, Ohkawara A, Minato E, Maruyama J. et al. Rapid and broad detection of H5 hemagglutinin by an immunochromatographic kit using novel monoclonal antibody against highly pathogenic avian influenza virus belonging to the genetic clade 2.3.4.4. PLoS One. 2017;12:e0182228
44. Zhang B, Wang X, Liu F, Cheng Y, Shi D. Effective reduction of nonspecific binding by surface engineering of quantum dots with bovine serum albumin for cell-targeted imaging. Langmuir. 2012;28:16605-13
45. Li Z, Wang Y, Wang J, Tang Z, Pounds JG, Lin Y. Rapid and sensitive detection of protein biomarker using a portable fluorescence biosensor based on quantum dots and a lateral flow test strip. Anal Chem. 2010;82:7008-14
46. Zorn G, Dave SR, Weidner T, Gao X, Castner DG. Direct Characterization of Polymer Encapsulated CdSe/CdS/ZnS Quantum Dots. Surf Sci. 2016;648:339-44
47. Changhua Zhou HY, Huaibin Shen, Yi Guo, Xiaomin Li, Dan Liu, Li Xu, Lan Ma, Li SL. Synthesis of size-tunable photoluminescent aqueous CdSe/ZnS microspheres via a phase transfer method with amphiphilic oligomer and their application for detection of HCG antigen. J Mater Chem. 2011;21:7393-400
48. Cui ZQ, Ren Q, Wei HP, Chen Z, Deng JY, Zhang ZP. et al. Quantum dot-aptamer nanoprobes for recognizing and labeling influenza A virus particles. Nanoscale. 2011;3:2454-7
49. Li X, Lu D, Sheng Z, Chen K, Guo X, Jin M. et al. A fast and sensitive immunoassay of avian influenza virus based on label-free quantum dot probe and lateral flow test strip. Talanta. 2012;100:1-6
50. de Jong MD, Simmons CP, Thanh TT, Hien VM, Smith GJ, Chau TN. et al. Fatal outcome of human influenza A (H5N1) is associated with high viral load and hypercytokinemia. Nat Med. 2006;12:1203-7
51. Nie S, Roth RB, Stiles J, Mikhlina A, Lu X, Tang YW. et al. Evaluation of Alere i Influenza A&B for rapid detection of influenza viruses A and B. J Clin Microbiol. 2014;52:3339-44
52. Chapin KC, Flores-Cortez EJ. Performance of the molecular Alere I influenza A&B test compared to that of the xpert flu A/B assay. J Clin Microbiol. 2015;53:706-9
53. Lee GC, Jeon ES, Kim WS, Le DT, Yoo JH, Chong CK. Evaluation of a rapid diagnostic test, NanoSign(R) Influenza A/B Antigen, for detection of the 2009 pandemic influenza A/H1N1 viruses. Virol J. 2010;7:244
54. Yoo Y, Sohn JW, Park DW, Kim JY, Shin HK, Lee Y. et al. Clinical evaluation of the SD Bioline influenza virus antigen test for rapid detection of influenza viruses A and B in children and adults during the influenza season. Clin Vaccine Immunol. 2007;14:1050-2
55. Peter Reiss JB, Adam Pron. Highly Luminescent CdSe/ZnSe Core/Shell Nanocrystals of Low Size Dispersion. Nano letters. 2002;2:781-4
56. Li JJ, Wang YA, Guo W, Keay JC, Mishima TD, Johnson MB. et al. Large-scale synthesis of nearly monodisperse CdSe/CdS core/shell nanocrystals using air-stable reagents via successive ion layer adsorption and reaction. J Am Chem Soc. 2003;125:12567-75
57. Pong BK, Trout BL, Lee JY. Modified ligand-exchange for efficient solubilization of CdSe/ZnS quantum dots in water: a procedure guided by computational studies. Langmuir. 2008;24:5270-6
58. Tian LJ, Zhou NQ, Liu XW, Zhang X, Zhu TT, Li LL. et al. Fluorescence dynamics of the biosynthesized CdSe quantum dots in Candida utilis. Sci Rep. 2017;7:2048
Author contact
![]() Corresponding author: Hyun Park, MD, Ph, D: hyunpkac.kr
Corresponding author: Hyun Park, MD, Ph, D: hyunpkac.kr