Theranostics
13.3
Impact Factor
- Current Issue
- Advance Articles
- Volume 16; 2026
- Volume 15; 2025
- Volume 14; 2024
- Volume 13; 2023
- Volume 12; 2022
- Archive
- Cover Images
- Cover Suggestion
- Special Issues
Top
Introduction
Methods
Results
Discussion
Abbreviations
Supplementary Material
Acknowledgements
References
Introduction
Methods
Results
Discussion
Abbreviations
Supplementary Material
Acknowledgements
References
International Journal of Biological Sciences
International Journal of Medical Sciences
 Global reach, higher impact

Theranostics 2018; 8(20):5758-5771. doi:10.7150/thno.28944 This issue Cite
Research Paper
Virtual stenting with simplex mesh and mechanical contact analysis for real-time planning of thoracic endovascular aortic repair
Duanduan Chen1 ![]() , Jianyong Wei1, Yiming Deng2, Huanming Xu1, Zhenfeng Li1, Haoye Meng3, Xiaofeng Han4, Yonghao Wang1, Jia Wan5, Tianyi Yan1
, Jianyong Wei1, Yiming Deng2, Huanming Xu1, Zhenfeng Li1, Haoye Meng3, Xiaofeng Han4, Yonghao Wang1, Jia Wan5, Tianyi Yan1 ![]() , Jiang Xiong6
, Jiang Xiong6 ![]() , Xiaoying Tang1
, Xiaoying Tang1
1. School of Life Science, Beijing Institute of Technology, Beijing 100081, China
2. Department of Interventional Neuroradiology, Beijing Tiantan Hospital, Capital Medical University, Beijing 100050, China
3. Institute of Orthopedics, Chinese PLA General Hospital, Beijing 100083, China
4. Department of Diagnostic and Interventional Radiology, Beijing Anzhen Hospital, Capital Medical University, Beijing 100029, China
5. Department of Vascular Surgery, The Second People's Hospital of Yunnan Province, Kunming 650021, China
6. Department of Vascular and Endovascular Surgery, Chinese PLA General Hospital, Beijing 100083, China
Received 2018-8-2; Accepted 2018-10-6; Published 2018-11-10
Citation:
Chen D, Wei J, Deng Y, Xu H, Li Z, Meng H, Han X, Wang Y, Wan J, Yan T, Xiong J, Tang X. Virtual stenting with simplex mesh and mechanical contact analysis for real-time planning of thoracic endovascular aortic repair. Theranostics 2018; 8(20):5758-5771. doi:10.7150/thno.28944. https://www.thno.org/v08p5758.htm
Other stylesAbstract

In aortic endovascular repair, the prediction of stented vessel remodeling informs treatment plans and risk evaluation; however, there are no highly accurate and efficient methods to quantitatively simulate stented vessels. This study developed a fast virtual stenting algorithm to simulate stent-induced aortic remodeling to assist in real-time thoracic endovascular aortic repair planning.
Methods: The virtual stenting algorithm was established based on simplex deformable mesh and mechanical contact analysis. The key parameters of the mechanical contact analysis were derived from mechanical tests on aortic tissue (n=40) and commonly used stent-grafts (n=6). Genetic algorithm was applied to select weighting parameters. Testing and validation of the algorithm were performed using pre- and post-treatment computed tomography angiography datasets of type-B aortic dissection cases (n=66).
Results: The algorithm was efficient in simulating stent-induced aortic deformation (mean computing time on a single processor: 13.78±2.80s) and accurate at the morphological (curvature difference: 1.57±0.57%; cross-sectional area difference: 4.11±0.85%) and hemodynamic (similarity of wall shear stress-derived parameters: 90.16-90.94%) levels. Stent-induced wall deformation was higher (p<0.05) in distal stent-induced new entry cases than in successfully treated cases, and this deformation did not differ significantly among the different stent groups. Additionally, the high stent-induced wall deformation regions and the new-entry sites overlapped, indicating the usefulness of wall deformation to evaluate the risks of device-induced complications.
Conclusion: The novel algorithm provided fast real-time and accurate predictions of stent-graft deployment with luminal deformation tracking, thereby potentially informing individualized stenting planning and improving endovascular aortic repair outcomes. Large, multicenter studies are warranted to extend the algorithm validation and determine stress-induced wall deformation cutoff values for the risk stratification of particular complications.
Keywords: Virtual stenting, Simplex deformable mesh, Mechanical analysis, Thoracic endovascular aortic repair, Virtual angiography
Introduction
Successful thoracic endovascular aortic repair (TEVAR) of type-B aortic dissection (TBAD) requires the appropriate selection and precise positioning of a stent-graft to seal the primary tear and reconstitute the elastic aorta [1, 2]. The primary tear is often located distal to the left subclavian artery and the dissection can significantly squeeze the true lumen. The high curvature and large tapering of the stenting region poses a challenge (Figure 1). Inadequate contact between the stent-graft and the fragile aortic wall and intimal flap may lead to device-related post-TEVAR complications, such as type I endoleak, stent-induced new entry (SINE), and retrograde type-A dissection (RTAD), which can be more dangerous than the dissection itself; in fact, SINE and RTAD have reported mortality rates of 26.1% and 37.5%, respectively [3-6].
Retrospective studies have shown that careful stent-graft selection (appropriate oversizing, for example) and implantation planning reduce the risk of TEVAR-related complications [4, 7, 8]. However, guidance on stent-graft selection in TBAD remains unclear, with reported oversizing ratio ranging from 0 to 32% [4]. Comprehensive and accurate real-time 3-D simulations of stent-graft deployment and aortic remodeling might help overcome the current inadequacies of individualized stent-graft fitting and improve treatment outcomes as well as future device design [9].
Considerable effort has been invested in the numerical simulations of stenting, and these simulations have focused on the interaction between the stent and the vessel wall as well as post-stenting flow prediction. Most of the structural studies use the finite element method [10-12], and the flow computations usually use computational fluid dynamics [13, 14]. Both methods solve complicated mechanical equations based on volume mesh and are thus time-consuming. Although these studies have greatly contributed to stent treatment planning and device optimization [12, 15, 16], they may not be able to provide real-time guidance in clinical practice. Advanced numerical methods that can precisely simulate the stent-induced morphological changes in the vessel in real time are needed.
Virtual stenting algorithms (VSAs) that aim to provide time-efficient simulations for treatment plans are one of the solutions [17]. Pioneered by Larrabide and colleagues, constrained simplex deformable models have been proposed; these models embed the detailed stent geometry into the mesh and achieve favorable execution time [18, 19]. Spranger and Ventikos developed a fast simulation algorithm based on a spring-like dynamic mesh; the linear spring analogy method was proposed to be suitable for modeling stent expansion [20-23]. Zhao and colleagues applied a simplex mesh with a ball-sweeping model, accelerating the computation by removing collision detection and iteratively radial expansion of the virtual stents [24]. Recently, Zhong and colleagues proposed a simulation based on an active contour model applied in aneurysm models [25]. Based on different deformable mesh techniques, these studies have made important contributions to treatment planning. However, the vessel wall is considered rigid; in other words, stent-induced vessel modifications are not considered. This limits the application of these methods in aortic studies, especially for TBAD, where the stent-graft is used to divert the flow and, more importantly, to reshape the collapsed true lumen. To achieve this, an appropriate contact model should be established along with the deformable mesh [26] to precisely simulate stent-induced aortic deformation with rapid execution time. We therefore developed and validated a new fast virtual stent-graft deployment algorithm based on deformable simplex mesh and mechanical contact analysis to provide functional predictions for main vasculatures post-stenting.
Methods
This study was approved by the Institutional Review Board of the Chinese PLA General Hospital (S201703601). The development of VSA involved three main steps: imaging acquisition of the patients and stent-grafts to provide geometric models of the aorta and device; tissue sample and stent-graft collection for mechanical tests to extract parameters for the mechanical contact analysis; and integration of deformable simplex meshes and contact procedures. The VSA was validated with morphological and hemodynamic analyses involving computational fluid dynamics (CFD). The potential usefulness of the algorithm in terms of the potential prediction of device-related complications was assessed.
Patients, Stent-grafts and Tissues
Patients and Stent-grafts. Sixty-six patients were diagnosed with acute TBAD within fourteen days of symptom onset. Patients with tissue disorders were excluded. All patients underwent TEVAR with the implantation of six types of stent-grafts, including cTAG (W L Gore & Associates, Inc, US), Valiant (Medtronic, Inc, US), Zenith (Cook Group, Inc, US), Hercules (MicroPort Scientific Co, Ltd., China), Ankura (LifeTech Scientific Co, Ltd., China), Grimed (Grikin Advanced Materials Co, Ltd., China). The patients were categorized accordingly into six stent-graft groups, and their baseline characteristics are summarized in Table 1 and S1 in the Supplementary Material. Among the six groups, the age and sex of the patients as well as the treatment and imaging time intervals were similarly distributed.
Tissue. Intimal flap tissue was obtained from 40 hypertensive patients with type-A aortic dissection who had undergone aortic replacement via open surgery. Patients with tissue disorders were excluded. Aortic wall tissue was obtained from 10 patients with rheumatic heart disease and/or heart valve-related diseases who had undergone ascending aortic replacement or the Bentall procedure. The baseline characteristics of the patients are listed in Table 1.
Imaging Acquisition and Geometry Reconstruction. CTA datasets were acquired before and after stent-graft implantation using a dual-source CT scanner (SOMATOM Definition Flash, Siemens, Germany). Structural information for the six types of stent-grafts was extracted via a micro-CT scanner (GE Healthcare Explore Locus, USA). The detailed parameters of CTA and micro-CT scans are described in S2, Supplementary Materials. Image segmentation and surface reconstruction of the aorta and stent-grafts were accomplished via Mimics (Materialise, Belgium). Typical axial slices of CTA of TBAD and micro-CT of stent-grafts for the 3-D reconstructed models are displayed in Figure 2A and B.
Figure 1
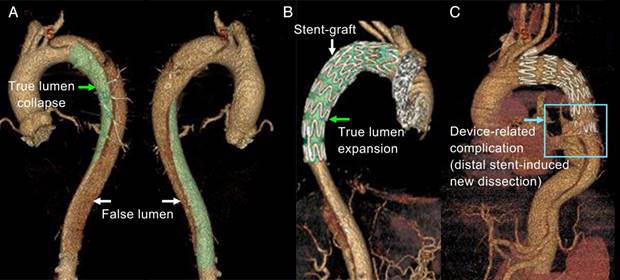
3D reconstruction of aortic dissection based on CTA datasets. (A) shows the collapsed true lumen before stenting; (B) shows the reshaped true lumen post-TEVAR; and (C) shows one of the device-induced complications - distal stent-induced new.
Table 1
Baseline characteristics and treatment/imaging timing of the patients*
| Patients who underwent TEVAR | ||||||||
| Baseline characteristics and imaging timing | cTAG n=10 | Zenith n=10 | Valiant n=10 | Ankura n=10 | Hercules n=10 | Grimed n=8 | P | SINE n=8 |
| Age [years] | 50.2 | 53.8 | 47.6 | 56.9 | 57.6 | 54.88 | 0.244 | 54.86 |
| (13.53) | (9.46) | (10.47) | (10.79) | (8.15) | (9.14) | (10.45) | ||
| Men [%] | 10 | 10 | 7 | 9 | 8 | 8 | 0.137 | 7 |
| [100] | [100] | [70] | [90] | [80] | [100] | [100] | ||
| Time 1 [days] | 11.40 | 12.30 | 9.20 | 12.50 | 10.40 | 10.60 | 0.943 | 11.42 |
| (7.20) | (7.51) | (5.27) | (10.00) | (10.20) | (6.70) | (8.90) | ||
| Time 2 [days] | 5.10 | 7.50 | 8.00 | 7.00 | 3.90 | 6.90 | 0.245 | 7.43 |
| (1.29) | (5.60) | (4.92) | (5.29) | (2.42) | (3.76) | (5.30) | ||
| Time 3 [days] | 9.70 | 15.50 | 7.50 | 5.90 | 9.60 | 10.00 | 0.322 | 8.57 |
| (6.77) | (10.78) | (4.74) | (4.07) | (9.31) | (7.25) | (6.50) | ||
| Time 4 [days] | 14.80 | 23.00 | 15.50 | 12.90 | 13.50 | 16.88 | 0.870 | 15.00 |
| (7.80) | (11.03) | (7.47) | (4.63) | (8.13) | (7.57) | (7.80) | ||
| Patients who underwent open surgery | ||||||||
| Baseline characteristics | Aortic dissection (n=40) | Normal (n=10) | ||||||
| Age [years] | 51.70 (12.71) | 60.00 (5.88) | ||||||
| Men [%] | 33 [82.50] | 3 [30.00] | ||||||
| Hypertension [%] | 40 [100] | - | ||||||
| Coronary heart disease [%] | 5 [12.50] | - | ||||||
| Cerebrovascular disease [%] | 11 [27.50] | - | ||||||
* - The age and timing data are presented as the mean (standard deviation).
Time 1 - The period from onset to TEVAR operation.
Time 2 - The period from the CTA scan at initial presentation to TEVAR treatment.
Time 3 -The period from TEVAR treatment to second CTA.
Time 4 -The period from pre- to post-TEVAR CTA.
Fast Virtual Stent-graft Algorithm
Mesh Pre-processing. Stent-grafts were implanted into the true lumen (TL) for all included patients. Thus, the TL for each pre-treatment aortic model was separated for VSA development. A cylindrical structure with a radius much smaller than the TL was generated around its centerline to mimic the initial folded state of virtual stent-grafts (Figure 2C). 3-D models for the TL and virtual stent-graft were first discretized with triangular mesh and then transformed into 2-simplex mesh (Figure 2D). In ℝ3, the 2-simplex mesh is the topological dual of a triangulation. Each vertex Pi on the simplex mesh is the centroid of a triangle facet. After transformation, the struts of the real stent-graft were mapped onto the virtual stent-graft, dividing the simplex vertices into strut and background groups.
Mechanical Contact-Simplex Model. Deformable simplex mesh has been used in object reconstruction [27] and constrained deformation [28] to describe mesh motion under internal and external forces (S3, Supplementary Materials). For stenting studies, deformable simplex mesh has been used to develop fast contouring simulations for stenting in cerebral aneurysms [18, 19]; however, the vessel wall was considered rigid. In this study, we developed a new VSA that considers stented vessel deformation. The algorithm entails two periods: stent-graft unfolding without contact with the aortic wall (Period-1) and mechanical contact with the wall (Period-2).
During Period-1, expansion of the stent-graft is driven by its self-expanding force. As shown in Figure 2E, the normal component of this force is along the local normal of the plane ni that is defined by the three neighboring points (PiN1, PiN2, PiN3) of Pi; while the tangent component is along the local tangential ei that is in the plane of (PiN1, PiN2, PiN3), based on the intersecting points between fi and the plane and directed towards the center of the circle Ci defined by (PiN1, PiN2, PiN3). In TEVAR, the tangential force component is neglected because the length variation of the stent-graft during deployment is trivial. Thus, the internal force constraint can be simplified as in Eq.1 by assuming a linear relationship of the self-expansion radial force and the displacement. Parameters ES and χ are derived based on radial compressive tests on the six types of stent-grafts. |δPi| is the distance between the vertex Pi and its counterpart along the diameter. FRF is the stent-graft radial force with 10% oversizing of the aorta (which is commonly used in treating TBAD). DS is the diameter of stent-grafts at the resting state (averaged along the stent-graft length).
Figure 2
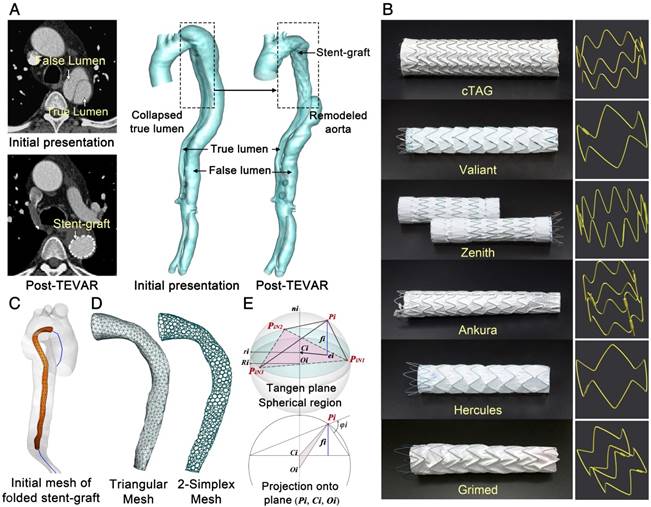
(A-B) CTA and micro-CT images and corresponding 3-D reconstructed models. (C) Centerline extraction and initial mesh of the virtual stent-graft. (D) Mesh transformation from triangular to simplex elements. (E) Geometric relationships of single point movement.
Eq.1
During Period-2, a criterion distance between the stent-graft and aortic wall ε (=0.1mm) was introduced to determine contact initiation. Contact involves the interaction of the outward expansion force of the stent-grafts and the inward resistant force of the TL [26], the main force component of which is also along the radial direction. The outward expanding constraint is described as Eq.1, while the inward aortic resistant constraint is dependent on aortic elasticity. In this study, a modified Mooney-Rivlin strain energy density function was used to numerically model the elastic behavior of the TL. The external force constraint is shown in Eq.2, in which, the mechanical constants C1, D1 and D2 were obtained by tensile tests of dissected and normal aortic tissue. The Poisson ratio ν was assigned a value of 0.45, and the resistant stress σV corresponded to that of 10% oversizing of the aorta in the proximal landing zone. The stretch ratio λ in the circumferential direction can be calculated based on the variation of the vessel diameter (= |δPi|/DVi).
Eq.2
The external and internal force constraints were integrated into the motion equation and discretized (Eq.3), where μ and ξ are weighting parameters to balance the two constraints, ranging from 0.5 to 1.5 and 0 to 1, respectively. Selecting these parameters for each stent-graft was achieved by applying genetic algorithm to 20% of patient cases in each group with sixty generations with the optimization goal of minimum cross-sectional and curvature difference between the post-TEVAR CTA-reconstructed model and the VSA-simulated model. The resulting values of μ for the cTag, Valiant, Zenith, Ankura, Hercules, and Grimed groups were 1.34, 0.92, 0.81, 1.26, 0.76, and 0.71, respectively, and those for ξ were 0.58, 0.51, 0.54, 0.56, 0.43, and 0.42, respectively. The damping factor assigned was γ = 0.9.
Eq.3
Mechanical Tests
Radial Compressive Tests on the Stent-grafts. Radial compressive tests were performed on a circular fixture radial compression platform (Large Twin-Cam™ Compression Station) (diameter resolution: 0.95μm; radial force resolution: 0.005N; diameter range: 0-60mm; and depth: 124mm). Along each stent-graft (n=6), radial compressive tests were conducted regionally on the proximal and distal strut rings and three rings with repeating patterns in the main body (Figure 3A), and these tests were repeated five times. The measuring depth ranged from 11mm to 33mm, while the radial deformation varied between 4.25mm and 7.38mm, which was approximately 16.7% of the original diameter of the stent-grafts. The details of the measurements are described in S4, Supplementary Material.
Figure 3
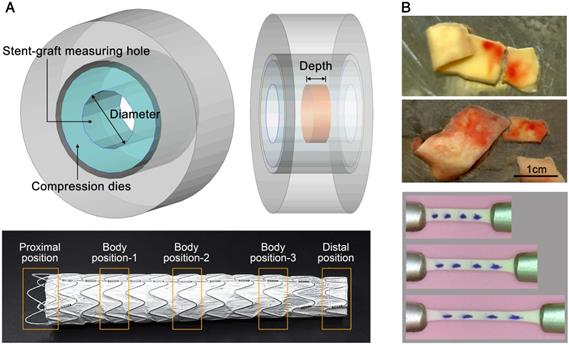
(A) Radial compressive test of the stent-grafts. (B) Tissue samples and image records of the tensile tests.
Uniaxial Tensile Test on Aortic Tissue. Tissue samples (n=40) were thawed in physiological saline solution at 37°C. Each sample was cut into several strips along the circumferential direction identified during acquisition, resulting in a total of 63 and 11 strips for dissection and normal groups, respectively. Tensile tests were performed using a traction machine (TechDouble-Aorta) (load cell accuracy: 0.0002N; stepper motor resolution: 2μm; CCD camera image: 1366x768pixels; viewing field: 48x27mm2; and recording frequency: 10 frame/s). Several markers were put on top of the tissue to trace and compute the stretching λ in the central region (Figure 3B). By assuming incompressible material, the Cauchy stress σ could be calculated. An energy-based average model [29] was used to compute representative data for the stress-stretch relationship and thus to obtain the material constants C1, D1 and D2 for Eq.2.
Hemodynamic Analysis and CFD
Hemodynamics analyses were conducted based on post-TEVAR CTA-reconstructed models and the corresponding VSA-simulated model. The same pulsatile velocity and pressure boundary conditions were assigned for each patient case (CTA-reconstructed model and VSA-simulated model) at the inlet and outlets. The inlet velocity boundary at the ascending aorta and the outlet velocity at the three aortic branches for each patient were obtained by ultrasound velocimetry as described in our previous study [30], and the outlet pressure boundaries at the abdominal branches and common iliac arteries for each patient were assigned according to [31]. The vessel walls of both the CTA-reconstructed and VSA-simulated models were assumed to be rigid. The detailed assignments and waveforms of the velocity and pressure boundary conditions are described in S5, Supplementary Material.
In this study, the blood was considered Newtonian and incompressible (density: 1044kg/m3; dynamic viscosity: 0.00365kg∙m-1∙s-1). A test of the fluid property, Newtonian or non-Newtonian, has been conducted on some of the studied models (S6, Supplementary Material) to confirm the rationality to apply the Newtonian model in the current aortic study. A finite volume solver, CFD-ACE+ (ESI Group, France), was employed with second-order accurate discretization and SIMPLEC-type pressure correction. Computation was conducted for five cardiac cycles. Velocity, pressure, wall shear stress and time-derived parameters were extracted during the last cycle.
In each computational model, the flow domain was discretized with tetrahedral elements in the core region and prismatic cells (10 layers) in the boundary layer near the aortic wall. Due to the size of the studied vascular domain, the grid resolution of the base models varies between 1,712,416 to 3,698,745 cells. The base time-step numbers per cardiac cycle for all of the models are assigned to 50. Temporal and spatial sensitivity studies were conducted to confirm the rationality of the base grids and base temporal resolution. The details of the sensitivity analyses are described in S7, Supplementary Material.
Statistical Analysis
Statistical Package for Social Science (SPSS, v20.0) was employed for all statistical analyses. ANOVAs were used to investigate between-group differences. ANOVAs with post hoc tests and Bonferroni corrections for multiple comparisons at p<0.05 were used to confirm group differences. Partial eta-squared was calculated to adjust for the effects of other independent variables and interactions.
Implementation of VSA
As shown in Figure 4, the VSA inputs included personal 3-D aorta masks reconstructed by CTA, inherent parameters of the selected stent-graft, and common mechanical parameters of the vessels and stent-grafts. The VSA output was stent-induced vessel wall deformation and its derived wall stress and hemodynamics. Post-TEVAR complications, such as endoleak and device-related vessel damage, can be estimated and predicted to potentially inform treatment plans and improve safety.
Figure 4
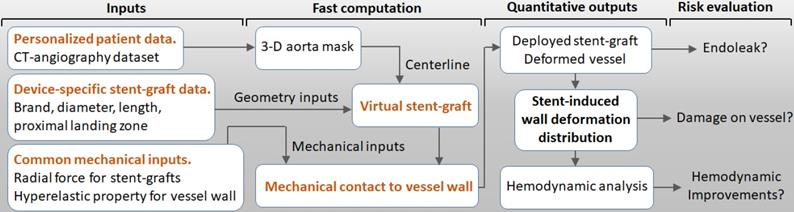
Workflow for the VSA-based stent planning system for TEVAR.
Results
The proposed VSA is designed based on deformable simplex mesh and mechanical contact analyses. The algorithm has been tested on sixty-six TBAD cases and validated by their corresponding post-TEVAR CTA datasets. In this section, common mechanical parameters of the stent-grafts and aortic wall, which are involved in the proposed VSA and were obtained by mechanical tests, are first described. Then, results of stent-graft deployment simulation by VSA are presented, together with validations of morphology and hemodynamics. Finally, analyses of the quantified stent-induced vessel wall deformations are described and its difference between successful group and distal SINE group is clarified.
Parameter Determination
Stent-grafts (ES, χ, and FRF). Figure 5A shows the displacement-force relationships when the stent-grafts are compressed to 16.7% of their diameter. All six stent-grafts showed a similar pattern: for small displacement, the curves were flat with trivial radial force variation, while for larger displacement beyond the inflection point, the radial force increased roughly linearly with increased displacement. In the latter section, the curves showed a hysteresis pattern, with the upper curves corresponding to the compression process and the lower ones corresponding to the deployment process. The mechanical input parameters of the stent-graft in the VSA could therefore be calculated by the normalized inflection position multiplied by 16.7% of each stent-graft (χ); the slope of the linear-fitted deployment curve divided by 16.7% (ES); and the radial force experienced with 10% oversizing (FRF). The mechanical parameters for the stent-grafts are listed in Table 2.
Aorta (C1, D1, D2 and σV). Figure 5B shows the stress-stretch relationships for the dissected and normal aortic tissues, with averaged data at each energy interval (square signs) and corresponding fitting curves (in black). Fitted material constants (C1, D1, and D2) were calculated using the modified Mooney-Rivlin strain energy density function and are listed in Table 2. The resistant stress of the aorta (σV) with 10% oversizing of the stent-graft was estimated by the stress with a circumferential stretch ratio of 1.1; its mean value was 0.0164MPa for the intimal flap and 0.0147MPa for a normal aorta.
Figure 5
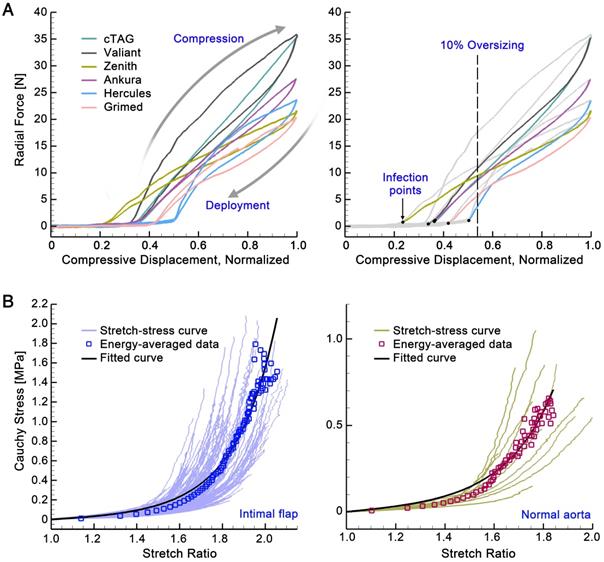
(A) Displacement-force relationships of the stent-grafts. (B) Stress-stretch relationships of the aortic tissues.
Table 2
Parameter values calculated based on mechanical tests
| Internal Constraints | |||||||
| Parameter | Unit | cTAG | Valiant | Zenith | Ankura | Hercules | Grimed |
| χ | - | 0.0601 | 0.0568 | 0.0384 | 0.0618 | 0.0835 | 0.0701 |
| ES | [N] | 297.25 | 286.35 | 145.21 | 229.28 | 224.01 | 178.50 |
| (R-square) | - | (0.9901) | (0.9929) | (0.9947) | (0.9968) | (0.9809) | (0.9864) |
| FRF | [N] | 8.9680 | 11.01 | 9.50 | 8.73 | 3.88 | 5.86 |
| External Constraints | |||||||
| Parameter | Unit | Intimal Flap | Normal Aorta | ||||
| C1 | [kPa] | 0.01046 | 0.04568 | ||||
| D1 | [kPa] | 7.5699 | 6.9056 | ||||
| D2 | - | 1.0930 | 1.1296 | ||||
Figure 6
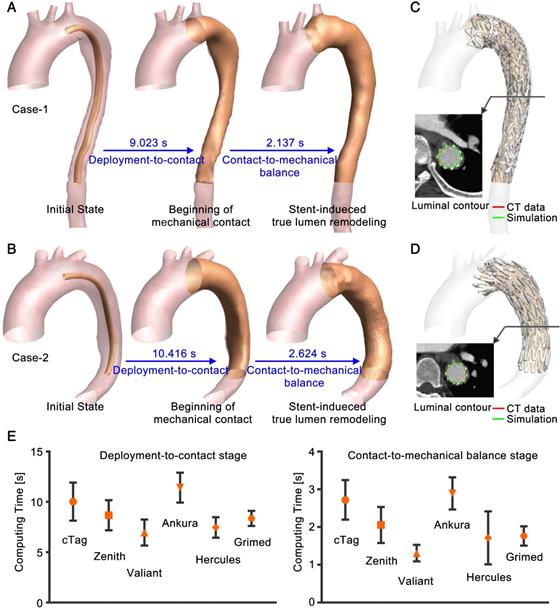
(A) and (B) Simulation process of two representative cases. (C) and (D) Comparison to post-TEVAR CTA data. Luminal contours of the CTA data (red) and simulation results (green) were extracted. (E) Statistical results for the computing time (mean value and standard deviation).
VSA Simulation of Stent-graft Deployment
Efficiency of VSA. Computations for all of the patient cases were conducted in Visual Studio C++ on one Inter(R) Core(TM) i7-6700k CPU @ 4.00GHz processor with 16GB of RAM. Computation of the VSA involves two periods: deployment-to-contact (Period-1) and contact-to-mechanical balance (Period-2). Figure 6A and B show the simulation process for two representative cases. On a single CPU, it takes seconds to compute the two stages. Upon mapping the post-TEVAR CTA-extracted stent-graft structure onto VSA-simulated vessels (Figure 6C and D), the rapid simulation showed good consistency with the imaging data. By extracting the contours of the simulated results (green curve) and of the imaging data (red curve), overlapping was found. Figure 6E shows the statistical analysis of computing time for the two stages. For the fifty-eight successfully treated cases, the computing times for each stage were 8.83±2.05s and 2.09±0.73s, and the overall simulation time was 13.78±2.84s; there were no significant differences (p=0.85) among the stent-graft groups.
Accuracy of the VSA. The accuracy of the simulated stenting results (VSA model) was evaluated at the morphological and hemodynamic levels by comparisons to the actual post-TEVAR CTA-reconstructed models (CTA model). In the morphological analysis, the cross-sectional area and curvature along the luminal centerline were compared between the VSA and CTA models (Figure 6A). In the stenting region, slices perpendicular to the centerline with equal intervals were extracted (Figure 7A). Areas (An, n=1-N) (due to the various lengths of the stented region, N was in the range of 26-55) were compared between the simulation (AnS) and CTA-reconstructed (AnCT) results, as DA=|(AnCT- AnS)/AnCT|. In addition, curvature of the nth node along the centerline (Cn, n=1-N) was quantified by calculating DC=|(CnCT- CnS)/CnCT|. The maximum area difference between the VSA and CTA models was less than 6% with mean difference of 4.11±0.85%; the maximum curvature difference was less than 3% with mean difference of 1.57±0.57% (Figure 7B). The area difference was due mainly to the uneven surface induced by the strut structures. Both morphological parameters confirmed the accuracy of this fast VSA algorithm.
In hemodynamic analyses, CFD analyses were used on the VSA and CTA models. Similar patterns and magnitudes of velocity were observed between the two models for each case (S8, Supplementary Material). Because the main morphological difference arose from the uneven surface of the stented region, hemodynamic parameters that are related mainly to vessel walls were further studied, including the time-averaged wall shear stress (TAWSS), oscillatory shear index (OSI), and relative residence time (RRT) (Figure 7C). In general, the distribution patterns of these hemodynamic parameters were similar between the two models for each patient case (the results of some other cases are shown in S8, Supplementary Material). To further quantify the similarities, an array of points (20x15) was extracted from the surface of the CTA (blue points) and VSA (red points) models to establish data matrices (Figure 7D). The consistency between the models was evaluated by pattern analysis via the average Hash algorithm (S8, Supplementary Material). The averaged consistency of TAWSS, OSI and RRT between the VSA and CTA models was 90.94%, 90.16%, and 90.23% (Figure 7E), respectively, confirming the accuracy of the proposed rapid VSA at the hemodynamic level.
Figure 7
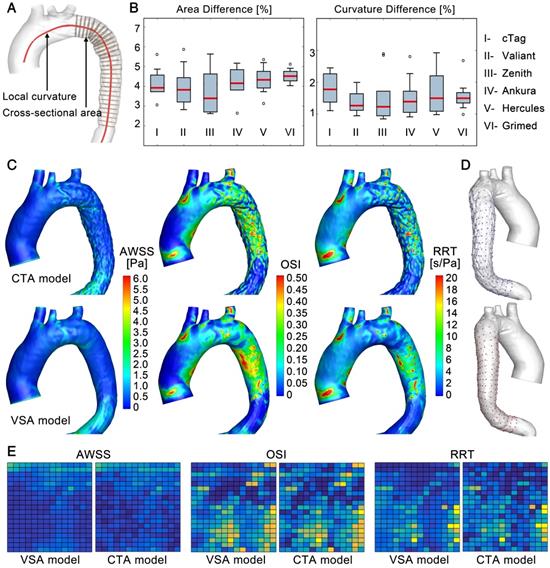
Morphological and hemodynamic comparisons between the CTA and VSA models. (A) and (B) Comparisons of cross-sectional areas and curvatures. (C) Comparison of WSS-derived parameters. (D) and (E) Data extraction and data array for the quantitative similarity study of WSS-derived parameters, respectively.
Figure 8
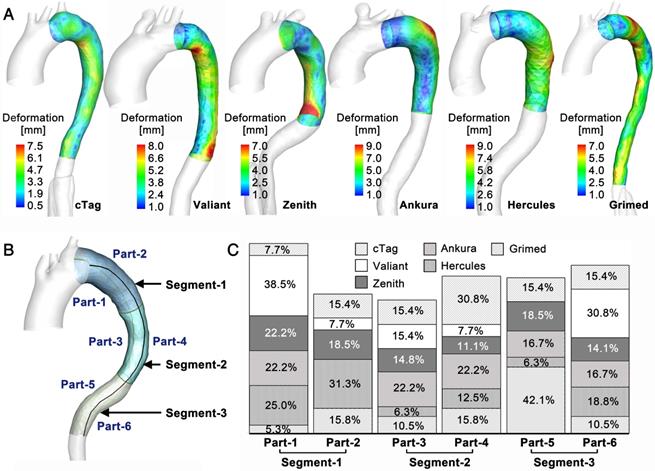
(A) Deformation distribution in the stented region of one representative case in each stent-graft group. (B) Division of the stented region. (C) High SWD distribution.
Stent-induced Vessel Wall Deformation
TL Deformation. The novel VSA allows the tracking of TL reshaping during stenting and the quantification of the balanced stent-induced vessel wall deformation (SWD). Figure 8A shows the representative SWD results for one patient from each stent-graft group (the results of other cases are presented in S9, Supplementary Material). Various patterns of SWD were apparent among the studied cases, and the maximum deformation varied between 7mm and 12mm. Although all fifty-eight cases underwent TEVAR successfully, there were regional high deformations. To further investigate the distribution pattern of high SWD, regions with deformation greater than 80% of the highest deformation in each case were identified. By dividing the stenting region into six parts (in Figure 8B, the stenting region was divided evenly into three segments along the longitudinal direction and each segment was divided into convex and concave parts), high SWD regions located in each part were counted, and their occurrence percentage relative to the overall high deformation distributions was calculated. Figure 8C displays the results of the high deformation distribution of the six parts. There was no significant difference among the stent-graft groups for the three segments (Segment-1: p=0.365, Segment-2: p=0.685, Segment-3: p=0.183).
Distal SINE. The novel fast VSA provides SWD measurements. Although the successfully treated cases showed various high SWD distribution patterns, the highest deformation was small. To further evaluate the risks of high SWD, eight patient cases with distal SINE were studied (the baseline characteristics are shown in Table 1 and described in S1, Supplementary Material). Previous studies have suggested a possible relationship between the distal oversizing of stent-grafts and the risk of SINE [3]. Deformation analysis provided by VSA may provide a quantitative assessment of this issue thereby informing stent-graft choice for particular patients.
Figure 9A shows a representative case of distal SINE. By comparing the CTA and VSA models, stent-induced tears and the highest SWD could be found at the distal end of the stent-graft; their locations were consistent. In general, SWD in the distal SINE group was greater than that in successfully treated cases. The mean deformation on the three segments defined in Figure 8B was calculated. Along the convex and concave curves of the stenting region, points at 5mm-intervals were extracted and their mean deformation was calculated. Furthermore, based on the position of primary entry at the initial presentation of each case, SWD on these convex/concave points was averaged along the tear side and the opposite tear side. The mean values were compared between the successful TEVAR and distal SINE cases. As shown in Figure 9E, there were no significant differences for these values among the stent-graft groups for successfully treated cases (p=0.183-0.903 and partial η2=0.041-0.144 in the various regions; detailed statistical data are described in S10, Supplementary Material); however, when comparing to the distal SINE group, SWD was significantly different in Segment-3 (SINE: 6.70±1.28mm vs. others: 3.31±0.66mm, p<0.01 and partial η2=0.224). The proposed VSA accurately predicted the reshaped vessel. By providing the quantitative parameter SWD, it may also assist in predicting distal SINE occurrence.
Figure 9
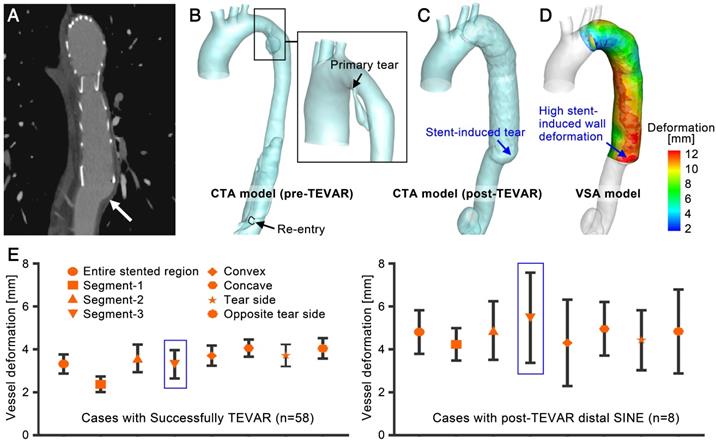
(A)-(D) A representative case of distal SINE comparing the CTA and VSA models. (E) Statistical analysis of the mean deformation in various regions between the successfully treated cases and those with distal SINE.
Discussion
In the present study, a novel VSA was developed based on deformable simplex mesh and mechanical contact analysis. In the fifty-eight patient-specific cases tested, simulations of stent-graft deployment and aortic reshaping using this algorithm required only 13.782±2.804s on a single processor. Comparisons to other methods (to the best of the authors' knowledge, Table 3 summarizes the computational time reported by other studies of stented vessels) underscore the efficiency of the proposed algorithm. Evaluation of the accuracy of the novel algorithm indicated that the rapid VSA achieved good consistency with actual stenting results at both the morphological and hemodynamic levels. Most of the trivial morphological differences came from the uneven surface of the stenting region; however, an evaluation of the influence of the uneven region on hemodynamic parameters, namely, TAWSS, OSI and RRT, which are sensitive to surface morphology, showed that they were approximately 90% similar between the CTA and VSA models according to the averaged Hash method. Notably, the hemodynamic analyses in this study were established based on the assumption of Newtonian flow. Due to the high shear rates and low particle effect in aortic flow, the Newtonian model is widely applied in CFD studies that aim to reveal the flow patterns of aortic dissection [32-34], while studies focusing on thrombosis formation employ non-Newtonian model [35, 36]. Previous studies comparing these two models confirmed the general similarity of the basic flow characteristics between them, while a slightly lower peak WSS was found near the vessel wall in the non-Newtonian flow model [37]. In the current study, hemodynamic analyses were used to evaluate the difference between the CTA-reconstructed and VSA-simulated models for each patient case rather than revealing the true WSS. Therefore, in consideration of the computational expense and rationality of flow simulation in the aorta, the Newtonian flow model was applied for this cohort study.
Table 3
Computation efficiency for stent deployment
| Method | Running time | Computational platform | Application | Source | Vessel wall |
|---|---|---|---|---|---|
| Finite element | about 100h | 2 Intel Xeon Processors 5150 processors | Intracranial aneurysms | [17] | Rigid |
| Finite element | 9.25-22.10h + 39.20-70.25h | 12 CPUs, 2.66GHz, 24GB RAM | Abdominal aortic aneurysms | [16] | Hyperelastic |
| Finite element | 4.5h | 4 Intel Xeon X5690 with 2 processors of 3.46 GHz, 24GB of RAM | Abdominal aortic dissection | [20] | Rigid |
| Active contour model | about 3h | 2 Intel Xeon Processors, 2.39GHz and 2.40GHz, 24GB RAM | Intracranial aneurysms | [19] | Rigid |
| Simplex mesh, ball-sweeping model | 134-451s | - | Intracranial aneurysms | [18] | Rigid |
| Simplex mesh, stent geometric constraints | 66.88 ± 25.37s | 1 Intel Duo CPU T7300, 2.00GHz, 2GB RAM | Intracranial aneurysms | [12,13] | Rigid |
| Spring analogy | 19.44s | 1 Intel Core 2 Duo processor, 2.66 GHz, 4GB RAM | Abdominal aortic dissection | [20] | Rigid |
| Simplex mesh, mechanical contact model | 13.78 ± 2.80s | 1 Intel Core i7-6700K processor, 4.00GHz, 16GB RAM | Type-B aortic dissection | Our study | Hyperelastic |
Previous 3-D computational studies targeting stent-induced aortic reshaping were based mainly on structural analysis using a finite element method which is not viable for clinical use because of its high computation requirement [38, 39]. Although the fast VSA based on deformable simplex mesh [19, 24], the active contour model [25] and the spring analogy [21] have been introduced for cerebral aneurysm stenting, developing a similar VSA for aortic endovascular repair such as TEVAR is harder; the mechanical contact and equilibrium process between the stent-graft and the aortic wall cannot be neglected and the stent-induced TL reshaping is significant (for example, in the present study, the aortic diameter measurements at the diaphragm level showed up to 355% stent-induced TL expansion in successfully treated cases). A VSA like the one developed in this study that is able to mimic the considerable stent-induced deformation of the vessel wall was therefore needed to address these challenges. Compared to other stenting algorithms, the VSA developed here may have a few advantages in simulating the deformed vessel. Simplex deformable mesh supplies a fast smoothing way to mimic stent and vessel deformation, and their deformation is controlled by internal (stent) and external (vessel) constraints. The internal constraint in this study not only included the geometrical characteristics of struts but also embedded the diameter-related radial force, which provides the algorithm with more accurate internal constraint assignments. The external constraint is the vessel resistance. Most of the previous VSAs neglected vessel deformation. In this study, the external constraint was constructed based on the measured hyperelastic property of the aorta. Although this is not patient-specific (measured samples come from patients with open surgery rather than TEVAR), this measurement offers common properties of the wall tissue for this disease, thereby providing a baseline for modeling the external constraint. The final key factor influencing the accuracy of our VSA is the weighting parameter between the internal and external constraints. For this, two cases in each stent-graft group were selected randomly to be tested with various weighting parameters. By setting the minimum difference in the curvature and cross-sectional area between the VSA and CTA models as the optimization goal, the weighting parameters were determined by genetic algorithm and then used in studies on other cases. The weighting parameters were specific to each stent-graft brand. Based on the understanding of the mechanical features of the stent-grafts and vessels as well as the numerical optimization of weighting parameters, the proposed VSA achieved satisfactory and timely results.
In aortic stenting treatment, endoleak, SINE, and RTAD, which all are induced by inappropriate stent-vessel wall contact, might be the most dangerous complications. The proposed VSA predicts reshaped vessels rapidly and accurately; thus, insufficient contact of stent-grafts to the vessel wall can be directly observed, and vessel wall deformation can be quantified. Indeed, in endovascular repair, the vessel wall is always deformed by stent expansion. Although a gentle and smooth deformation of the wall is acceptable, regionally high deformation may tear the vessel wall. Simulation studies based on expanding stents and deforming vessel walls can help to quantify SWD. However, to the best knowledge of the authors, previous fast algorithms do not consider the elasticity of the vessel wall, limiting analysis using this parameter.
The proposed VSA considers the hyperelastic characteristics of the aortic wall and the radial force of stent-grafts. The vessel movement can then be captured accurately, and SWD can be evaluated. No significant difference in the regional distribution of high SWD along the stented region was found among the successful TEVAR cases in the six stent-graft groups. We also tested a small group with TEVAR-related complications of distal SINE. There was a significantly higher SWD in the distal aortic segment (Segment-3) in the SINE group than in the successful TEVAR group, indicating that wall deformation might be a useful parameter to evaluate the risks of device-induced complications. Large studies are warranted to determine SWD cutoff values for risk stratification for particular complications.
In conclusion, the present study developed and validated a fast planning platform including real-time simulation of the reshaped stenting vessel as well as a quantitative evaluation of the device-related risks. This platform might assist in improving the safety and efficacy of TEVAR and other endovascular repairs.
Abbreviations
CFD: computational fluid dynamics; CTA: computed tomographic angiography; OSI: oscillatory shear index; RRT: relative residence time; RTAD: retrograde type-A dissection; SINE: stent-induced new entry; SWD: stent-induced vessel wall deformation; TAWSS: time-averaged wall shear stress; TBAD: type-B aortic dissection; TEVAR: thoracic endovascular aortic repair; TL: true lumen; VSA: virtual stenting algorithm.
Supplementary Material
Supplementary figures and tables.
Acknowledgements
This study was supported by the National Key Research and Development Program of China (2017YFC0107900), the National Natural Science Foundation of China (81471752 and 81770465), the Beijing Municipal Science & Technology Commission (Z161100002616020 and Z181100003118007) and the Beijing Nova Program (Z181100006218008). We thank LifeTech Scientific (Shenzhen) Co, Ltd. and Mr Benhao Xiao for supplying the stent-graft sample and we are grateful to Grimed Medical (Beijing) Co, Ltd. and to Miss Liancai Ma for the use of the radial compressive machine.
Competing Interests
The authors have declared that no competing interest exists.
References
1. Nienaber CA, Kische S, Rousseau H, Eggebrecht H, Rehders TC, Kundt G. et al. Endovascular repair of type B aortic dissection: long-term results of the randomized investigation of stent grafts in aortic dissection trial. Circ Cardiovasc Interv. 2013;6:407-16
2. Hagan PG, Nienaber CA, Isselbacher EM, Bruckman D, Karavite DJ, Russman PL. et al. The International Registry of Acute Aortic Dissection (IRAD): new insights into an old disease. JAMA. 2000;283:897-903
3. Jang H, Kim MD, Kim GM, Won JY, Ko YG, Choi D. et al. Risk factors for stent graft-induced new entry after thoracic endovascular aortic repair for Stanford type B aortic dissection. J Vasc Surg. 2017;65:676-85
4. Liu L, Zhang S, Lu Q, Jing Z, Zhang S, Xu B. Impact of Oversizing on the Risk of Retrograde Dissection After TEVAR for Acute and Chronic Type B Dissection. J Endovasc Ther. 2016;23:620-5
5. Ma T, Dong ZH, Fu WG, Guo DQ, Xu X, Chen B. et al. Incidence and risk factors for retrograde type A dissection and stent graft-induced new entry after thoracic endovascular aortic repair. J Vasc Surg. 2018;67:1026-33.e2
6. Huang X, Huang L, Sun L, Xu S, Xue Y, Zeng Q. et al. Endovascular repair of Stanford B aortic dissection using two stent grafts with different sizes. J Vasc Surg. 2015;62:43-8
7. Zhao Y, Yin H, Chen Y, Wang M, Zheng L, Li Z. et al. Restrictive bare stent prevents distal stent graft-induced new entry in endovascular repair of type B aortic dissection. J Vasc Surg. 2018;67:93-103
8. Pantaleo A, Jafrancesco G, Buia F, Leone A, Lovato L, Russo V. et al. Distal Stent Graft-Induced New Entry: An Emerging Complication of Endovascular Treatment in Aortic Dissection. Ann Thorac Surg. 2016;102:527-32
9. Lin KK, Kratzberg JA, Raghavan ML. Role of aortic stent graft oversizing and barb characteristics on folding. J Vasc Surg. 2012;55:1401-9
10. Xu J, Yang J, Sohrabi S, Zhou Y, Liu Y. Finite Element Analysis of the Implantation Process of Overlapping Stents. J Med Device. 2017;11:0210101-210109
11. De Bock S, Iannaccone F, De Santis G, De Beule M, Mortier P, Verhegghe B. et al. Our capricious vessels: The influence of stent design and vessel geometry on the mechanics of intracranial aneurysm stent deployment (vol 45, pg 1353, 2012). J Biomech. 2012;45:1353-9
12. Welch TR, Eberhart RC, Banerjee S, Chuong CJ. Mechanical Interaction of an Expanding Coiled Stent with a Plaque-Containing Arterial Wall: A Finite Element Analysis. Cardiovasc Eng Technol. 2016;7:58-68
13. Chen D, Muller-Eschner M, Kotelis D, Bockler D, Ventikos Y, von Tengg-Kobligk H. A longitudinal study of Type-B aortic dissection and endovascular repair scenarios: computational analyses. Med Eng Phys. 2013;35:1321-30
14. Midulla M, Moreno R, Baali A, Chau M, Negre-Salvayre A, Nicoud F. et al. Haemodynamic imaging of thoracic stent-grafts by computational fluid dynamics (CFD): presentation of a patient-specific method combining magnetic resonance imaging and numerical simulations. Eur Radiol. 2012;22:2094-102
15. Lim YH, Jeong HY. Finite element analyses for improved design of peripheral stents. Comput Methods Biomech Biomed Engin. 2017;20:653-62
16. Lebaal N, Azaouzi M, Roth S. Shape optimization of coronary stents based on Finite Element Analysis. Comput Methods Biomech Biomed Engin. 2017;20:119-20
17. Bludszuweit-Philipp C, Geltmeier A, Buske M. Virtual stenting for customization of endovascular devices. In: XXXV Annual Meeting European Society for Artificial Organs, Geneva, Switzerland. 3-6 September.
18. Larrabide I, Radaelli A, Frangi A. Fast virtual stenting with deformable meshes: application to intracranial aneurysms. Med Image Comput Comput Assist Interv. 2008;11:790-7
19. Larrabide I, Kim M, Augsburger L, Villa-Uriol MC, Rufenacht D, Frangi AF. Fast virtual deployment of self-expandable stents: method and in vitro evaluation for intracranial aneurysmal stenting. Med Image Anal. 2012;16:721-30
20. Spranger K, Ventikos Y. Which spring is the best? Comparison of methods for virtual stenting. IEEE Trans Biomed Eng. 2014;61:1998-2010
21. Spranger K, Capelli C, Bosi GM, Schievano S, Ventikos Y. Comparison and calibration of a real-time virtual stenting algorithm using Finite Element Analysis and Genetic Algorithms. Comput Methods Appl Mech Eng. 2015;293:462-80
22. Peach TW, Spranger K, Ventikos Y. Towards Predicting Patient-Specific Flow-Diverter Treatment Outcomes for Bifurcation Aneurysms: From Implantation Rehearsal to Virtual Angiograms. Ann Biomed Eng. 2016;44:99-111
23. Peach T, Spranger K, Ventikos Y. Virtual flow-diverter treatment planning: The effect of device placement on bifurcation aneurysm haemodynamics. Proc Inst Mech Eng H. 2017;231:432-43
24. Zhao L, Chen D, Chen Z, Wang X, Paliwal N, Xiang J. et al. Rapid Virtual Stenting for Intracranial Aneurysms. Proc SPIE Int Soc Opt Eng. 2016;9786:97860V
25. Zhong JR, Long YL, Yan HG, Meng QQ, Zhao J, Zhang Y. et al. Fast Virtual Stenting with Active Contour Models in Intracranical Aneurysm. Sci Rep. 2016;6:21724
26. Chen DD, Muller-Eschner M, Rengier F, Kotelis D, Bockler D, Ventikos Y. et al. A Preliminary Study of Fast Virtual Stent-Graft Deployment: Application to Stanford Type B Aortic Dissection Regular Paper. Int J Adv Robot Syst. 2013;10:1-8
27. Delingette H. General object reconstruction based on simplex meshes. Int J Comput Vision. 1999;32:111-46
28. Montagnat J, Delingette H. 4D deformable models with temporal constraints: application to 4D cardiac image segmentation. Med Image Anal. 2005;9:87-100
29. Teng Z, Zhang Y, Huang Y, Feng J, Yuan J, Lu Q. et al. Material properties of components in human carotid atherosclerotic plaques: a uniaxial extension study. Acta Biomater. 2014;10:5055-63
30. Xu H, Li Z, Dong H, Zhang Y, Wei J, Watton PN. et al. Hemodynamic parameters that may predict false-lumen growth in type-B aortic dissection after endovascular repair: A preliminary study on long-term multiple follow-ups. Med Eng Phys. 2017;50:12-21
31. Vignon-Clementel IE, Figueroa CA, Jansen KE, Taylor CA. Outflow boundary conditions for three-dimensional finite element modeling of blood flow and pressure in arteries. Comput Method Appl M. 2006;195:3776-96
32. Shang EK, Nathan DP, Fairman RM, Bavaria JE, Gorman RC, Gorman JH 3rd. et al. Use of computational fluid dynamics studies in predicting aneurysmal degeneration of acute type B aortic dissections. J Vasc Surg. 2015;62:279-84
33. Cheng Z, Wood NB, Gibbs RG, Xu XY. Geometric and flow features of type B aortic dissection: initial findings and comparison of medically treated and stented cases. Ann Biomed Eng. 2015;43:177-89
34. Cheng Z, Riga C, Chan J, Hamady M, Wood NB, Cheshire NJW. et al. Initial findings and potential applicability of computational simulation of the aorta in acute type B dissection. J Vasc Surg. 2013;57:35s-43s
35. Ab Naim WNW, Ganesan PB, Sun ZH, Liew YM, Qian Y, Lee CJ. et al. Prediction of thrombus formation using vortical structures presentation in Stanford type B aortic dissection: A preliminary study using CFD approach. Appl Math Model. 2016;40:3115-27
36. Menichini C, Cheng Z, Gibbs RGJ, Xu XY. Predicting false lumen thrombosis in patient-specific models of aortic dissection. J R Soc Interface. 2016;13:20160759
37. Cheng Z, Tan FPP, Riga CV, Bicknell CD, Hamady MS, Gibbs RGJ. et al. Analysis of Flow Patterns in a Patient-Specific Aortic Dissection Model. J Biomech Eng-T Asme. 2010;132:051007
38. Perrin D, Badel P, Orgeas L, Geindreau C, Dumenil A, Albertini JN. et al. Patient-specific numerical simulation of stent-graft deployment: Validation on three clinical cases. J Biomech. 2015;48:1868-75
39. Ma D, Dargush GF, Natarajan SK, Levy EI, Siddiqui AH, Meng H. Computer modeling of deployment and mechanical expansion of neurovascular flow diverter in patient-specific intracranial aneurysms. J Biomech. 2012;45:2256-63
Author contact
![]() Corresponding author: Prof Duanduan Chen and Prof Tianyi Yan, School of Life Science, Beijing Institute of Technology, Beijing, 100081, China. E-mails: duanduanedu.cn or yantianyiedu.cn Tel/Fax: +86 10 68912154 Dr Jiang Xiong, Department of Vascular and Endovascular Surgery, Chinese PLA General Hospital, Beijing, 100083, China. E-mails: xiongjiangdoccom
Corresponding author: Prof Duanduan Chen and Prof Tianyi Yan, School of Life Science, Beijing Institute of Technology, Beijing, 100081, China. E-mails: duanduanedu.cn or yantianyiedu.cn Tel/Fax: +86 10 68912154 Dr Jiang Xiong, Department of Vascular and Endovascular Surgery, Chinese PLA General Hospital, Beijing, 100083, China. E-mails: xiongjiangdoccom
Citation styles
APA
Chen, D., Wei, J., Deng, Y., Xu, H., Li, Z., Meng, H., Han, X., Wang, Y., Wan, J., Yan, T., Xiong, J., Tang, X. (2018). Virtual stenting with simplex mesh and mechanical contact analysis for real-time planning of thoracic endovascular aortic repair. Theranostics, 8(20), 5758-5771. https://doi.org/10.7150/thno.28944.
ACS
Chen, D.; Wei, J.; Deng, Y.; Xu, H.; Li, Z.; Meng, H.; Han, X.; Wang, Y.; Wan, J.; Yan, T.; Xiong, J.; Tang, X. Virtual stenting with simplex mesh and mechanical contact analysis for real-time planning of thoracic endovascular aortic repair. Theranostics 2018, 8 (20), 5758-5771. DOI: 10.7150/thno.28944.
NLM
Chen D, Wei J, Deng Y, Xu H, Li Z, Meng H, Han X, Wang Y, Wan J, Yan T, Xiong J, Tang X. Virtual stenting with simplex mesh and mechanical contact analysis for real-time planning of thoracic endovascular aortic repair. Theranostics 2018; 8(20):5758-5771. doi:10.7150/thno.28944. https://www.thno.org/v08p5758.htm
CSE
Chen D, Wei J, Deng Y, Xu H, Li Z, Meng H, Han X, Wang Y, Wan J, Yan T, Xiong J, Tang X. 2018. Virtual stenting with simplex mesh and mechanical contact analysis for real-time planning of thoracic endovascular aortic repair. Theranostics. 8(20):5758-5771.
This is an open access article distributed under the terms of the Creative Commons Attribution (CC BY-NC) license (https://creativecommons.org/licenses/by-nc/4.0/). See http://ivyspring.com/terms for full terms and conditions.