Theranostics
13.3
Impact Factor
- Current Issue
- Advance Articles
- Volume 16; 2026
- Volume 15; 2025
- Volume 14; 2024
- Volume 13; 2023
- Volume 12; 2022
- Archive
- Cover Images
- Cover Suggestion
- Special Issues
Top
Introduction
Methods
Results
Discussion
Abbreviations
Supplementary Material
Acknowledgements
References
Introduction
Methods
Results
Discussion
Abbreviations
Supplementary Material
Acknowledgements
References
International Journal of Biological Sciences
International Journal of Medical Sciences
 Global reach, higher impact

Theranostics 2018; 8(19):5452-5468. doi:10.7150/thno.28219 This issue Cite
Research Paper
Adipocytes fuel gastric cancer omental metastasis via PITPNC1-mediated fatty acid metabolic reprogramming
Yujing Tan1*, Kelin Lin1*, Yang Zhao1*, Qijing Wu1, Dongping Chen2, Jin Wang3, Yanxiao Liang4, Jingyu Li5, Jiazhu Hu6, Hao Wang7, Yajing Liu1, Shuyi Zhang1, Wanming He1, Qiong Huang1, Xingbin Hu1, Zhiqi Yao1, Bishan Liang1, Wangjun Liao1, Min Shi1 ![]()
1. Department of Oncology, Nanfang Hospital, Southern Medical University, Guangzhou, China
2. Department of Radiation Oncology, Affiliated Cancer Hospital & institute of Guangzhou Medical University, Guangzhou, China
3. Department of Abdominal Surgery, Affiliated Cancer Hospital & institute of Guangzhou Medical University, Guangzhou, China
4. Department of Pathology, Guangzhou First People's Hospital, Guangzhou, China
5. Department of Pathology, Zhujiang Hospital, Southern Medical University, Guangzhou, China
6. Department of Oncology, Guangzhou Panyu Central Hospital, Guangzhou, China
7. Department of Pathology, Guangzhou Panyu Central Hospital, Guangzhou, China
*These authors contributed equally to this work.
Received 2018-6-30; Accepted 2018-10-4; Published 2018-10-29
Citation:
Tan Y, Lin K, Zhao Y, Wu Q, Chen D, Wang J, Liang Y, Li J, Hu J, Wang H, Liu Y, Zhang S, He W, Huang Q, Hu X, Yao Z, Liang B, Liao W, Shi M. Adipocytes fuel gastric cancer omental metastasis via PITPNC1-mediated fatty acid metabolic reprogramming. Theranostics 2018; 8(19):5452-5468. doi:10.7150/thno.28219. https://www.thno.org/v08p5452.htm
Other stylesAbstract

Omental metastasis occurs frequently in gastric cancer (GC) and is considered one of the major causes of gastric cancer-related mortality. Recent research indicated that omental adipocytes might mediate this metastatic predilection. Phosphatidylinositol transfer protein, cytoplasmic 1 (PITPNC1) was identified to have a crucial role in metastasis. However, whether PITPNC1 participates in the interaction between adipocytes and GC omental metastasis is unclear.
Methods: We profiled and analyzed the expression of PITPNC1 through analysis of the TCGA database as well as immunohistochemistry staining using matched GC tissues, adjacent normal gastric mucosa tissues (ANTs), and omental metastatic tissues. The regulation of PITPNC1 by adipocytes was explored by co-culture systems. By using both PITPNC1 overexpression and silencing methods, the role of PITPNC1 in anoikis resistance and metastasis was determined through in vitro and in vivo experiments.
Results: PITPNC1 was expressed at higher rates in GC tissues than in ANTs; notably, it was higher in omental metastatic lesions. Elevated expression of PITPNC1 predicted higher rates of omental metastasis and a poor prognosis. PITPNC1 promoted anoikis resistance through fatty acid metabolism by upregulating CD36 and CPT1B expression. Further, PITPNC1 was elevated by adipocytes and facilitated GC omental metastasis. Lastly, in vivo studies showed that PITPNC1 was a therapeutic indicator of fatty acid oxidation (FAO) inhibition.
Conclusion: Elevated expression of PITPNC1 in GC is correlated with an advanced clinical stage and a poor prognosis. PITPNC1 promotes anoikis resistance through enhanced FAO, which is regulated by omental adipocytes and consequently facilitates GC omental metastasis. Targeting PITPNC1 might present a promising strategy to treat omental metastasis.
Keywords: PITPNC1, gastric cancer, omental metastasis, fatty acid oxidation, anoikis resistance
Introduction
Metastasis is the main cause of mortality in 60% of all advanced gastric cancer (GC) patients. Compared to other tumors, GC is characterized by a high occurrence of omental or peritoneal metastasis, which occurs in more than 20% GC patients at their initial diagnosis [1]. The five-year overall survival rate for these patients is lower than 7% [2, 3]. However, the underlying mechanism of this metastatic predilection is still not clear.
Tumor metastasis consists of a series of steps, starting with the detachment of the primary lesion and ending with final colonization in distant organs [4]. In this process, the resistance to anoikis, a kind of intrinsic apoptosis initiated by the loss of extracellular matrix (ECM) anchorage, serves as a prerequisite [5]. One way by which ECM detachment induces apoptosis is through energy depletion, characterized by decreased glucose absorption and ATP production [6]. However, cancer cells could develop metabolic reprogramming to resist this, and fatty acid oxidation (FAO) is reported to confer more adaptive capacity under the ECM-detached condition [7, 8].
The omentum is an organ primarily composed of adipocytes, which are increasingly recognized to promote cancer cell proliferation and metastasis [9, 10]. Omental transcoelomic metastasis is a feature of GC, and previous research preliminarily showed that omental adipocytes produced fatty acids (FAs) that promote GC cell invasiveness [11]; however, the underlying mechanism in this process remained largely unknown. Growing studies indicate that lipid metabolic reprogramming is a critical factor contributing to anoikis resistance [8, 12]. Therefore, it is reasonable to suspect that adipocytes might mediate omental metastasis through regulating lipid metabolism.
Phosphatidylinositol transfer protein, cytoplasmic 1 (PITPNC1), is a member of the class II PITP family which facilitates the reciprocal transfer of phosphatidylinositol (PI) and phosphatidic acid (PA) between the intracellular membrane systems [13]. Recently, PITPNC1 was found to recruit the RAB1B to the Golgi to promote malignant secretion of pro-metastatic factors, and it was also elevated in metastatic breast cancer, melanoma, and colon cancer [14]. In our study, we found that PITPNC1 was upregulated in omental metastatic sites compared with primary lesions in GC, but whether it contributes to omental metastasis remains to be explored.
In this study, a pro-metastatic protein PITPNC1 was found to be highly elevated in GC with omental metastasis. PITPNC1 promoted anoikis resistance through enhanced fatty acid uptake and oxidation, thereby facilitating GC omental metastasis. Targeting PITPNC1 might present a novel strategy to treat omental metastasis in clinical settings.
Methods
Patient population
This study was approved by the Nanfang Hospital (Guangzhou, China) Ethics Review Board. Three cohorts were included in this study. The first included clinical data from the Kaplan-Meier (KM) plotter integrative data analysis tool (http://www.kmplot.com). The second included a total of 111 formalin-fixed and paraffin-embedded (FFPE) GC tissue samples from patients who underwent an operation in Nanfang Hospital (Guangzhou, China). No recruited patients received any preoperative treatment. For stage I-III patients, prognosis was assessed based on disease-free survival (DFS), whereas stage IV patients were analyzed based on overall survival (OS). The third included a total of 126 FFPE GC tissue samples with omental metastatic lesions from several clinical centers. All patients were staged based on the criteria of the 7th Edition of the AJCC Cancer Staging Manual: Stomach (2010). All patients provided written informed consent before the study, which was approved by the Nanfang Hospital Ethics Review Committee (Guangzhou, China).
Histological analysis
Immunohistochemical (IHC) staining was carried out with the Dako Envision System (Dako, Glostrup, Denmark). Protein expression in tumor tissues was scored by a semi-quantitative method. Briefly, sections of staining intensity were scored as 0 (negative), 1 (weak), 2 (medium) or 3 (strong), wherein the staining extent was scored according to the area percentages: 0 (0%), 1 (1-25%), 2 (26-50%), 3 (51%-75%) or 4 (76-100%). The product of the staining intensity and extent scores were the final staining scores (0-12) for PITPNC1 expression. We further defined 8-12 as high expression, 4-7 as low expression and 0-3 as negative expression to perform further analysis.
Cell culture and transfection
Six human GC cell lines (AGS, BGC803, BGC823, MKN45, MKN28, MGC803) and an immortalized human gastric epithelial cell line (GES-1) were obtained from Foleibao Biotechnology Development Co. (Shanghai, China). All cell lines were cultured in RPMI 1640 medium supplemented with 10% fetal bovine serum (HyClone, Logan, UT, USA) at 37 °C under 5% CO2. 3D collagen cultures were set up using 3 layers of type-I collagen PureCol (Advanced BioMatrix) in triplicate as previously described [15]. For gene silencing of PITPNC1, two siRNA sequences used in this study were as follows: siPITPNC1-1 (5'-CCACAGACGCACCCGAAUU-3') and siPITPNC1-2 (5'-CGAUGAAAUUCCAGAGCGC-3'). siPPARγ-1 (5'-AGATAAAGCTTCTGGATTT-3'), siPPARγ-2 (5'- AGGAAAGACAACAGACAAA-3') and siPPARγ-3 (5'-GTACCAAAGTGCAATCAAA-3'). BGC823 and AGS cells were stably transfected with LKD-U6-shRNA-EF1a-LUC-F2A-Puro-PITPNC1 (5'-CCGGCGGGTGTATCTCAACAGCAAACTCGAGTTTGCTGTTGAGATACACCCGTTTTTG-3') (Obio technology, Shanghai, China). For gene overexpression of PITPNC1, BGC823 and AGS were stably transfected with pHBLV-CMV-MCS-3flag-EF1-fluc-T2A-Puro-PITPNC1 constructs (Obio Technology, Shanghai, China). Stable cell lines were selected with 1 μg/ml puromycin medium (Invitrogen). Drugs were used as follows: MK-2206 (Sellect, Houston, TX, USA) as AKT inhibitor, (R)-(+)-Etomoxir (sodium salt) and Ranolazine (dihydrochloride) (MCE, Monmouth Junction, NJ, USA) as CPT1 inhibitors.
Adipocytes extraction
Primary adipocytes were isolated from human omentum tissue as previously described [9]. Omental tissue specimens were obtained from patients undergoing surgical procedures at Nanfang Hospital. Each subject provided informed consent, and the study protocol was approved by the Nanfang Hospital Ethics Review Board. Obtained tissue was washed with PBS, and all vessels and blood clots were removed. After being cut into small pieces, adipose tissue was transported in saline and minced in DMEM/F12 medium with 0.2% (wt/vol) collagenase type I and 0.1% (wt/vol) BSA. Minced adipose tissue was then incubated at 37 °C on a rotary shaker at 80 r.p.m. for 1 h. After removing the undigested tissue via filtration with a 250-μm mesh filter, eligible adipocytes were collected by centrifugation at 300 g and were confirmed by oil red O fat staining (Sigma). Collected adipocytes were then applied to co-culture with gastric cancer cells.
RNA isolation and qPCR analysis
Total RNA was extracted from cultured cells using a TRIzol kit (Invitrogen) according to the manufacturer's instructions and then reverse transcribed using the First Strand cDNA Synthesis kit (Takara Shuzo, Kyoto, Japan). qPCR was performed using a LightCycler 480 System Version 1.5 (Roche, Penzberg, Germany). The primer sequences are listed in Table S1. The relative expression was normalized to β-actin by the 2-ΔΔCt method.
Western blot analysis
Cells were washed with cold PBS and homogenized in lysis buffer containing protease inhibitors (keyGEN, Nanjing, China) on ice. After centrifugation, the supernatant containing protein was collected. Total protein and 5 × SDS loading buffer were mixed and boiled at 100 °C for 5 min. Samples were separated by electrophoresis on 10% SDS-polyacrylamide gel and transferred onto polyvinylidene fluoride membranes, after which the membranes were blocked for 1 h at room temperature with 5% skim milk supplemented with 0.1% Tween 20 (TBST). Each membrane was then first incubated overnight with a primary antibody at 4 °C and then with a secondary antibody for 60 min at room temperature. Immunoreactive bands were visualized using a chemiluminescence (ECL) detection system or LI-COR Odyssey infrared imaging system. Primary antibodies are listed below: PITPNC1 (Sigma, Saint Louis, MO, USA), CPT1B, p-AKT (Ser473), MMP9, Cleaved Caspase 3 (Cell Signaling Technology, Danvers, MA, USA), SREBP1 (Novus Biological), CD36, BCL2, BAX, E-cadherin, Vimentin, PPARγ, PPARα/β, Ki67 (Abcam, Cambridge, MA, USA), Histone H3, β-actin (Proteintech, Chicago, USA).
Immunofluorescence assay
Cells on small culture dishes were fixed with 4% paraformaldehyde for 15 min at room temperature and permeabilized with 0.5% Triton, after which they were washed three times with PBS and blocked with 5% BSA for 30 min. The cells were then incubated overnight at 4 °C with the primary anti-PITPNC1 antibody (1:200), rinsed, and incubated for 1 h at room temperature with Alexa Fluor 448-labeled second antibodies. The cells were then washed three times with PBS, and the nuclei were stained for 5 min with 5 μg/mL DAPI. Fluorescence images were obtained using a confocal laser scanning microscope (Olympus, Japan).
Cell adhesion assay
Matrigel (CORNING) was diluted with cell culture medium to a concentration of 200 μg/mL and then added to a 96-well plate. AGS or BGC823 cells was co-cultivated with adipocytes through transwell systems. In detail, AGS or BGC823 was seeded in an anchorage-resistant culture plate, the transwell chamber was inserted, and adipocytes were seeded on the upper side of the chamber. After co-culture for 48 h, the suspended AGS or BGC823 cells (4×10⁴ /well) was seeded again in the Matrigel-coated 96-well plates. After incubation for 3 h at 37 °C, the plates were washed three times with culture medium to remove the non-adhesive tumor cells. For total cell quantification, the incubation time was extended to 24 h. Then the cell adhesion was detected by crystal violet staining or MTT assays. For the former, the cells were fixed and observed under a microscope after crystal violet staining. For the latter, after aspirating the medium in the 96-well plates, diluted MTT (5 mg/mL) was added to the cells, and then optical density (OD) was measured at a wavelength of 570 nm using a SpectraMax M5 microplate reader (Molecular Devices, Sunnyvale, CA). For the calculation of adherence rate, the OD value after 24 h culture represented the total cells, and the OD value after 4 h culture represented the adhesive cells. The adherence rate was calculated by OD4h/ OD24h.
Cell migration assay
For transwell migration assays, the control and PITPNC1-silencing AGS or BGC823 cells were seeded in the top chamber with non-coated membrane (BD Biosciences, San Jose, CA, USA). The upper chamber contained serum-free media while the lower reservoir contained 10% FBS. After 24 hours, the cells that did not migrate through the pores were removed by a cotton swab. Cells on the lower surface of the membrane were stained with crystal violet and observed under a microscope.
Sphere formation assay
Sorted viable gastric cancer cells were plated in anchorage-resistant 6-well plates at a density of 10,000 cells/ml in serum-free DMEM/F12 medium (Gibco) supplemented with EGF (20 ng/mL, Gibco), FGF (20 ng/mL, Peprotech), 1 × B-27 supplement (Invitrogen) and 0.4% bovine serum albumin (BSA, Sigma). Cells were cultured under 5% CO2 at 37 ℃. Images were obtained under the microscope at day 0, 3, 6, 9, and sphere medium was replaced every two days.
Fatty acid uptake assay
Omental adipocytes were incubated with a fluorescent dodecanoic acid analog TF2-C12FA (Abcam, Cambridge, MA, USA) for 4 h. The adipocytes were washed in 1 × Hank's balanced salt solution (HBSS, Gibco) containing 0.2% fatty-acid-free BSA to remove extracellular fatty acids. Gastric cancer cells were incubated with these adipocytes for 24 h. Adipocytes and extracellular fatty acids were washed away with HBSS containing 0.2% fatty-acid-free BSA. Images were acquired using a fluorescence microscope (Olympus).
Cellular OCR measurement
Cellular oxygen consumption rates (OCR) were used to evaluate the FAO capacity in real-time using a Seahorse XF96 extracellular flux analyzer. BGC823 or AGS cells (1.0 × 10⁴ cells/per well) were seeded in triplicate in an XF96-well culture plate for 12 h, and the growth medium was then replaced with DMEM that was supplemented with 0.5 mM glucose, 0.5 mM carnitine, 1 mM glutamine and 1% FBS for 4 h at 37 °C. At 45 min before the assay, the FAO assay KHB buffer (111 mM NaCl, 4.7 mM KCl, 1.25 mM CaCl2, 2 mM MgSO4, and 1.2 mM Na2HPO4) supplemented with 2.5 mM glucose, 0.5 mM carnitine, and 5 mM HEPES was replaced and pH was adjusted to 7.4. Basal OCR was measured under basal conditions, and oligomycin (3 μM), carbonyl cyanide-4-trifluoro methoxy phenyl hydrazone (FCCP) (0.6 μM), and rotenone/antimycin A (2 μM) were sequentially added to each well. The OCR rate was determined every 5 min.
Fatty acid oxidation assay
A total number of 2 × 10⁷ cells were cultured in 10-cm plates and were treated as indicated. Cell mitochondria were isolated by using the Cell Mitochondrial Isolation Kit (Beyontime, Jiangsu, China). Then the mitochondria were used to determine the fatty acid β-oxidation rate according to the Fatty Acid β-Oxidation Kit from Genmed Scientifics Int USA [16].
Measurement of metabolic production ATP and ROS
Cells were seeded on 6-well plates at a density of 2 × 10⁵ cells per well. After co-culture with adipocytes, cells were trypsinized and collected to detect ATP (Beyotime, Haimen, China) according to the manufacturer's procedure. ROS were measured through flow cytometry by fluorescent 2′, 7′-dichlorofluorescin diacetate (DCF-DA) as described in the manufacturer's protocol in the commercial kit (Nanjing Jiancheng, China).
Anoikis assay
Anoikis was detected by CytoSelect 24-Well Anoikis Assay Kit (Cell Biolabs, Inc., San Diego, CA). Briefly, BGC823 and AGS (3 × 10⁴ cells/well) were seeded in an anchorage-resistant 24-well plate or control plate. After culture with or without adipocytes for 24 h, calcein AM/ethidium homodimer-1 (EthD-1) solution (500X, 1 µl) was added to each well. The plates were then incubated for 30-60 min at 37 °C. Two methods were applied to evaluate anoikis. One way was to directly observe the plates under the microscope to detect green calcein AM fluorescence (Ex, 485 nm; Em, 515 nm) or red EthD-1 fluorescence (Ex, 525 nm; Em, 590 nm). The other was through the MTT method. Briefly, MTT reagent was added to each well, and after incubation at 37 °C for 4 h, detergent was added. The plate was incubated for another 4 h in the dark at room temperature, 150 μL was transferred to the 96-well plate, and absorbance was measured at 570 nm. The anoikis rate was calculated by the ratio of ODresistant plate/ODcontrol plate.
Next-generation RNA sequencing (RNA-seq)
Three matched primary tumor tissues and omental metastatic tumor tissues were collected from GC patients. RNA was extracted and RNA-seq was carried out using the platform BGIseq-500 (Shenzhen, China). Gene set enrichment analysis (GSEA) was carried out using GSEA v3.0.
In vivo studies
All the animal experiments performed in this study were approved by Nanfang Hospital Ethics Review Board. Four-week-old athymic nude mice were injected intraperitoneally with vector or PITPNC1 overexpressing GFP-label BGC823 cells. Three days later, nude mice were sacrificed, and abdomens were opened to detect omental tumor deposits by in vivo imaging systems (FX PRO, Bruker, Germany) and HE staining. For in vivo luciferase imaging to detect drug sensitivity, nude mice were injected with 1 × 10⁶ luciferase-labeled vector or PITPNC1 overexpressing BGC823 cells (n=6). Etomoxir was administered intraperitoneally at a dose of 40 mg/kg every other day for 3 weeks. Tumor volumes were monitored weekly by bioluminescence imaging. The weight and survival condition of mice were measured daily, and after the nude mice were sacrificed, the cancer tissues were embedded with paraffin to perform IHC or HE staining.
Statistical analysis
Statistical analysis was performed using SPSS version 20 software (SPSS, Chicago, IL, USA). Differences between experimental groups were assessed by Student's t-test or one-way analysis of variance (ANOVA). Chi-squared test and Mann-Whitney test were applied where appropriate to analyze the association between PITPNC1 expression and clinicopathological parameters. Spearman correlation was used to analyze the correlation of PITPNC1 expression between primary tumor tissues and omental metastatic tissues. The log-rank test was performed to compare the survival curves of individual groups. Cox regression was used for univariate and multivariate analysis. The reported results included hazard ratios (HR) and 95% confidence intervals (CI). All values were expressed as mean ± SD, and statistical significance was noted as P < 0.05.
Results
PITPNC1 is upregulated in GC patients with omental metastasis
Given the findings that elevated levels of PITPNC1 were associated with metastatic cancers, we proceeded in our study to investigate the relation between PITPNC1 expression and clinical significance in GC. First, through analysis of the stomach adenocarcinoma (STAD) cohort from TCGA, which contained 32 normal and 375 GC tissues, we found that PITPNC1 was significantly upregulated in GC tumor tissues compared to ANTs (P<0.01) (Figure 1A). In addition, computational analysis using the KM plotter integrative bioinformatic interface showed a significant correlation between high PITPNC1 mRNA expression and poor OS (P=0.0029) and progression-free survival (PFS) (P=0.015) (Figure 1B).
We next performed immunohistochemistry (IHC) staining to measure PITPNC1 expression in a cohort containing 111 pairs of GC samples and matched ANTs. The clinicopathological characteristics of these patients are summarized in Table 1. We found that PITPNC1 expression was higher in GC tissues than in ANTs (Figure 1C-D). Kaplan-Meier survival analysis showed that PITPNC1 expression was associated with reduced OS (stage IV, P=0.043) and DFS (stage I-III, P=0.02) (Figure 1E). Notably, PITPNC1 expression increased with clinical stage, and higher expression of PITPNC1 was significantly associated with higher metastatic rate and death rate (Figure 1F). Univariate and multivariate Cox proportional hazards analysis showed that PITPNC1 was an independent prognostic factor in GC patients (Table 2).
We continued to measure PITPNC1 expression in another cohort containing 126 GC patients with omental metastasis. In line with the above cohort, IHC staining showed that PITPNC1 was also upregulated in tumor tissues, and notably, PITPNC1 was expressed at substantially higher rates in the omental metastatic sites (Figure 1G-H). In these 126 patients, high expression of PITPNC1 was observed at higher rates in omental metastatic tissues versus primary tumors in 71.4% of cases (Figure 1I), and GC patients with elevated expression of PITPNC1 in primary sites exhibited higher probability of omental metastasis (Figure 1J).
Lastly, we performed qPCR and Western blots using samples from operations to detect PITPNC1 expression. The results showed that PITPNC1 was markedly increased in tumor tissues than ANTs (7 in 8 samples), and omental metastatic lesions exhibited even higher expression of PITPNC1 (6 in 6 samples) (Figure 1K-L, Figure S1A-B). In GC cell lines, PITPNC1 expression was higher in cancer cell lines than in gastric epithelial cell line GES-1 (Figure S1C-D).
In summary, by analyzing the three cohorts, we found PITPNC1 was expressed at higher rates in GC tumor tissues and was a predictor of negative prognosis. Higher expression of PITPNC1 was associated with increased GC omental metastasis.
Figure 1
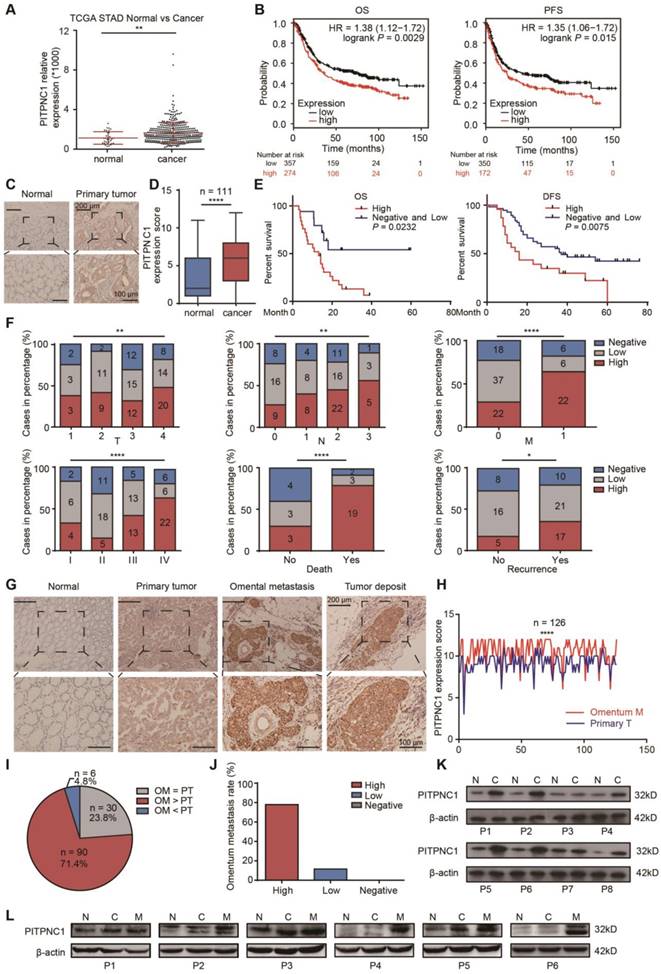
PITPNC1 is upregulated in GC patients with omental metastasis. (A) RNA-seq data from the TCGA database showed the expression level of PITPNC1 in tumor tissues from GC patients compared to the normal counterparts. (B) Kaplan-Meier analysis of OS and PFS according to the expression of the PITPNC1 score from Kaplan-Meier (KM) plotter integrative data analysis tool (http://www.kmplot.com). The total number of patients with available clinical data was: OS, n=882; PFS, n=646. (C-F) IHC staining analysis in a cohort of 111 GC patients containing tumor tissues and matched ANTs: IHC staining scores (C) and representative images (D) of PITPNC1 expression. (E) Kaplan-Meier analysis of OS and DFS according to the expression of the PITPNC1 score in the cohort. (F) Frequency of cases of negative, low, and high expression of PITPNC1 in the cohort categorized by TNM stage, death, and recurrence condition. (G-J) IHC staining analysis in a cohort of 126 GC patients with primary tumor tissues and matched omental metastatic lesions. Representative images (G) and IHC staining scores (H) of PITPNC1 expression. (I) The percentage of PITPNC1 expression score by comparison of the scores between primary and metastatic lesions. (J) The percentage of omental metastasis by the analysis of PITPNC1 expression from GC primary tumor tissues. (K-L) Western blot analysis showed the PITPNC1 expression from 8 GC patients with tumor tissues and matched ANTs (K), and PITPNC1 expression from 6 GC patients with omental metastasis (L). Error bars, SD. *P < 0.05, **P < 0.01, *** P < 0.001, **** P < 0.001.
Figure 2
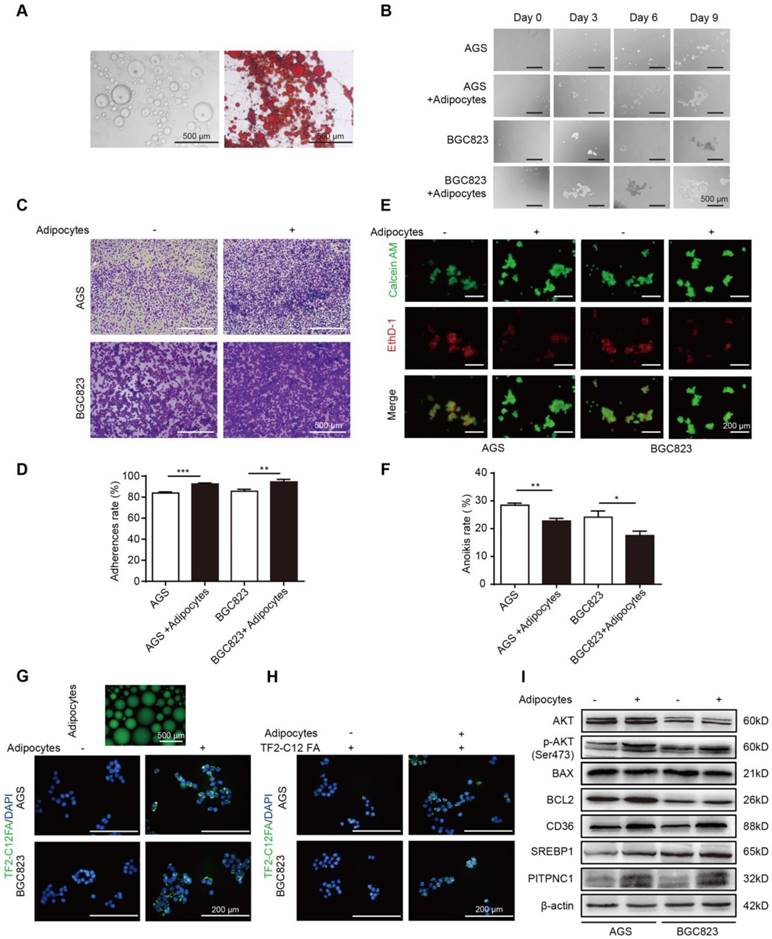
Adipocytes promote GC cell anoikis resistance through fatty acid uptake. (A) Omental adipocytes were extracted from human omentum and detected by oil red staining. (B) BGC823 or AGS was seeded in anchorage resistant 6-well plate at a density of 10,000 cells/mL. After co-culture with adipocytes for 0, 3, 6, 9 days through transwell method, the sphere formation was observed under microscopy. (C-D) BGC823 or AGS was co-cultured with adipocyte through transwell method in anchorage resistant culture plate, and the suspended cancer cells were seeded into the Matrigel-coated 96-well plate. The adhesion was detected by crystal violet staining (C) or MTT method (D). Representative images showed BGC823 and AGS that were seeded on Matrigel for 3 h after crystal violet staining (C). Bar charts showed the adherence rate of BGC823 and AGS that were seeded on Matrigel by MTT assays. Adherence rate was calculated by the ratio of OD4h/OD24h (D). (E-F) BGC823 or AGS was seeded and cultured with or without adipocytes on the anchorage-resistant 24-well plate for 48 h, and anoikis was monitored using a Calcein AM/EthD-1 double staining method (E) or MTT method (F). Representative photographs were taken (E) and anoikis rate was calculated by the ratio of ODresistant plate/ODcontrol plate (F). (G) Adipocytes were cultured and labeled with a fluorescent dodecanoic acid analog TF2-C12FA After washing the excess TF2-C12FA, the labeled adipocytes were co-cultured with BGC823 or AGS, and representative images showed the TF2-C12FA distribution in the GC cells. (H) BGC823 or AGS was co-cultured with adipocytes for 48 h. After removing the adipocytes, TF2-C12FA was added to GC cells for 4 h and then its distribution was photographed. (I) Relative changes of SREBP1, CD36, phos-AKT, total AKT, BCL2, BAX and PITPNC1 were analyzed by Western blot of BGC823 and AGS with or without adipocyte co-culture. Error bars, SD. *P < 0.05, **P < 0.01, *** P < 0.001, **** P < 0.0001.
Table 1
Relationships between PITPNC1 expression and clinicopathological parameters in Stage I-IV GC patients.
| PITPNC1 High | PITPNC1 Low | PITPNC1 Negative | |||
|---|---|---|---|---|---|
| n(%) | n | n | n | P-value | |
| Age(years) | |||||
| ≥55 | 62(55.86) | 25 | 24 | 13 | 0.3401 |
| <55 | 49(44.14) | 19 | 23 | 7 | |
| Gender | |||||
| Male | 74(66.67) | 31 | 32 | 11 | 0.2515 |
| Female | 37(33.33) | 13 | 15 | 9 | |
| TNM stage | |||||
| I | 12(10.81) | 4 | 6 | 2 | 0.0001*** |
| II | 34(30.63) | 5 | 18 | 11 | |
| III | 31(27.92) | 13 | 13 | 5 | |
| IV | 34(30.63) | 22 | 6 | 6 | |
| Tumor invasion | |||||
| T1 | 8(7.21) | 3 | 3 | 2 | 0.0023** |
| T2 | 22(19.82) | 9 | 11 | 2 | |
| T3 | 39(35.13) | 12 | 15 | 12 | |
| T4 | 42(37.84) | 20 | 14 | 8 | |
| Lymph node metastasis | |||||
| N0 | 33(29.73) | 9 | 16 | 8 | 0.0029** |
| N1 | 20(18.02) | 8 | 8 | 4 | |
| N2 | 49(44.14) | 22 | 16 | 11 | |
| N3 | 9(8.11) | 5 | 3 | 1 | |
| Distant metastasis | |||||
| M0 | 77(69.37) | 22 | 37 | 18 | 0.0001*** |
| M1 | 34(30.63) | 22 | 6 | 6 | |
| Tumor differentiation | |||||
| Well | 15(13.51) | 9 | 5 | 1 | 0.0001*** |
| Moderate | 33(29.72) | 14 | 17 | 2 | |
| Poor | 63(56.77) | 21 | 25 | 17 | |
| Recurrence | |||||
| No | 29(37.66) | 5 | 16 | 8 | 0.0166* |
| Yes | 48(62.34) | 17 | 21 | 10 | |
| Overall Survival | |||||
| Survival | 10(29.41) | 3 | 3 | 4 | 0.0001* |
| Die | 24(70.59) | 19 | 3 | 2 |
*P<0.05, **P<0.01, ***P<0.001.
Table 2
Univariate and multivariate Cox regression analysis for mortality in stage I-III and IV GC patients.
| Univariate analysis | Multivariate analysis | |||
|---|---|---|---|---|
| Variables | HR(95%CI) | P-value | HR(95%CI) | P-value |
| I-III stage | ||||
| Age(≥55/<55) | 0.73 (0.41-1.31) | 0.290 | 0.71(0.39-1.29) | 0.255 |
| Gender(Male/Female) | 1.25 (0.69-2.26) | 0.460 | 1.08(0.56-2.09) | 0.829 |
| TNM stage(I-III) | 2.22(1.41-3.51) | 0.001** | 1.48(0.64-3.38) | 0.359 |
| Tumor invasion (T1-T4) | 1.49(1.08-2.07) | 0.016* | 1.44(0.90-2.30) | 0.133 |
| Lymph node metastasis (N0-N3) | 1.46(1.12-1.90) | 0.005** | 1.25(0.81-1.91) | 0.300 |
| PITPNC1 expression (Negative/Low/High) | 1.63(1.07-2.46) | 0.020* | 1.57(1.02-2.43) | 0.043* |
| Tumor differentiation (Well/Moderate/Poor) | 1.17(0.78-1.74) | 0.440 | 1.55(0.98-2.45) | 0.059 |
| IV stage | ||||
| Age (≥55/<55) | 1.95(0.86-4.41) | 0.109 | 2.15(0.91-5.11) | 0.080 |
| Gender (Male/Female) | 0.90(0.35-2.31) | 0.829 | 0.50(0.17-1.47) | 0.208 |
| Tumor invasion (T1-T4) | 1.34(0.82-2.10) | 0.242 | 1.69(0.91-3.16) | 0.094 |
| Lymph node metastasis (N0-N3) | 1.80(0.78-4.16) | 0.170 | 2.59(0.88-7.69) | 0.086 |
| PITPNC1 expression (Negative/Low/High) | 2.07(1.06-4.04) | 0.032* | 2.51(1.19-5.32) | 0.016* |
| Tumor differentiation (Well/Moderate/Poor) | 1.12(0.63-1.98 | 0.709 | 1.20(0.65-2.23) | 0.554 |
Abbreviations: HR, hazard ratio; CI, confidence interval; *P<0.05, **P<0.01.
Adipocytes promote GC cell anoikis resistance through fatty acid uptake
The omentum was recently found to promote metastasis in cancers, and adipocytes play an important role in that process. Anoikis resistance is a critical step for successful colonization and metastasis in GC progression, but whether the omentum functioned in this process remained unclear. Therefore, we first obtained purified adipocytes from human omental adipose tissues (Figure 2A). By co-culturing BGC823 and AGS cells with adipocytes under suspension conditions, we found that the sphere formation ability was enhanced (Figure 2B). Next, cell adhesion assays were performed. After co-culturing with adipocytes, the suspended BGC823 and AGS cells were seeded into the Matrigel-coated plate, and crystal violet staining was applied to observe GC cell adhesion. The results showed adipocytes significantly improved the adhesion capacity (Figure 2C-D). Later, Calcein AM/EthD-1 staining was applied to label anoikis cells with red fluorescence and live cells with green fluorescence. Co-culture with adipocytes decreased the red/green fluorescence ratio of GC cells (Figure 2E), indicating reduced anoikis. MTT was added into the suspended BGC823 and AGS cells to detect cell viability, and results showed a lower anoikis rate after co-culture with adipocytes (Figure 2F). These results suggested that adipocytes might promote cell adhesion through anoikis resistance.
Metabolic rewiring towards FAs utilization might be a strategy for cancer cells to survive under ECM detachment, and adipocytes were reported to serve as a reservoir to provide cancer cells with FAs. Fluorescent dodecanoic acid analog TF2-C12 was cultured with adipocytes to label adipocyte-derived FAs. By co-culturing labeled adipocytes and GC cells, the TF2-C12 fluorescence accumulated in GC cells (Figure 2G). Further, we directly cultured GC cells with a TF2-C12-containing medium, and results showed that TF2-C12 was absorbed more potently under adipocyte co-culture (Figure 2H). These results indicated adipocytes not only secreted FAs but also potentiated FA uptake ability of GC cells.
FA uptake needs the participation of FA transporters on the cell membrane, such as CD36. We found CD36 and its transcription factor sterol regulatory element-binding protein 1 (SREBP1) were elevated in GC cells with adipocyte co-culture (Figure 2I) [17]. Meanwhile, adipocytes increased the BCL2/BAX protein ratio in GC cells, an indicator of anoikis resistance. In addition, BCL2 upregulation was supported by its upstream AKT signaling [7], and we found that BCL2 elevation was concomitant with AKT phosphorylation. Notably, we found PITPNC1 was also elevated under adipocyte co-culture (Figure 2I), and the role of PITPNC1 in anoikis was further investigation.
Adipocyte-mediated anoikis resistance is dependent on FAO in GC
After demonstrating enhanced FA absorption in GC cells after adipocyte co-culture, FA utilization was further examined. The mitochondria were the main organelles to oxidize FAs, and the carnitine O-palmitoyltransferase 1 (CPT1) was the main rate-limiting factor to transport FAs from the cytoplasm to the mitochondria. We first examined the oxygen consumption rate (OCR). Compared to GC cells cultured alone, BGC823 and AGS co-cultured with adipocytes exhibited a higher basal and maximal respiration rate and elevated intracellular ATP levels (Figure 3A). These results suggested that oxidative phosphorylation (OXPHOS) was enhanced under adipocyte co-culture, and we suspected the ingredients for OXPHOS were from the absorbed fatty acids. The total FAO rate and the FAO production of ATP was examined to be elevated after co-culture (Figure 3B-C). Etomoxir is an inhibitor of CPT1 and could decrease the OCR, FAO rate, and ATP production, while co-culture with adipocytes could rescue the effect (Figure 3A-C). Etomoxir increased ROS levels while this effect could partially be reduced by adipocyte co-culture (Figure 3D). Moreover, we found CPT1B and its upstream transcription factor peroxisome proliferator-activated receptor gamma (PPARγ) was upregulated by adipocytes (Figure 3E), indicating that adipocytes increased FAO by promoting transcription of this key enzyme through PPARγ.
We then tested the effects of etomoxir on GC cell adherence and anoikis. Etomoxir suppressed the cell adhesion ability detected by crystal violet staining and MTT assays; however, adipocytes substantially reversed this effect (Figure 3F-G). Further rescue studies showed that etomoxir increased anoikis rate, but it was restored under the condition of adipocyte co-culture (Figure 3H-I).
PITPNC1 is upregulated by adipocytes to promote anoikis resistance
PITPNC1 was overexpressed or silenced in either transient or stable lentivirus transfections, the efficiency was examined, and the established stable cell lines were used for later functional studies (Figure S2A-F). Silencing PITPNC1 suppressed GC cell growth, proliferation, and migration, and reduced the EMT marker E-cadherin while increasing vimentin and MMP9 (Figure S3A-E). We further found that silencing PITPNC1 impaired adhesion ability of GC cells, whereas it was reversed by adipocyte co-culture (Figure 4A). Meanwhile, silencing PITPNC1 increased anoikis rate, and adipocyte co-culture abrogated this effect (Figure 4B-C). In addition, adipocytes could restore PITPNC1 silencing-induced BAX elevation and BCL2 reduction (Figure 4D). Since BCL2 is downstream of AKT, and previous studies showed AKT was activated in GC cells under adipocyte co-culture [11], we suspected that PITPNC1 might be a downstream molecule of AKT. To verify, AKT inhibitor MK2206 was applied to GC cells. The results showed PITPNC1 expression was inhibited while co-culture with adipocytes substantially reversed it, and SREBP1 and CPT1B expression exhibited consistent alterations with PITPNC1(Figure 4E). Taken together, PITPNC1 was crucial in adipocyte-mediated protective effects on GC cells under anoikis.
Figure 3
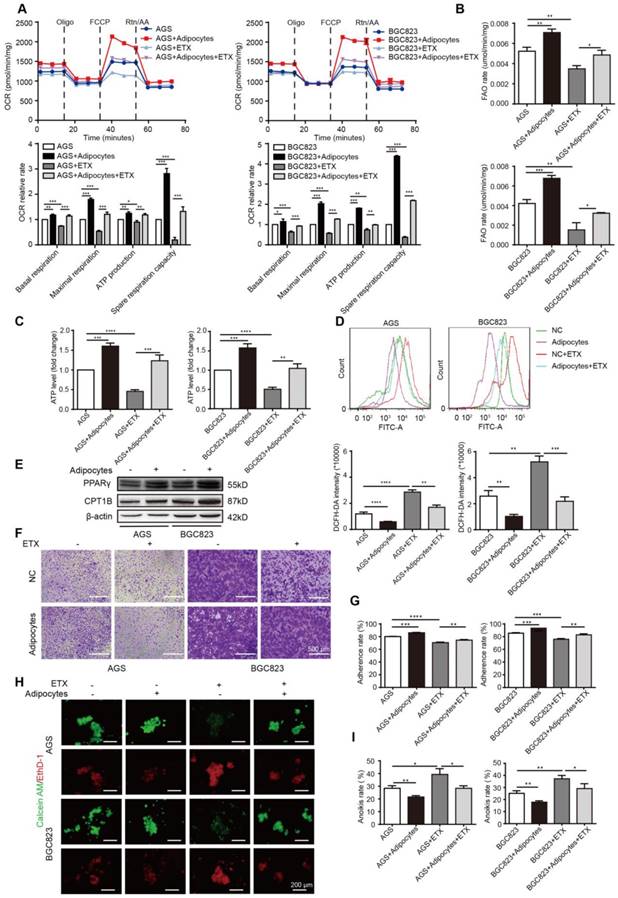
Adipocyte-mediated anoikis resistance is dependent on FAO in GC. (A-D) BGC823 or AGS was seeded in 6-well plate and co-cultured with adipocytes through transwell method under 50 μM etomoxir treatment for 24 h. the following metabolic and energy-associated assays were analyzed. (A) The basal respiration, maximal respiration, ATP production and spare respiration capacity were measured by OCR measurements through Seahorse XF96 analysis with the indicated reagents. (B) Fatty acid oxidation rate of AGS and BGC823 was measured by Fatty Acid β-Oxidation Kit. (C) ATP level of BGC823 and AGS was measured by firefly luciferase ATP Assay Kit. (D) ROS content of BGC823 and AGS was detected by measuring the fluorescence intensity of DCF-DA through flow cytometry excited at 488 nm. (E) Relative change in PPARγ and CPT1B was analyzed by Western blot after co-culture with adipocyte. (F-G) BGC823 or AGS was co-cultured with adipocytes through transwell method in anchorage-resistant culture plate, and the suspended cancer cells were seeded into the Matrigel-coated 96-well plate. The adhesion was detected by crystal violet staining (F) or MTT method (G). (H-I) BGC823 or AGS was co-cultured with adipocytes under the stimulation of 50 μM etomoxir, and anoikis was detected using Calcein AM/EthD-1 double staining method (H) or MTT method (I). Representative photographs were taken (H) and anoikis rate was calculated by the ratio of ODresistant plate/ODcontrol plate (I). Error bars, SD. *P < 0.05, **P < 0.01, *** P < 0.001, **** P < 0.001.
Figure 4
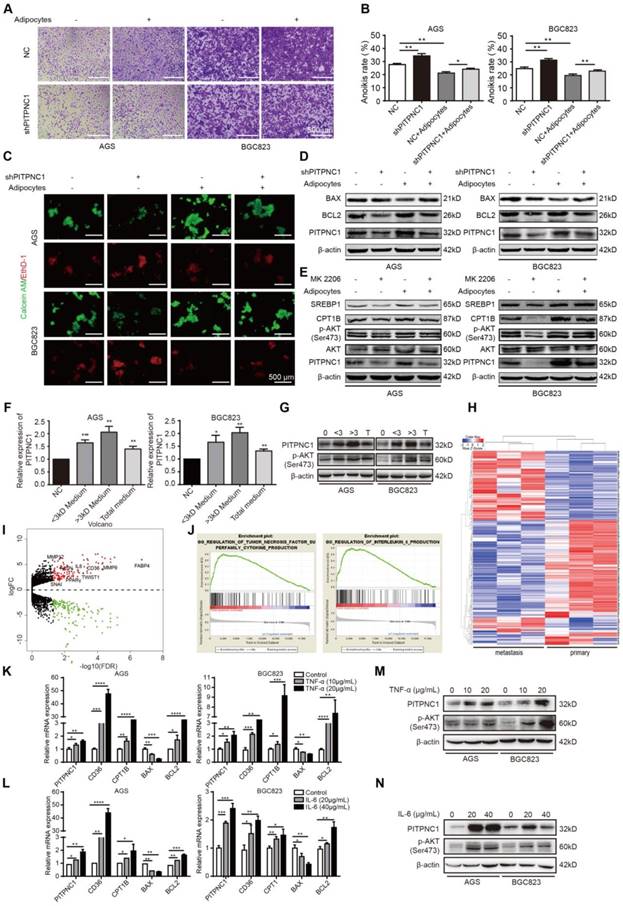
PITPNC1 is upregulated by adipocytes to promote anoikis resistance. (A-E) BGC823 or AGS stably transfected with sh-NC or sh-PITPNC1 was seeded in 6-well plate and co-cultured with adipocytes through transwell method. Anoikis-associated assays were performed as follows: (A) Cell adhesion was detected by crystal violet staining after co-culture with adipocytes for 48 h. (B) Anoikis rates were detected through MTT method. After co-culture with adipocytes in anchorage-resistant plate, suspended BGC823 or AGS was seeded into Matrigel-coated 96-well plate and detected by crystal violet staining. (C) Representative images of anoikis detected by Calcein AM/EthD-1 double staining method after co-culture with adipocytes for 48 h. (D) Relative expression of PITPNC1, BCL2 and BAX in BGC823 or AGS was analyzed by Western blot after co-culture with adipocytes for 48 h. (E) Relative change in SREBP1, CPT1B, phos-AKT, total AKT and PITPNC1 was analyzed by Western blot after BGC823 or AGS was co-cultured with adipocytes with AKT inhibitor MK2206 treatment (100μM). (F) Adipocytes were isolated from human omentum tissue and cultured for 48 h. The medium was collected and separated into two parts based on a 3kD molecular weight through ultrafiltration method. BGC823 or AGS was cultured with the conditioned medium or the total medium. The relative change in PITPNC1 expression at mRNA level by qPCR was analyzed (F), and the relative change in PITPNC1 and phos-AKT expression was analyzed at protein level by Western blot (G). (H-I) RNA-seq results showed the gene expression differentiation between GC primary sites and omental metastasis lesions through heat map analysis (H) and volcano plot analysis (I). (J) GSEA analysis of the RNA-seq data showed the enriched pathway of TNF-α and IL6 signaling in GC omental metastasis compared to primary sites. (K-N) BGC823 or AGS was treated with TNF-α (0, 10, 20 μg/mL) or IL6 (0, 20, 40 μg/mL), and the relative change in PITPNC1, CD36, CTP1B, BCL2 and BAX expression was analyzed at mRNA level by qPCR (K-L). The relative change in PITPNC1 and pAKT expression was analyzed at protein level by Western blot (M-N). Error bars, SD. *P < 0.05, **P < 0.01, *** P < 0.001, **** P < 0.001.
The question remained: how do adipocytes regulate PITPNC1 expression in GC cells? We proposed two possible ways. Since adipocytes secreted FAs to GC cells, PITPNC1 might be a downstream effector elevated by FAs as a nutritional signal. Alternatively, regulation could occur through secretion of adipocyte-derived secretory factors (adipokines). To validate our hypothesis, we separated the adipocyte medium into two parts through the ultrafiltration method. One part contained mainly the molecules less than 3 kD (FAs included), and the other part contained mainly the molecules larger than 3 kD (adipokines included). We used this conditioned medium to culture GC cells and found that both parts could upregulate PITPNC1 expression (Figure 4F-G). PITPNC1 was also elevated after culturing GC cells directly with TF2-C12-containing medium (Figure S4A). However, the conditioned medium with molecules larger than 3 kD exhibited stronger promotion of PITPNC1 expression; thus, we speculated that adipokines might play a predominant role in PITPNC1 regulation.
To investigate the possible adipokines, we chose three pairs of GC primary and matched omental metastatic tissues to perform RNA sequencing (Figure 4H). The significant gene expression differentiation was focused on the fatty acid metabolism, including enhanced CD36, FABP4 and PPARγ expression (Figure 4I). Further, Gene Set Enrichment Analysis (GSEA) analysis identified two pathways related to TNF-α and IL6 signaling (Figure 4J). We further chose TNF-α, IL6, and three other adipokines (leptin, IL8, IGF1) to detect their effects on the PITPNC1 expression. The results showed both TNF-α and IL6 could upregulate PITPNC1 expression in GC cells. Moreover, CD36, CPT1B, and BCL2 were also upregulated while BAX was downregulated in a dose-dependent manner at the mRNA level (Figure 4K-L). At the protein level, IL6 and TNF-α promoted AKT phosphorylation and PITPNC1 expression (Figure 4M-N). We also detected the effects of the other three adipokines on PITPNC1 expression, and there was no significant response to the PITPNC1 expression after stimulation (Figure S4B-G). These results confirmed that adipokines IL6 and TNF-α were the main cytokines that upregulated PITPNC1 expression.
PITPNC1-mediated anoikis resistance is dependent on FAO metabolism
After demonstrating the mechanism adipocytes use to upregulate PITPNC1, the role of PITPNC1 in anoikis resistance was further investigated. Overexpression of PITPNC1 exhibited a higher basal and maximal respiration rate and elevated intracellular ATP levels, and it could partially reverse etomoxir-induced OXPHOS inhibition (Figure 5A and Figure S5A). In particular, PITPNC1 increased FAO rate and ATP production while decreasing ROS levels. Silencing of PITPNC1 exerted opposite effects. Moreover, PITPNC1 abrogated the effects of etomoxir as it decreased FAO rate and ATP production while increasing ROS levels (Figure 5B-D and Figure S5B). Next, the impact of PITPNC1 on GC cells adherence and anoikis resistance was explored. Etomoxir significantly impaired cell adherence ability while overexpressing PITPNC1 reversed this condition (Figure 5E and Figure S5C). Calcein AM/EthD-1 staining showed decreased anoikis after PITPNC1 overexpression (Figure 5F and Figure S5D). In 3D culture, by adding collagen to mimic the ECM environments, cells grew to form a spherical structure. The center of the sphere lacked ECM adhesion and exhibited increased expression of cleaved caspase 3. The addition of etomoxir or silencing PITPNC1 significantly elevated cleaved caspase 3 expression, which was reversed by PITPNC1 overexpression (Figure 5G).
We then detected the effect of PITPNC1 on apoptosis and FAO metabolism. Silencing PITPNC1 decreased the BCL2/BAX ratio, while overexpression of PITPNC1 led to opposite results (Figure 5H). Moreover, PITPNC1 promoted SREBP1, PPARγ, CD36 and CPT1B expression, suggesting that PITPNC1 accelerated fatty acid uptake through CD36 and stimulated FAO through CPT1B in GC cells (Figure 5H). To explore the role of FAO in PITPNC1-mediated anoikis resistance, we further used etomoxir to inhibit the FAO. As a result, the BCL2/BAX ratio was downregulated while overexpression of PITPNC1 reversed the effect (Figure 5I). By using another FAO inhibitor, ranolazine, we got similar results (Figure 5J).
PPAR family has been reported to be transcription regulator of CPT1 [18], and PPARγ was upregulated in omental metastatic site based on the RNA-seq results comparing the gene expression differences between primary and metastatic site (Figure 4H-I). Previously we found that adipocyte could upregulate PPARγ expression (Figure 3E), and PITPNC1 overexpression promoted PPARγ expression while it did not influence the expression of PPARα/β (Figure 5H and Figure S6A). Therefore, we suspected that PITPNC1 regulated CPT1B expression through PPARγ. The immunofluorescence results showed that PITPNC1 increased the nuclear translocation of PPARγ (Figure 5K). It was further validated by the WB results showing the nuclear-cytoplasmic distribution of PPARγ (Figure S6B-C). Furthermore, after silencing PPARγ, CPT1B expression was decreased, while PITPNC1 overexpression could reverse the inhibition (Figure 5L). Taken together, we identified PITPNC1 as a key regulator in FAO-mediated anoikis resistance though modulating PPARγ and CPT1B expression.
Figure 5
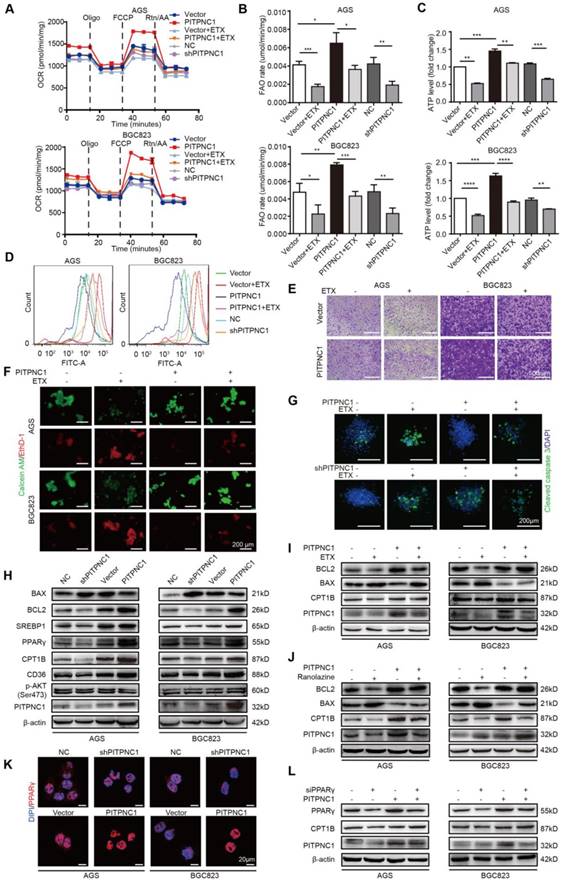
PITPNC1-mediated anoikis resistance is dependent on FAO metabolism. (A-E) BGC823 or AGS stably transfected with sh-PITPNC1 or ox-PITPNC1 were seeded and treated with 50 μM etomoxir for 48 h, and the metabolic state of the cells were detected as follows. (A) The basal respiration, maximal respiration, ATP production, and spare respiration capacity was measured after co-culture using Seahorse XF96 extracellular flux analyzer. (B) Fatty acid oxidation rate was measured by Fatty Acid β-Oxidation Kit. (C) ATP level was measured by firefly luciferase ATP Assay Kit. (D) ROS content was detected by measuring the fluorescence intensity of DCF-DA through flow cytometry. (E) Cell adhesion was detected by crystal violet staining after co-culture with adipocytes for 48 h. (F) Vector or PITPNC1 overexpressing BGC823 and AGS was seeded and treated with 50 μM etomoxir, and anoikis was detected by Calcein AM/EthD-1 staining method. (G) PITPNC1-silencing or overexpressing BGC823 was cultured in collagen I 3D culture systems and then treated with 50 μM etomoxir for 48 h. The sphere formation was photographed, and cleaved caspase 3 was examined as an indicator of anoikis by immunofluorescence. (H) The relative change in BAX, BCL2, SREBP1, PPARγ, CD36, CPT1B and PITPNC1 expression was analyzed by Western blot after PITPNC1 overexpression or silencing. Vector or PITPNC1 overexpressing BGC823 and AGS were seeded and treated with etomoxir (I) or ranolazine (J), and the relative change in BAX, BCL2, CPT1B and PITPNC1 expression was analyzed by Western blot. (K) The nuclear-cytoplasmic distribution of PPARγ after PITPNC1 overexpression or silencing through immunofluorescence. (L) PITPNC1 overexpressing BGC823 and AGS were co-transfected with PPARγ silencing sequence, and the relative change in PPARγ, CPT1B and PITPNC1 expression was analyzed by Western blot. Error bars, SD. *P < 0.05, **P < 0.01, *** P < 0.001, **** P < 0.001.
Figure 6
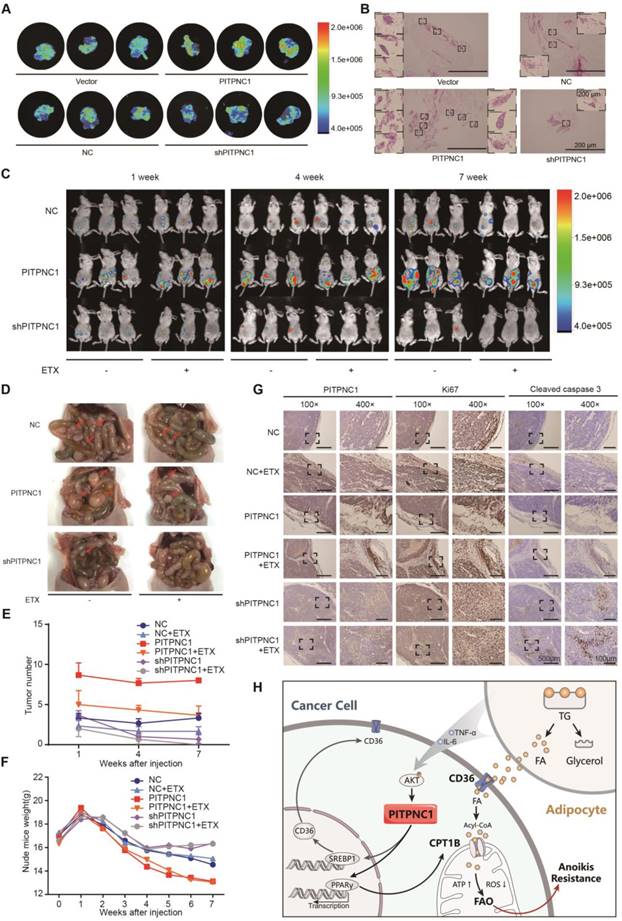
PITPNC1 promotes GC omental metastasis via fatty acid oxidation. (A-B) GFP-labeled vector or PITPNC1 overexpression GC cells were injected intraperitoneally in nude mice. After 3 days, mice were sacrificed and omentum was extracted and observed under in vivo imaging systems. The fluorescence indicated the intensity of omental metastasis (A). Representative image of omental tumor deposit after HE staining of the omentum tissues (B). (C-D) Vector or PITPNC1-overexpressing BGC823 cells with luciferase were injected intraperitoneally, and in vivo imaging (C) was performed at 1, 4 and 7 weeks after the injection. The results showed PITPNC1 overexpression group exhibited substantially larger omental metastasis compared to vector group, while shPITPNC1 group exhibited opposite results. At 8 weeks after injection, nude mice were sacrificed, and the abdomen was opened to macroscopic observation (D). (E) The omental tumor nodules counted from the in vivo imaging at indicated 1, 4 and 7 weeks after injection showed that silencing PITPNC1 or etomoxir treatment significantly reduced the tumor nodules, while PITPNC1 overexpression reversed the inhibition effect. (F) The weight of nude mice was monitored daily after intraperitoneal injection. Overexpression of PITPNC1 resulted in greater weight loss compared to the vector group or the PITPNC1-silencing group, and additional treatment with etomoxir did not influence the weight. (G) The omental tissues were embedded with paraffin to perform IHC staining. The results showed that silencing PITPNC1 or treatment with etomoxir exhibited decreased expression of Ki-67 but elevated apoptosis marker cleaved caspase-3 expression, while overexpression of PITPNC1 substantially reversed this effect. (H) Representative illustration of the metabolic crosstalk between omental adipocytes and gastric cancer cells in the process of omental metastasis. Adipocyte-secreted IL6 and TNF-α promote the expression of PITPNC1 in GC cancer cells through AKT signaling. PITPNC1 promotes the PPARγ and SREBP1 nuclear translocation, leading to elevated expression of CPT1B and CD36 expression, thereby promoting fatty acid absorption and oxidation, inducing anoikis resistance and omental metastasis.
PITPNC1 promotes GC omental metastasis via fatty acid oxidation
We further verified the role of PITPNC1 in anoikis resistance through in vivo omental metastatic nude mice models. We injected the mice intraperitoneally with GFP-labeled vector or PITPNC1-overexpressing BGC823 cells (~1 × 10⁷). After 3 days, mice were sacrificed, and the abdomen was opened to detect omental metastatic lesions. Macroscopic tumor nodules in the perigastric fat tissue were removed and exhibited stronger fluorescence in the PITPNC1-overexpression group (Figure 6A). Further, HE staining showed that PITPNC1-overexpression group exhibited more tumor deposits, which were characterized by tumor tissues with no signs of nerves, vessels or lymphoid tissues [19] (Figure 6B).
Further, the intraperitoneal omental metastasis model was established using vector or PITPNC1-overexpressing BGC823 cells with luciferase. Through an in vivo imaging system, we observed higher bioluminescence of the abdominal cavity in PITPNC1 overexpression group at 1 week, 4 weeks, and 7 weeks after the injection (Figure 6C). The metastatic tumors were extracted eight weeks after injection, and the PITPNC1 overexpression group exhibited more tumor nodules compared with the PITPNC1-silencing group (Figure 6D). Considering our above study that determined PITPNC1 enhanced FAO to promote anoikis resistance, we considered an FAO inhibitor might be a method to inhibit PITPNC1. Therefore, we used etomoxir to treat omental metastatic nude mice. The results showed that etomoxir significantly reduced tumor nodules in the PITPNC1 overexpression group (Figure 6E). In addition, etomoxir did not influence the weight of the mice, while the PITPNC1 overexpression group showed significantly greater weight loss (Figure 6F). Lastly, we performed IHC staining of the tumor tissues. The expression of PITPNC1 was higher in the PITPNC1 overexpression group. In addition, staining for the proliferation-related nuclear antigen Ki-67 and apoptosis marker cleaved caspase-3 was applied to show that etomoxir suppressed tumor cell proliferation and induced apoptosis while overexpression of PITPNC1 substantially reversed this effect (Figure 6G). PITPNC1 might be an indicator that predicts a therapeutic effect of FAO inhibition in GC omental metastasis.
Discussion
In clinical settings, GC patients with omental metastasis are of critical concern, as they face limited treatments and poor prognoses. Once GC patients are diagnosed with omental metastasis, surgery is often not an option, according to guidelines. In addition, for those patients with the chance for surgery, omentectomy has been integrated into the standard gastrectomy for T3 or deeper tumors, presumably a method to prevent omental metastasis [20]. The mechanism of the omental metastasis remains largely elusive, though there are some explanations mostly focused on the chemokine and angiogenesis signaling [21-23]. Anti-chemokine or anti-angiogenesis have been attempted to inhibit GC omental metastasis, but clinical application was still limited [24-26].
The previous study showed that PITPNC1 promoted cancer cell metastasis through enhanced angiogenesis and invasion by facilitating malignant secretion of PDGFA, MMP1 and ADAM10 [14]. This process facilitated the first step of omental metastasis. In our study, we found PITPNC1 indeed enhanced migration of GC cells and participated in the EMT process. However, despite the role of migration and invasion in metastasis, GC cells must overcome anoikis before successful colonization in the distant omentum, and the role of PITPNC1 in this process was first explored in this study.
Growing studies have emphasized the role of metabolic reprogramming in anoikis resistance. Commonly, the main energy-producing method in cancer cells is glycolysis, known as the Warburg effect. However, tumor cells under ECM detachment are confronted with decreased glucose uptake, lower glycolysis rate, and increased ROS overload [27]. To survive, alternative metabolic strategies could be utilized to provide energy [28]. Recently, OXPHOS was found to be essential in anoikis-resistant cells such as circulating tumor cells or tumor-initiating cells [12, 29], and FAO was the preferred alternative energy-producing pattern dependent on mitochondrial OXPHOS, suggesting FAO's roles in anoikis resistance.
In our study, we discovered the role of PITPNC1 in FAO via upregulating CD36 and CPT1B expression (Figure 6H). CD36 is a fatty acid transporter, and its specific neutralizing antibody significantly impairs tumor metastasis [30]. We found that CD36 was upregulated by adipocyte co-culture, which was in accordance with previous studies [31, 32]. CPT1B, the rate-limiting enzyme in FAO, was essential to reduce oxidative stress under matrix detachment [6, 12, 33]. In fact, we found CPT1B in GC cells was also upregulated by adipocytes [34, 35]. Further, CTP1 inhibition decreased the BCL2/BAX protein ratio, an indicator of anoikis resistance, while PITPNC1 overexpression reversed this effect. Furthermore, PITPNC1 promoted the nuclear translocation of PPARγ to increase CPT1B transcription. In vivo studies showed PITPNC1 abrogated the etomoxir-induced inhibition of omental metastasis. These results highlighted the importance of PITPNC1-mediated fatty acid metabolism regulation in anoikis resistance.
Previous studies have found AKT was one of the main signaling molecules that adipocytes activated in cancer cells [11, 34]. It was reasonable to consider that adipocyte-induced PITPNC1 expression was through AKT activation. Since adipocytes were considered to play endocrine function by secreting adipokines, we screened five candidates that were related to AKT signaling. We found only IL6 and TNF-α significantly induced AKT activation and subsequent PITPNC1 expression. In fact, both IL6 and TNF-α have recently been reported to participate in the peritoneal or omental metastasis [36, 37]. Therefore, for the first time, we proposed that PITPNC1 was acting as the bridge molecule connecting omental adipocytes and GC fatty acid metabolism, subsequently mediating anoikis resistance and omental metastasis.
In the study of the role of PITPNC1 in metastasis, we found that the PITPNC1 overexpression group exhibited high rates of metastasis in peritoneum or omentum. In addition, HE staining showed that the nodules in these tissues had low amounts of blood vessels, which was consistent with a recently established concept of tumor deposition (TD). TD was first recognized in colorectal adenocarcinomas as a localized collection of tumor cells situated in peritumoral adipose tissue without histological evidence of residual lymph node or identifiable vascular or neural structures. It is featured in the newly published UICC TNM classification of malignant tumors [19]. Tumor deposits were also found in GC, especially in omental adipose tissues [38, 39]. TD formation has been recognized as the early stage of metastasis and correlated with poor survival in GC [40]. In our study, in vivo experiments showed that TD indeed tended to locate in the peritoneum and omentum. Due to the lack of vascular system, cancer cells in TD might be largely dependent on the local microenvironment to survive. We speculated that omental adipocytes might provide a niche as a fatty acid reservoir to support GC cell colonization, and PITPNC1 might be an effector that promotes the utilization of fatty acids provided by omental adipocytes.
In summary, our study highlighted the importance of PITPNC1 in its pro-survival and pro-metastatic role through lipid metabolism reprogramming. PITPNC1 expression, upregulated by omental adipocytes, promotes fatty acid absorption and oxidation and therefore induces anoikis resistance, leading to further TD formation and omental metastasis. Targeting PITPNC1 might present a promising strategy to treat omental metastasis in clinical practice.
Abbreviations
ANT: adjacent normal gastric mucosa tissues; CPT1: Carnitine O-palmitoyltransferase 1; DFS: disease-free survival; ECM: extracellular matrix; ETX: etomoxir; FA: fatty acid; FAO: fatty acid oxidation; GC: gastric cancer; GSEA; gene set enrichment analysis; IHC: immunohistochemistry; OCR: oxygen consumption rate; OD: optical density; OS: overall survival; OXPHOS: oxidative phosphorylation: PA: phosphatidic acid; PFS: progression-free survival; PI: phosphatidylinositol; PITPNC1: phosphatidylinositol transfer protein, cytoplasmic 1; PPARγ: peroxisome proliferator-activated receptor gamma; SREBP1: sterol regulatory element-binding protein 1; STAD: stomach adenocarcinoma; TD: tumor deposit.
Supplementary Material
Supplementary figures and table.
Acknowledgements
We would like to thank Jiang Yu from Department of General Surgery, Nanfang Hospital of Southern Medical University for providing fresh tissue samples. We also thank Yali Zhang and Yadong Wang from Department of Gastroenterology, Nanfang Hospital of Southern Medical University, Li Liang from Department of Pathology, Nanfang Hospital of Southern Medical University, Jianzhi Chen from Department of Pathology, Nanhai Hospital of Southern Medical University, and Degui Liao from Department of Pathology, the Second Affiliated Hospital of Guangzhou Medical University for providing paraffin-embedded tissue samples.
Financial Support
This study was supported by the National Natural Science Foundation of China (81672447 to Min Shi) and China Postdoctoral Science Foundation (2018M630970 to Yang Zhao).
Author Contribution
Yujing Tan and Yang Zhao designed the study and take responsibility for the integrity and accuracy of the data analysis. Yujing Tan performed analysis of clinical data of GC patients and animal model experiments. The molecular experiments were carried out by Kelin Lin, Yujing Tan, Xingbing Hu, Bishan Liang and Zhiqi Yao. The manuscript was written by Yang Zhao and Qijing Wu and revised by Yajing Liu, Wanming He, Wangjun Liao, Qiong Huang and Shuyi Zhang. Dongping Chen, Jin Wang, Yanxiao Liang, Jingyu Li, Jiazhu Hu, Hao Wang collected the clinical GC samples. All the work was planned and supervised by Min Shi. All authors have read and approved the final manuscript.
Competing Interests
The authors have declared that no competing interest exists.
References
1. Power DG, Schattner MA, Gerdes H, Brenner B, Markowitz AJ, Capanu M. et al. Endoscopic ultrasound can improve the selection for laparoscopy in patients with localized gastric cancer. J Am Coll Surg. 2009;208:173-8
2. Coccolini F, Gheza F, Lotti M, Virzì S, Iusco D, Ghermandi C. et al. Peritoneal carcinomatosis. World J Gastroenterol. 2013;19:6979
3. Thomassen I, Gestel YR, Ramshorst B, Luyer MD, Bosscha K, Nienhuijs SW. et al. Peritoneal carcinomatosis of gastric origin: A population-based study on incidence, survival and risk factors. Int J Cancer. 2014;134:622-8
4. Massagué J, Obenauf AC. Metastatic colonization by circulating tumour cells. Nature. 2016;529:298
5. Galluzzi L, Vitale I, Aaronson SA, Abrams JM, Adam D, Agostinis P. et al. Molecular mechanisms of cell death: recommendations of the Nomenclature Committee on Cell Death 2018. Cell Death Differ. 2018:1
6. Schafer ZT, Grassian AR, Song L, Jiang Z, Gerhart-Hines Z, Irie HY. et al. Antioxidant and oncogene rescue of metabolic defects caused by loss of matrix attachment. Nature. 2009;461:109
7. Paoli P, Giannoni E, Chiarugi P. Anoikis molecular pathways and its role in cancer progression. Biochim Biophys Acta Mol Cell Res. 2013;1833:3481-98
8. Li X, Wang Z, Zheng Y, Guan Y, Yang P, Chen X. et al. Nuclear Receptor Nur77 Facilitates Melanoma Cell Survival under Metabolic Stress by Protecting Fatty Acid Oxidation. Mol Cell. 2018;69(e7):480-92
9. Nieman KM, Kenny HA, Penicka CV, Ladanyi A, Buell-Gutbrod R, Zillhardt MR. et al. Adipocytes promote ovarian cancer metastasis and provide energy for rapid tumor growth. Nat Med. 2011;17:1498
10. Huang C, Chang P, Kuo W, Chen C, Jeng Y, Chang K. et al. Adipocytes promote malignant growth of breast tumours with monocarboxylate transporter 2 expression via β-hydroxybutyrate. Nat Commun. 2017;8:14706
11. Xiang F, Wu K, Liu Y, Shi L, Wang D, Li G. et al. Omental adipocytes enhance the invasiveness of gastric cancer cells by oleic acid-induced activation of the PI3K-Akt signaling pathway. Int J Biochem Cell Biol. 2017;84:14-21
12. Jeon SM, Chandel NS, Hay N. AMPK regulates NADPH homeostasis to promote tumour cell survival during energy stress. Nature. 2012;485:661
13. Garner K, Hunt AN, Koster G, Somerharju P, Groves E, Li M. et al. Phosphatidylinositol transfer protein, cytoplasmic 1 (PITPNC1) binds and transfers phosphatidic acid. J Biol Chem. 2012;287:32263-76
14. Halberg N, Sengelaub CA, Navrazhina K, Molina H, Uryu K, Tavazoie SF. PITPNC1 recruits RAB1B to the Golgi network to drive malignant secretion. Cancer cell. 2016;29:339-53
15. Lu Y, Zhao X, Liu Q, Li C, Graves-Deal R, Cao Z. et al. lncRNA MIR100HG-derived miR-100 and miR-125b mediate cetuximab resistance via Wnt/β-catenin signaling. Nat Med. 2017;23:1331
16. Xu Y, Huang J, Xin W, Chen L, Zhao X, Lv Z. et al. Lipid accumulation is ahead of epithelial-to-mesenchymal transition and therapeutic intervention by acetyl-CoA carboxylase 2 silence in diabetic nephropathy. Metabolism. 2014;63:716-26
17. Zhou J, Febbraio M, Wada T, Zhai Y, Kuruba R, He J. et al. Hepatic fatty acid transporter Cd36 is a common target of LXR, PXR, and PPARgamma in promoting steatosis. Gastroenterology. 2008;134:556-67
18. Ma Y, Temkin SM, Hawkridge AM, Guo C, Wang W, Wang X-Y. et al. Fatty Acid Oxidation: An Emerging Facet of Metabolic Transformation in Cancer. Cancer Lett. 2018
19. Bertero L, Massa F, Metovic J, Zanetti R, Castellano I, Ricardi U. et al. of the UICC Classification of Malignant Tumours: an overview of the changes in the pathological TNM classification criteria—What has changed and why?. Virchows Arch. 2017:1-13
20. Association JGC. Japanese gastric cancer treatment guidelines 2014 (ver. 4). Gastric cancer. 2017;20:1-19
21. Yasumoto K, Koizumi K, Kawashima A, Saitoh Y, Arita Y, Shinohara K. et al. Role of the CXCL12/CXCR4 axis in peritoneal carcinomatosis of gastric cancer. Cancer Res. 2006;66:2181-7
22. Cao L, Hu X, Zhang J, Huang G, Zhang Y. The role of the CCL22-CCR4 axis in the metastasis of gastric cancer cells into omental milky spots. J Transl Med. 2014;12:267
23. Zhao L, Yasumoto K, Kawashima A, Nakagawa T, Takeuchi S, Yamada T. et al. Paracrine activation of MET promotes peritoneal carcinomatosis in scirrhous gastric cancer. Cancer Sci. 2013;104:1640-6
24. Jiang J, Liu W, Guo X, Zhang R, Zhi Q, Ji J. et al. IRX1 influences peritoneal spreading and metastasis via inhibiting BDKRB2-dependent neovascularization on gastric cancer. Oncogene. 2011;30:4498
25. Xiang Z, Zhou Z, Xia G, Zhang X, Wei Z, Zhu J. et al. A positive crosstalk between CXCR4 and CXCR2 promotes gastric cancer metastasis. Oncogene. 2017:36
26. Sako A, Kitayama J, Koyama H, Ueno H, Uchida H, Hamada H. et al. Transduction of soluble Flt-1 gene to peritoneal mesothelial cells can effectively suppress peritoneal metastasis of gastric cancer. Cancer Res. 2004;64:3624-8
27. Zhao Y, Hu X, Liu Y, Dong S, Wen Z, He W. et al. ROS signaling under metabolic stress: cross-talk between AMPK and AKT pathway. Mol Cancer. 2017;16:79
28. de Cedrón MG, de Molina AR. Microtargeting cancer metabolism: opening new therapeutic windows based on lipid metabolism. J Lipid Res. 2016;57:193-206
29. LeBleu VS, O'Connell JT, Herrera KNG, Wikman H, Pantel K, Haigis MC. et al. PGC-1α mediates mitochondrial biogenesis and oxidative phosphorylation in cancer cells to promote metastasis. Nat Cell Biol. 2014;16:992-1003
30. Pascual G, Avgustinova A, Mejetta S, Martín M, Castellanos A, Attolini CS-O. et al. Targeting metastasis-initiating cells through the fatty acid receptor CD36. Nature. 2017;541:41
31. Ladanyi A, Mukherjee A, Kenny HA, Johnson A, Mitra AK, Sundaresan S. et al. Adipocyte-induced CD36 expression drives ovarian cancer progression and metastasis. Oncogene. 2018:1
32. Tabe Y, Yamamoto S, Saitoh K, Sekihara K, Monma N, Ikeo K. et al. Survival of acute monocytic leukemia cells is driven by fatty acid oxidation-mediated activation of AMPK in bone marrow adipocytes. Cancer Res. 2017 canres. 1645.2016
33. Carracedo A, Weiss D, Leliaert AK, Bhasin M, De Boer VC, Laurent G. et al. A metabolic prosurvival role for PML in breast cancer. J Clin Invest. 2012;122:3088-100
34. Miranda F, Mannion D, Liu S, Zheng Y, Mangala LS, Redondo C. et al. Salt-inducible kinase 2 couples ovarian cancer cell metabolism with survival at the adipocyte-rich metastatic niche. Cancer cell. 2016;30:273-89
35. Huang J, Duran A, Reina-Campos M, Valencia T, Castilla EA, Müller TD. et al. Adipocyte p62/SQSTM1 Suppresses Tumorigenesis through Opposite Regulations of Metabolism in Adipose Tissue and Tumor. Cancer cell. 2018;33(e6):770-84
36. Lau T, Chan LK, Wong EC, Hui CW, Sneddon K, Cheung T. et al. A loop of cancer-stroma-cancer interaction promotes peritoneal metastasis of ovarian cancer via TNFα-TGFα-EGFR. Oncogene. 2017;36:3576
37. Wen W, Liang W, Wu J, Kowolik CM, Buettner R, Scuto A. et al. Targeting JAK1/STAT3 signaling suppresses tumor progression and metastasis in a peritoneal model of human ovarian cancer. Mol Cancer Ther. 2014;13:3037-48
38. Jin M, Roth R, Rock JB, Washington MK, Lehman A, Frankel WL. The impact of tumor deposits on colonic adenocarcinoma AJCC TNM staging and outcome. Am J Surg Pathol. 2015;39:109
39. Nagtegaal ID, Tot T, Jayne DG, McShane P, Nihlberg A, Marshall HC. et al. Lymph nodes, tumor deposits, and TNM: are we getting better? J Clin Oncol. 2011;29:2487-92
40. Lee HS, Lee HE, Yang H-K, Kim WH. Perigastric tumor deposits in primary gastric cancer: implications for patient prognosis and staging. Ann Surg Oncol. 2013;20:1604-13
Author contact
![]() Corresponding author: Min Shi, MD, PhD. Department of Oncology, Nanfang Hospital, Southern Medical University, Guangzhou, China. E-mail: shiminedu.cn
Corresponding author: Min Shi, MD, PhD. Department of Oncology, Nanfang Hospital, Southern Medical University, Guangzhou, China. E-mail: shiminedu.cn
Citation styles
APA
Tan, Y., Lin, K., Zhao, Y., Wu, Q., Chen, D., Wang, J., Liang, Y., Li, J., Hu, J., Wang, H., Liu, Y., Zhang, S., He, W., Huang, Q., Hu, X., Yao, Z., Liang, B., Liao, W., Shi, M. (2018). Adipocytes fuel gastric cancer omental metastasis via PITPNC1-mediated fatty acid metabolic reprogramming. Theranostics, 8(19), 5452-5468. https://doi.org/10.7150/thno.28219.
ACS
Tan, Y.; Lin, K.; Zhao, Y.; Wu, Q.; Chen, D.; Wang, J.; Liang, Y.; Li, J.; Hu, J.; Wang, H.; Liu, Y.; Zhang, S.; He, W.; Huang, Q.; Hu, X.; Yao, Z.; Liang, B.; Liao, W.; Shi, M. Adipocytes fuel gastric cancer omental metastasis via PITPNC1-mediated fatty acid metabolic reprogramming. Theranostics 2018, 8 (19), 5452-5468. DOI: 10.7150/thno.28219.
NLM
Tan Y, Lin K, Zhao Y, Wu Q, Chen D, Wang J, Liang Y, Li J, Hu J, Wang H, Liu Y, Zhang S, He W, Huang Q, Hu X, Yao Z, Liang B, Liao W, Shi M. Adipocytes fuel gastric cancer omental metastasis via PITPNC1-mediated fatty acid metabolic reprogramming. Theranostics 2018; 8(19):5452-5468. doi:10.7150/thno.28219. https://www.thno.org/v08p5452.htm
CSE
Tan Y, Lin K, Zhao Y, Wu Q, Chen D, Wang J, Liang Y, Li J, Hu J, Wang H, Liu Y, Zhang S, He W, Huang Q, Hu X, Yao Z, Liang B, Liao W, Shi M. 2018. Adipocytes fuel gastric cancer omental metastasis via PITPNC1-mediated fatty acid metabolic reprogramming. Theranostics. 8(19):5452-5468.
This is an open access article distributed under the terms of the Creative Commons Attribution (CC BY-NC) license (https://creativecommons.org/licenses/by-nc/4.0/). See http://ivyspring.com/terms for full terms and conditions.