Impact Factor
- Issue 12; 2026
- Issue 11; 2026
- Issue 10; 2026
- Issue 9; 2026
- Issue 8; 2026
- Volume 16; 2026
- Advance Articles
- Past Issues
- Cover Images
- Cover Suggestion
- Index & Coverage
- Special Issues
Introduction
Methods
Results and discussion
Conclusions
Abbreviations
Acknowledgements
Supplementary Material
References
International Journal of Biological Sciences
International Journal of Medical Sciences
 Global reach, higher impact

Theranostics 2018; 8(18):5059-5071. doi:10.7150/thno.28344 This issue Cite
Research Paper
Tumor-specific activated photodynamic therapy with an oxidation-regulated strategy for enhancing anti-tumor efficacy
Huan Liang1,2, Zhanwei Zhou3, Renjie Luo1, Mangmang Sang 1, Bowen Liu 4, Minjie Sun 3, Wei Qu 4, Feng Feng 4,5 ![]() , Wenyuan Liu 1,2
, Wenyuan Liu 1,2 ![]()
1. Department of Pharmaceutical Analysis, China Pharmaceutical University, Nanjing 210009, China
2. Key Laboratory of Drug Quality Control and Pharmacovigilance (China Pharmaceutical University), Ministry of Education, Nanjing 210009, China
3. State Key Laboratory of Natural Medicines and Department of Pharmaceutics, China Pharmaceutical University, Nanjing, 210009, China
4. Department of Natural Medicinal Chemistry, China Pharmaceutical University, 24 Tong Jia Xiang, Nanjing 210009, China
5. Jiangsu Food and Pharmaceutical Science College, Huaian 223003, China
Received 2018-7-6; Accepted 2018-8-29; Published 2018-10-5
Abstract

Photodynamic therapy relies on photosensitizers to generate cytotoxic reactive oxygen species (ROS) resulting in the apoptois of tumor cells. However, there is an antioxidant system that impedes the elevation of oxidation levels in tumor cells. Thus, photodynamic therapy may exhibit insufficient curative effects due to ungenerous reactive oxygen species levels. Herein, we describe tumor-specific activated photodynamic therapy using an oxidation-regulating strategy.
Methods: We first synthesised a reactive oxygen species-sensitive amphipathic prodrug of gambogic acid-grafted hyaluronic acid (HA-GA). The hydrophobic photosensitizer chlorin e6 (Ce6) was then loaded into HA-GA by hydrophobic interactions between GA and Ce6, forming amphipathic nanomicelles (HA-GA@Ce6). The ROS-responsive behavior, cytotoxicity, cell uptake, tumor cell killing, in vivo biodistribution and in vivo anti-tumor efficacy of HA-GA@Ce6 were investigated. The in vitro and in vivo experiments were performed on 4T1 murine breast cancer cells and 4T1 tumor model.
Results: We validated that the micelles of HA-GA@Ce6 showed stronger cell uptake in 4T1 tumor cells and lower cytotoxicity in normal cells compared with free Ce6 and GA, which exhibited the benefits of nanomicelles on enhancing the tumor cell acumulation and reducing the side effects on normal cells synchronously. Additionally, the cytotoxic free radicals of photodynamic therapy were generated after irradiation and the high oxidation levels activated the ROS-sensitive GA prodrug efficiently, which killed the tumor cells and depleted intracellular glutathione (GSH), thereby impairing antioxidant levels and enhancing photodynamic therapy.
Conclusion: With the successfully eradicated tumor growth in vivo. Our work represents a new photodynamic therapy concept, achieving superior anti-tumor efficacy by reducing intracellular antioxidant levels.
Keywords: chlorin e6, gambogic acid, photodynamic therapy, ROS-sensitive, GSH depletion
Introduction
In recent years, photodynamic therapy (PDT) has emerged as a new strategy for cancer treatment. As a noninvasive therapeutic approach, PDT exhibits significant advantages over other conventional therapies: it is selectively cytotoxic to tumor cells with reduced side effects on normal tissues and adjacent cells [1,2]. Chlorin e6 (Ce6) is a widely used photosensitizer for PDT [3] and is activated by laser irradiation to generate highly cytotoxic reactive oxygen species (ROS), especially singlet oxygen (1O2). The photosensitizer induces cell apoptosis and necrosis with low background toxicity and has satisfactory optical imaging capabilities to monitor its distribution in vivo [4,5]. However, application of Ce6 faces several challenges due to its inherent shortcomings, including poor water solubility [6], a lack of adequate tumor targeting [7] and the induction of potential photo-toxicity through ambient light exposure [8]. Furthermore, tumor cells exist in an antioxidant system that impedes PDT, which relies on enhancement in the level of cell oxidation. Thus, PDT may exhibit insufficient curative effects [9].
Considering both the advantages and disadvantages of PDT, a combination strategy is proposed [10,11]. Gambogic acid (GA) is a naturally-derived chemotherapeutic agent from the gamboge tree and has potent cytotoxic activity against multiple types of tumors, including breast carcinoma, osteosarcoma, hepatocellular carcinoma and lung carcinoma, etc. [12-14]. More importantly, mechanistic analyses have revealed that GA depletes glutathione (GSH) in cells, disrupting intracellular redox homeostasis [15-17]. It should be noted that GSH depletion may elevate ROS levels, enhancing PDT and leading to tumor cell death [18, 19].
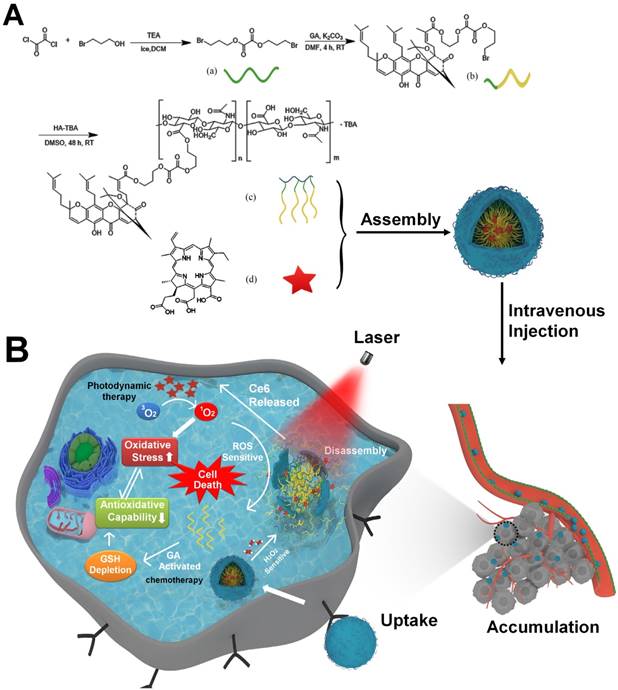
The ideal drug delivery system should not only selectively switch on at target sites by responding to biological stimuli [20], but it should create ideal conditions for appropriate drug release. Considering the high oxidation environments within tumor cells and ROS production from laser irradiation of Ce6, we previously synthesized a linker containing a peroxalate ester as a ROS-sensitive group [21]. Hyaluronic acid (HA) has hydrophilic moieties that can be coupled to GA through the peroxalate ester linkage (referred to as HA-GA), resulting in the formation of an amphiphilic pro-drug [22]. HA-GA can self-assemble into tunable micelles with efficient drug loading in water and dissociate sharply under oxidizing conditions. Ce6 is loaded into the micelles using hydrophobic interactions (referred to as HA-GA@Ce6), enabling combination PDT and regulation of oxidative stress with a single delivery system (Scheme 1A). HA-GA@Ce6 maintains its structural integrity until laser irradiation, when Ce6 is activated to generate ROS. Consequently, the GA pro-drug is activated, triggered by ROS, and displays time and site-specific cytotoxicity. The optical absorption and fluorescence characteristics of HA-GA@Ce6 makes it convenient to track micelles in vitro and in vivo and to determine the mechanisms of the combined therapy. Furthermore, the formation of HA-GA@Ce6 micelles improves accumulation of the drugs at the tumor site via active targeting of HA and the enhanced permeability and retention (EPR) effect of tumors when administrated through systemic injection [23].
Schematic illustration of the tumor-specific activated photodynamic therapy with an oxidation-regulated strategy for enhancing anti-tumor efficacy. (A) Chemical structure of bis(3-bromopropyl) oxalate ROS-sensitive linker, the GA prodrug and the micelles of HA-GA@Ce6. (B) Scheme of the programmed release for PDT with an oxidation-regulated strategy to enhancing anti-tumor efficacy. (1) Cell endocytosis and endosomal escape of micelles into the cytosol based on photochemical rupture of endocytic membranes. (2) Disassembly of micelles in the presence of H2O2 and laser light at a wavelength of 638 nm. (3) Ce6 is released for photodynamic therapy by light irradiation to elevate the level of ROS. (4) GA is released from HA-GA prodrug by the high level of ROS. (5) The activated GA depletes GSH and acts as a chemotherapy agent. (6) HA-GA@Ce6 impairs the level of antioxidants and elevates oxidation, which enhances photodynamic therapy and achieves superior anti-tumor efficacy.
Methods
Materials, cell culture and animals
Gambogic acid (GA) was isolated from gamboge resin of Garcinia hanburyi with a purity of 98% as determined by high-performance liquid chromatography (HPLC) (Figure S1). Ce6 was obtained from Sigma-Aldrich (St. Louis, MO, USA). HA with a molecular weight (MW) of 14600 Da was purchased from Zhenjiang Dongyuan Biotechnology Co, Ltd. (Jiangsu, China). 3-bromopropanol, oxalyl chloride, and tetrabutylammonium hydroxide (TBA-OH) were procured from Aladdin (Shanghai, China). Trypsin EDTA solution, penicillin streptomycin solution, RPMI-1640 medium, rhodamine 123 and 3-(4,5-dimethyl-2-thiazolyl)-2,5-diphenyl-2-H-tetrazolium bromide (MTT) were purchased from KeyGen biotech (Jiangsu, China). Annexin V-FITC/PI Apoptosis Detection Kit (Cat No. 40302) was purchased from the Yeasen Company (Shanghai, China). 4',6-diamidino-2-phenylindole (DAPI) and ROS Assay Kit were obtained from Beyotime (Shanghai, China). Fetal bovine serum (FBS) was purchased from BI (Biological Industries, USA). All other chemicals were of analytical grade and used without further purification.
4T1 mouse mammary tumor cells were obtained from ATCC (American Type Culture Collection) and cultured in RPMI-1640 medium supplemented with 10% FBS and 1% penicillin/streptomycin at 37 °C in a humidified 5% CO2 incubator. Cells were cultured in 25 cm2 tissue culture flasks and passaged every other day.
Female BALB/c mice (18-22 g) were maintained under appropriate conditions. All animal procedures were conducted in compliance with the Guide for Care and Use of Laboratory Animals and were approved by China Pharmaceutical University.
Synthesis and characterization of HA-GA
To prepare the ROS-cleavable amphiphilic HA-GA conjugate, a peroxalate ester ROS-responsive linkage was designed and synthesized. Briefly, 3-bromopropanol (2.71 mL, 30 mmol) was dissolved in 10 mL anhydrous dichloromethane in the presence of a double molar excess of triethylamine (8.32 mL, 60 mmol). Oxalyl chloride (169 µL, 2 mmol) was added to the mixture dropwise and the solution was stirred for 30 min under nitrogen in an ice bath. The residue was purified by silica gel column chromatography using an eluent gradient from petroleum ether to 10/1 petroleum ether/ethyl acetate to obtain the product.
Subsequently, the ROS-responsive linker (660 mg, 2 mmol) and potash (828 mg, 6 mmol) were dissolved in 20 mL dimethyl formamide after 10 min of stirring. Then, GA (628 mg, 1 mmol) was added and the mixture was stirred for 4 h at room temperature (RT). The crude product was purified by silica gel chromatography using an eluent gradient from petroleum ether to 15/1 petroleum ether/ethyl acetate.
The above product (85 mg, 0.1 mmol) dissolved in 5 mL dimethyl sulfoxide (DMSO) was added dropwise to the tetrabutylammonium salt of HA (HA-TBA) (200 mg) in 15 mL DMSO with continuous stirring for 48 h at RT. The synthesis process of HA-TBA was performed similarly to previous reports [24, 25]. Briefly, acidification of the carboxylic groups was performed by using a strong acidic ion exchange resin (Dowex) and subsequent neutralization with TBA-OH. The product was dialyzed against DMSO for 24 h (MW cut off 3500 Da), 1% sodium chloride water for 24 h and ultrapure water for another 24 h. The final product was freeze-dried and stored at 4 °C. The degree of substitution (DS), defined as the number of GA per 100 monomers, was analyzed by ultraviolet spectrophotometry, 1H NMR spectroscopy (using DMSO-d) and Fourier-transform infrared (FTIR) measurement. The molecular weight of HA-GA was measured by gel permeation chromatography (GPC) in water using an Agilent LC- 20AT system (Agilent, US) equipped with a RID-10A detector (Shimadzu, Japan). Shodex columns KS-805 and KS-802 (Shoedx, Japan) were used at a flow rate of 1.0 mL/ min.
Preparation and characterization of HA-GA@Ce6
200 mg HA-GA was dissolved in 20 mL phosphate buffered saline (PBS). 80 mg of Ce6 dissolved in 150 µL DMSO was added dropwise with vigorous stirring for 12 h. The mixture was dissolved in an ultrasonic bath for 15 min on ice and centrifuged at 2800 ×g for 15 min to remove unloaded Ce6. The supernatant was dialyzed against distilled water for 48 h to remove DMSO. The final micelle-based solution was carefully collected and used for further experiments.
The size distribution, polydispersity index and zeta potential of HA-GA@Ce6 were determined using a Zetasizer Nano ZS (Malvern, UK). Their morphology was observed by transmission electron microscopy (TEM; Hitachi, Japan). The stability of HA-GA and HA-GA@Ce6 in FBS was monitored by dynamic light scattering (DLS) to detect changes in size over different time periods at 37 °C. The content of FBS was greater than 90% (v/v).
Encapsulation efficiency and drug loading capacity of HA-GA@Ce6
The encapsulated Ce6 in HA-GA@Ce6 complexes was collected by emulsion breaking in methanol and detected using a fluorescence spectrophotometer based on a standard curve of free Ce6. The fluorescence of Ce6 was measured at an excitation wavelength of 405 nm. Encapsulation efficiency (EE) and loading efficiency (LE) were calculated according to the following formulae:
EE (%) = Cloaded / Ctotal × 100%
LE (%) = WCe6 / Wm × 100%
Ctotal is the concentration of total Ce6, Cloaded represents the concentration of Ce6 measured by fluorescence spectrophotometry, WCe6 is the weight of loaded Ce6 and Wm represents the total weight of micelles.
Reactive oxygen species-responsive behaviors of HA-GA@Ce6 in vitro
The disassembly of HA-GA@Ce6 after laser irradiation for 5 min was monitored by TEM to observe changes in morphology over different time periods.
To evaluate the light-triggered release behavior of GA and Ce6 from HA-GA@Ce6 micelles, the micelles were irradiated with light of 638 nm at an irradiance of 0.3 W/cm2 for 5 min. The solution was collected at 0, 15, and 30 min, and 1, 3, 6, 12, 24, and 48 h and analyzed by HPLC to detect the released GA and further analyzed by fluorescence spectrophotometry to detect Ce6.
ROS-triggered release of Ce6 in cells was studied using FRET (Förster resonance energy transfer). Ce6 and 1,1-dioctadecyl-3,3,3,3-tetramethylindotricarbocyanine iodide (DiR) were used as a FRET pair and co-loaded into micelles. FRET was confirmed by fluorescence spectroscopy. FRET micelles were irradiated for 2 min and their florescence spectra detected using a 405 nm excitation wavelength at different times (0, 3, 6, 12 h). In a cell study, laser irradiation at 638 nm and an irradiance of 0.3 W/cm2 for 2 min stimulated intracellular ROS generation. Briefly, 4T1 cells were incubated with FRET micelles for 2 h with or without laser irradiation for 2 min and then confocal laser scanning microscopy (CLSM) (Carl Zeiss AG, Oberkochen, Germany) images were captured. The observation parameters of CLSM were Ce6 λex/em 405/660 nm, DiR λex/em 405/740 nm.
To further visualize intracellular activation of HA-GA@Ce6, 4T1 cells were seeded in a confocal dish at a density of 5×10⁴ cells/dish and preincubated with N-acetyl-L-cysteine (NAC) for 20 min to inhibit generation of oxidizing molecules before the addition of DiR-coloaded HA-GA@Ce6 [26]. After incubation with HA-GA@Ce6 for 2 h, the cells were washed with PBS and imaged by CLSM.
Cellular uptake and HA competition
Intracellular uptake of HA-GA@Ce6 was analyzed using flow cytometry. Briefly, 4T1 cells (5×10⁴) were seeded into 24-well cell culture plates. After 24 h, the cells were treated with HA-GA@Ce6 for 2 h with a Ce6 dose of 2.5 µM. Free Ce6 was used as a control. Afterwards, Ce6-containing medium was removed and the cells were collected for analysis by flow cytometry.
To determine the effects of CD44 receptors on cellular uptake, 4T1 cells were seeded in petri dishes at a concentration of 5×10⁴ cells/dish. When cells reached 60% confluence, they were pretreated with free HA (10 mg/mL) for 20 min to saturate CD44 receptors [27]. After pretreatment, the cells were incubated with HA-GA@Ce6 for 2 h and fixed with 4% paraformaldehyde for 10 min. DAPI was added to stain the cell nuclei to identify intracellular drug locations. Images of cells were captured using CLSM.
Intracellular ROS generation and measurements
Cells (5×10⁴) were seeded in petri dishes and allowed to adhere overnight. When the cells reached 60% confluence, the culture medium was replaced with 2.5 µM Ce6, 1.5 µM GA, HA-GA, and HA-GA@Ce6. Untreated cells were used as a negative control. After incubating for 4 h, cells were washed with PBS and irradiated at 638 nm and an irradiance of 0.3 W/cm2 for 2 min. The cells were then stained with 2,7-dichlorodihydrofluorescein diacetate (DCFH-DA) for another 0.5 h at 37 °C. After washing with PBS, intracellular ROS generation was examined by CLSM and flow cytometry.
Consumption of intracellular GSH by GA
The concentration of intracellular GSH was measured using a reduced GSH assay kit (Nanjing Jiancheng Bioengineering Institute, China). Briefly, 4T1 cells were seeded in 12-well plates at a density of 1×10⁵ cells/well, and wells were treated individually with PBS, GA, Ce6, GA&Ce6 and HA-GA@Ce6 for 4 h (Ce6 = 2.5 µM, GA = 1.5 µM). Untreated cells were used as negative controls. N-Ethylmaleimide (NEM), a GSH inhibitor, was used as a positive control. During disruption of intracellular redox homeostasis, ROS concentrations should increase. The cells were then collected by trypsinization and processed according to the assay kit instructions.
Mitochondrion membrane potential measurements and cell apoptosis assay
Changes in mitochondrial membrane potential were measured by staining cells with rhodamine 123. In brief, cells were treated with HA-GA@Ce6 at an identical Ce6 concentration of 2.5 µM for 2 h at 37 °C, and then irradiated with a 638 nm laser and an irradiance of 0.3 W/cm2 for 2 min. A solution of rhodamine 123 reagent was added and incubated for 10 min at 37 °C. Hoechst 33258 was then added to stain cell nuclei. The cells were washed three times in PBS prior to CLSM.
To further investigate cytotoxic mechanisms, propidium iodide (PI) was used to stain the nuclei of non-viable apoptotic cells. Briefly, 2×10⁴ cells were seeded in 48-well cell culture dishes. When the cells reached 60% confluence, HA-GA@Ce6 was added at a Ce6 dose of 1.0 µM and a GA dose of 1.0 µM. Untreated cells were used as a negative control and Ce6 was used as a positive control. After culturing for 4 h, cells were irradiated with 638 nm laser light, at an irradiance of 0.3 W/cm2 for 2 min. After a further 20 h incubation, cells were stained with PI for 15 min for fluorescence microscopy and annexin V-FITC/PI flow cytometry.
Cytotoxicity assay of HA-GA@Ce6 in vitro
Cytotoxicity was measured by MTT assay. Briefly, 4T1 cells were seeded in 96-well plates at a density of 5000 cells/well in 150 μL RPMI-1640 medium. When cells reached 60% confluence, different concentrations of GA, Ce6, HA-GA and HA-GA@Ce6 were supplemented to cells for 24 h. After this period, cell viability was examined by MTT assay and expressed as relative cell viability by normalizing to untreated cells.
To validate ROS-dependent activation of HA-GA@Ce6, 4T1 cells were treated for 2 min with 638 nm laser light at an irradiance of 0.3 W/cm2 after incubation with different concentrations of HA-GA@Ce6 for 4 h. After incubation, cell viability was examined by MTT assay.
In vivo biodistribution of HA-GA@Ce6
To determine the biodistribution of HA-GA@Ce6 micelles, fluorescence images were taken. In brief, female BALB/c mice (18-22 g) were subcutaneously inoculated with 1×10⁵ 4T1 cells into the right mammary gland and tumors were allowed to grow until they were approximately 200 mm3. The mice were randomly divided into two groups (n = 3) and intravenously injected with free Ce6 or HA-GA@Ce6 at an equal Ce6 dose of 0.5 mg/kg. Near-infrared fluorescence imaging was carried out with a Kodak multimodal-imaging system IS2000MM (Kodak, USA) at 2, 4, 8, 12, 24, and 48 h after injection. The mice were sacrificed at 24 h and 48 h after injection. Ex vivo biodistribution images of the main organs (heart, liver, spleen, lung and kidney) and tumor were immediately taken.
Anti-tumor efficacy of HA-GA@Ce6-mediated combination therapy in vivo
To confirm anti-tumor efficacy in vivo, 4T1 tumor-bearing mice were established as described above and anticancer treatments were performed when the tumors were approximately 150 mm3. The mice were randomly divided into six groups (n = 10): GA (3.5 mg/kg), Ce6 (5 mg/kg), HA-GA@Ce6 (Ce6 = 5 mg/kg, GA = 3.5 mg/kg), HA-GA@Ce6 + laser, saline, and saline + laser. The mice were injected at intervals of three days (day one, four and seven) and subjected to 638 nm laser irradiation at an irradiance of 0.3 W/cm2 for 5 min at 4 h post-injection. Tumor size and mouse body weights were recorded every three days, and tumor volumes were calculated according to the following formula: tumor volume (mm3) = 0.5 × length × width2. Tumor-bearing mice were sacrificed on day 21 after initial drug treatment and various organs including liver, kidney, heart, lung, and tumor were harvested and fixed in 4% paraformaldehyde to prepare paraffin sections. Hematoxylin/eosin (H&E) staining was used for histological analysis and TdT-mediated dUTP nick-end labeling (TUNEL) assay was performed to assess apoptosis levels in the tumor.
Safety evaluation
For safety evaluations, 30 female BALB/c mice were randomly divided into five groups (n = 6) and saline, GA, Ce6, HA-GA and HA-GA@Ce6 were injected at intervals of three days (day one, four and seven). Blood was collected on day nine to assess liver toxicity using alanine transaminase (ALT) and aspartate transaminase (AST) and kidney toxicity was assessed using levels of blood urea nitrogen (BUN) and creatinine (CREA). The mice were sacrificed and major organs (heart, liver, spleen, lung and kidney) were collected for H&E staining.
Statistical analysis
All quantitative results are expressed as mean ± standard deviation (SD) unless otherwise noted. Statistical significance was set at **p < 0.01 and ***p < 0.001.
Results and discussion
Construction and characterization of HA-GA@Ce6
In this study, a ROS-sensitive prodrug HA-GA was designed and synthesized as shown in Figure S2 and Figure S3A. Firstly, a bis(3-bromopropyl) oxalate-linker was prepared and confirmed by 1H NMR (Figure S3B). HA-GA was then synthesized by conjugating HA to GA via the bis(3-bromopropyl) oxalate linker. The chemical structure of the GA-linker and HA-GA were confirmed by 1H NMR and FTIR, respectively (Figure S3C-E). The degree of substitution (DS) was calculated by 1H NMR spectroscopy from peak areas, determining that the DS of GA was 11.5 ± 0.1%. This result was consistent with GA quantification by ultraviolet spectrophotometry, which was determined to be 12.6 ± 0.1% according to the GA standard curve (Figure S4A). The GPC result demonstrated that the Mn and MW of the HA were 12456 and 14772, respectively. The Mn and MW of the HA-GA were 15639 and 17954, respectively. The DS, calculated by molecular weight, was approximately 12.3%, which was consistent with 1H NMR and ultraviolet spectrophotometry.
Owing to its amphiphilic nature, the resulting HA-GA conjugates could assemble into small micelle aggregates [28] when transferred from DMSO to PBS. The photosensitizer Ce6 was loaded into the hydrophobic core of the nano-carrier with a drug encapsulation efficiency of 72.87 ± 0.12% and a loading content of 22.58 ± 0.20%, as determined by ultraviolet-visible spectroscopy (the standard curve for Ce6 is shown in Figure S4B). After preparation, aqueous dispersions of HA-GA@Ce6 micelles were clear and transparent, but free Ce6 and GA in PBS tended to precipitate (Figure 1C). The mean hydrodynamic diameters and polydispersity indices (PDI) of HA-GA and HA-GA@Ce6 were characterized by DLS (Figure 1A-B). The size of the newly prepared HA-GA was approximately 196.6 nm and the PDI was 0.121 ± 0.002. The HA-GA@Ce6 exhibited a much smaller hydrodynamic diameter of 101.7 nm, with a PDI at 0.154 ± 0.004. The morphologies of HA-GA and HA-GA@Ce6 were determined by TEM, which indicated that both were well dispersed as nanoscale droplets with typical spherical shapes. The recorded sizes of the micelles were approximately 130 nm for HA-GA and 60 nm for HA-GA@Ce6. The larger micelle size determined by DLS when compared to TEM could be ascribed to the hydrated layer of HA. The smaller diameter of HA-GA@Ce6 micelles was possibly due to π-π stacking between Ce6 and GA, resulting in a more compact micelle structure. The determined particle size is suitable to take advantage of tumor EPR effects [29]. HA can actively target tumor cells mediated by the over-expression of CD44 receptors. The combination of passive and active targeting may allow HA-GA@Ce6 to accumulate at tumor sites, enabling selective delivery of drugs to cancer cells [30]. The surface zeta potential was -23.4 ± 0.83 mV for HA-GA and -19.7 ± 0.57 mV for HA-GA@Ce6 (Figure 1D), indicating anionic micelles had been successfully prepared.
Construction and characterization of HA-GA@Ce6. (A) Size distribution of HA-GA by DLS and TEM (inset). TEM scale bar: 200 nm. (B) Size distribution of HA-GA@Ce6 by DLS and TEM (inset). Scale bar: 100 nm. (C) Clear aqueous dispersions of HA-GA@Ce6 and prodrug HA-GA and precipitated free GA and Ce6. (D) Zeta potentials of HA, HA-GA and HA-GA@Ce6. (E) Size changes of HA-GA@Ce6 in PBS (pH 7.4) solution and FBS over 48 h. (F) Morphology observation of HA-GA@Ce6 after irradiation by TEM. Scale bar: 200 nm. (G) Release of Ce6 and (H) GA under different conditions.
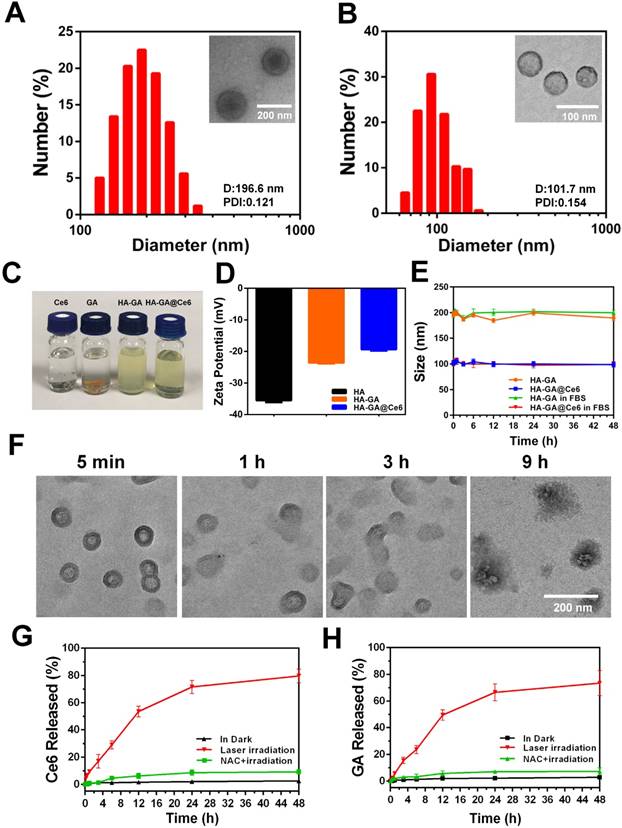
Colloidal stability, one of the most crucial factors for nanoscale drug delivery systems, was characterized by monitoring particle size. During incubation with PBS, the particle size of the micelles was consistent over seven days (Figure S5). In addition to colloidal stability, serum stability of HA-GA@Ce6 was determined using DLS. The data showed no obvious changes (Figure 1E), indicating these micelles exhibited good serum stability, which is favorable for in vivo drug delivery.
As stimuli-responsive micelles, HA-GA@Ce6 was expected to disassemble in the presence of appropriate stimuli, such as laser light at a wavelength 638 nm. To simulate the disassembly of micelles in vitro, the degradation behaviors of HA-GA@Ce6 were investigated after laser irradiation. Changes in morphology were observed by TEM (Figure 1F) over 9 h. To further investigate if disassembly of micelles could lead to accelerated release of GA and Ce6, micelles in a dialysis bag were irradiated by a 638 nm laser and the percolate was measured by HPLC to detect GA release and fluorescence spectrophotometry was used to detect Ce6. As described in Figure 1G, approximately 80% of Ce6 was released after 48 h, whereas only small levels of Ce6 were released from micelles in PBS without irradiation, mimicking the intracellular concentration of untreated tumor cells [31]. The release behavior of GA conformed to Ce6 and showed 75% cumulative release after 48 h (Figure 1H). However, when HA-GA@Ce6 was co-incubated with N-acetyl-L-cysteine (NAC) and irradiated for 5 min, low levels of Ce6 and GA were released from micelles after incubation for 48 h. These observations suggest that HA-GA@Ce6 exhibits controlled drug release, responding to ROS stimulation while maintaining its integrity in the environment of untreated cells.
Cellular uptake and laser-triggered oxidation regulation
The intracellular distribution of free Ce6 and HA-GA@Ce6 was evaluated by CLSM in murine 4T1 cells. As shown in Figure 2A, HA-GA@Ce6 exhibited strong fluorescence signals when compared to free Ce6. The higher uptake ratio of HA-coated micelles was ascribed to CD44-mediated uptake [32]. Therefore, to help validate this hypothesis, free HA was used to block CD44 receptors [33]. As expected, the intracellular fluorescence of HA-GA@Ce6 was reduced after free HA pretreatment, suggesting a decrease in the cellular uptake of HA-GA@Ce6 (Figure 2A). In addition, flow cytometry assessed the inhibitory effects of cellular uptake by free HA pretreatment (Figure 2B). The mean HA-GA@Ce6 fluorescence intensity (MFI) decreased after pretreatment with free HA (Figure 2C), indicating that CD44 receptors are key for the enhanced uptake of the micelles.
Cellular uptake and regulation of laser-triggered oxidation. (A) Cell uptake of free Ce6 and HA-GA@Ce6 with or without pretreatment by free HA. The red fluorescence indicates Ce6 and the blue fluorescence indicates the cell nuclei. The scale bar is 50 μm. (B) Cellular uptake of Ce6 and HA-GA@Ce6 (Ce6 = 5 µM) by flow cytometry. (C) The mean fluorescence intensity (MFI) of HA-GA@Ce6 decreased obviously after pretreatment by HA. (D) CLSM images of GA-, Ce6- and HA-GA@Ce6-induced ROS generation in vitro (scale bar = 50 μm). (E) Relative ROS generation from various treatments measured by flow cytometry. (F) Quantitation of GSH levels in 4T1 cells with various treatments. (G) FRET analysis of laser-responsive HA-GA@Ce6/DiR by CLSM. In the merged image, the yellow signal indicates co-localization of Ce6 (red) and DiR (green). Scale bar: 50 μm.
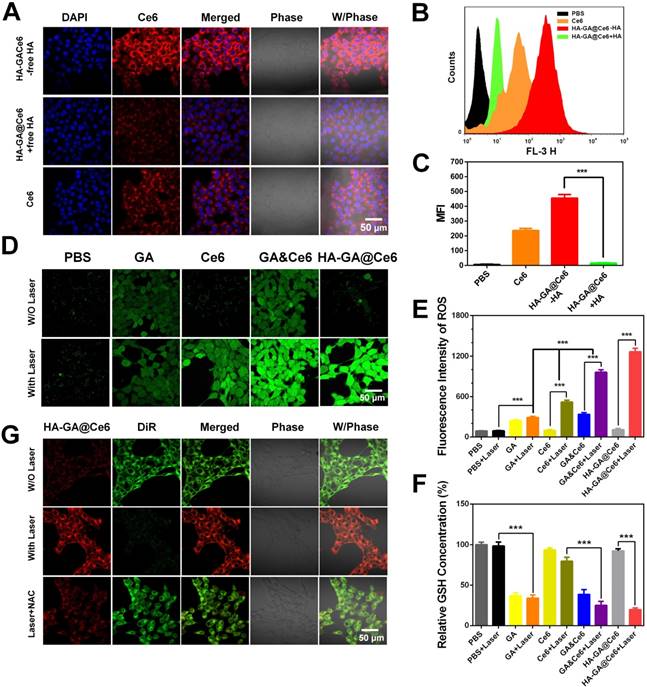
To evaluate ROS production by HA-GA@Ce6, 2,7-dichlorodi-hydrofluorescein diacetate (DCFH-DA) was employed as a fluorescence probe. The intensity of the green fluorescence is proportional to ROS production [34]. As shown in Figure 2D, HA-GA@Ce6 and Ce6 resulted in strong fluorescence signals after 4 h incubation with 4T1 cells followed by 2 min irradiation. Interestingly, considerable fluorescence signal was also observed in the GA group. These results were in accordance with the flow cytometry data (Figure 2E).
It is accepted that ROS-eliminating mechanisms in cancer cells are defective; therefore, these cells tend to exhibit high oxidative stress states when compared to normal cells. However, the high GSH concentration in the cytoplasm of tumor cells is important for adjusting intrinsic oxidative stress, thereby hindering ROS generation [35]. If intracellular redox homeostasis is disrupted, an increase in ROS production may occur. To verify this hypothesis, we measured GSH depletion and ROS elevation. To do this, we used NEM as a GSH inhibitor to deplete GSH, which simulates the role of GA but does not have as complex a mechanism as chemical agents (Figure S6). GA consumed intracellular GSH (Figure 2F). To further investigate the effects of GA in regulating ROS generation of PDT, the group GA&Ce6 (GA/Ce6 = 3.5/5) was designed. Much brighter fluorescence of GA&Ce6 was observed (Figure 2D-E), as well as strong depletion of GSH (Figure 2F). These observations suggested that weakening the anti-oxidative capability of cancer cells can lead to increased ROS, thus enhancing the anti-tumor efficacy of PDT [36].
Laser-triggered drug release
Bearing in mind that the peroxalate ester linkage could be fractured by ROS after irradiation, laser-triggered intracellular disassembly of HA-GA@Ce6 was measured by a FRET-based method [37]. Here, we established a FRET pair of Ce6 as the donor dye (red), and DiR as the acceptor dye (green), and the co-encapsulated micelles were referred to as HA-GA@Ce6/DiR [38]. The fluorescence emission spectrum of HA-GA@Ce6/DiR validated the occurrence of FRET (Figure S7). For cell studies, 4T1 cells were incubated with HA-GA@Ce6/DiR for 4 h. DiR green emission fluorescence was observed by CLSM, indicating the two dyes were co-encapsulated in micelles. Importantly, the micelles maintained their integrity in 4T1 cells. To generate high concentrations of ROS, laser light at a wavelength of 638 nm was applied. The cells exhibited strong red signal and weaker green fluorescence after irradiation (Figure 2G), indicating intracellular disassembly of the micelles such that the energy of Ce6 could not transfer to DiR. However, when the cells were pretreated with NAC, an inhibitor of ROS [39], green fluorescence was maintained, confirming micelle integrity. Thus, the high concentrations of ROS after laser irradiation could effectively trigger disassembly of HA-GA@Ce6.
In vitro tumor cell killing effects of HA-GA@Ce6
It is widely accepted that production of ROS, a key step in the PDT process, can cause the collapse of mitochondrial membrane potential (Δψ m) [11]. To investigate the influence of HA-GA@Ce6 on Δψ m, rhodamine 123 (Rh 123) was used as a fluorescent probe. Rh 123 is a cationic fluorescent dye that permeates the mitochondrial matrix in normal cells, causing green fluorescence to decrease or disappear. After apoptosis, the mitochondrial membrane collapses and Rh123 is released into the cytoplasm, leading to cytoplasmic green fluorescence. Thus, changes in Δψ m can be evaluated by fluorescence signals. Enhancement of green fluorescence after irradiation due to the collapse of mitochondrial Δψ m is shown (Figure 3A).
In vitro anti-tumor efficacy of HA-GA@Ce6. (A) CLSM images of Δψm collapse determined by rhodamine 123 (scale bar = 50 μm). (B) Cytotoxicity of 4T1 cells following various treatments for 24 h measured by MTT assay. (C) Cytotoxic effect of various treatments on 4T1 cells measured by PI staining using fluorescence microscopy (scale bar = 100 μm). (D) Annexin V-FITC/PI staining for cell apoptosis detected by FCM. Cytotoxicity of normal cells (E) WI-38 (F) L02 and (G) L929 cells with various treatments measured by MTT assay.
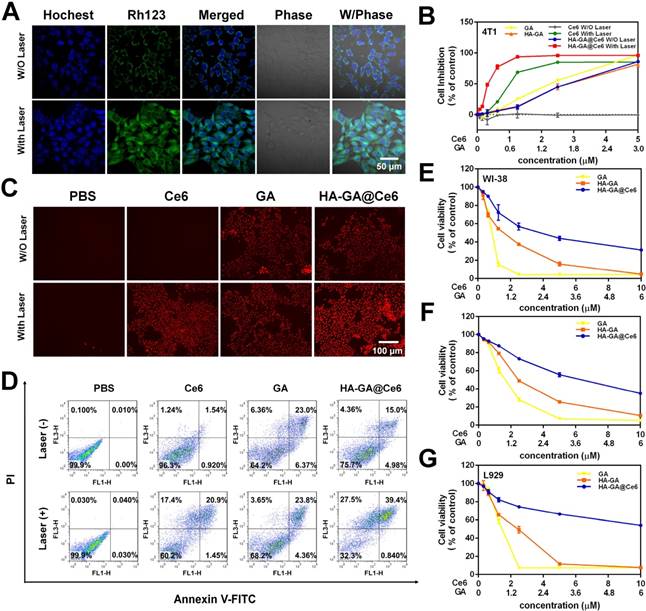
The in vitro tumor cell killing ability of HA-GA@Ce6 was evaluated in 4T1 cells by MTT assay. 4T1 cells supplemented with HA-GA@Ce6 and irradiated at 638 nm for 2 min exhibited significantly enhanced cytotoxicity when compared to HA-GA@Ce6 without irradiation and other forms of free GA or Ce6 (Ce6:GA=5:3). Notably, cytotoxicity increased with the concentration of Ce6 with a half lethal dose (IC50) of 0.34±0.01 µM at an incubation time of 24 h (Figure 3B). This phenomenon was attributed to the production of ROS by Ce6 and the consumption of GSH by GA. Furthermore, the cytotoxic effects of different forms on 4T1 cells was observed by propidium iodide (PI) staining (Figure 3C) and annexin V-FITC/PI staining (Figure 3D). These results suggested that the construction of HA-GA@Ce6 increased oxidative stress and suppressed GSH simultaneously, killing cancer cells and inhibiting tumor growth [40]. Moreover, treatment with HA-GA@Ce6 without irradiation exhibited lower toxicity than Ce6 and HA-GA in normal cells such as WI-38, L929 and L02, implying good biocompatibility (Figure 3E-G).
In vivo bio-distribution
In comparison with free drugs, tumor-specific accumulation and prolonged blood circulation are two key characteristics of nano-scale drugs. Therefore, we investigated the biodistribution of HA-GA@Ce6 in an ectopic 4T1 tumor-bearing mouse model using the Caliper IVIS Lumina II system. HA-GA@Ce6 and free Ce6 were administrated via intravenous injection. As shown (Figure 4A), a strong HA-GA@Ce6 fluorescence signal was observed at tumor sites 4 h post-injection. As time was extended, fluorescence at the tumor site was maintained and gradually increased up to 24 h post-injection. Furthermore, the tumor site showed strong fluorescence 48 h post-injection, implying tumor-targeted accumulation and retention of HA-GA@Ce6. In contrast, free Ce6 displayed minimal accumulation at tumor sites and had a highly diffuse fluorescence pattern.
In vivo biodistribution. (A) In vivo fluorescence images of the 4T1 tumor-bearing mice at 2, 4, 8, 12, 24, and 48 h after intravenous injection of HA-GA@Ce6 or free Ce6. (B) Ex vivo fluorescence imaging of the major organs and tumors at 24 and 48 h after intravenous injection. (C) Quantitative region-of-interest (ROI) analysis of fluorescence signals of the tumor and normal organs at 24 h and (D) 48 h post-injection. Data are shown as mean ± SD (n = 3). ***p<0.001
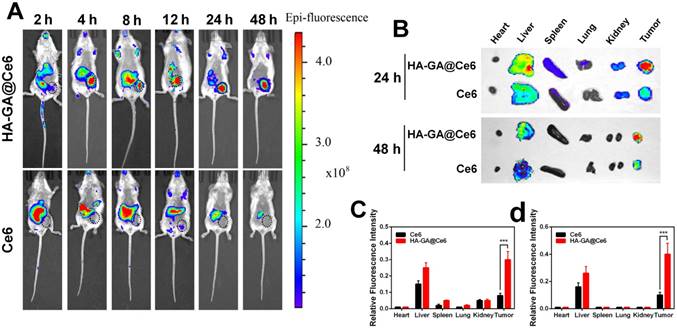
To further verify the tumor-specific accumulation properties of HA-GA@Ce6, ex vivo fluorescence imaging of major organs and tumors was performed at 24 h and 48 h post-injection (Figure 4B). The tumor fluorescence intensity of HA-GA@Ce6 was approximately 3.75-fold higher than that of free Ce6 at 24 h and 4-fold higher than that of free Ce6 at 48 h post-injection. These observations suggested that free Ce6 groups displayed low fluorescence intensities in tumors at all timepoints. The results were confirmed by quantitative region-of-interest (ROI) analysis (Figure 4C-D).
In vivo anti-tumor efficacy
The in vitro anti-tumor efficacy of HA-GA@Ce6 was anticipated to efficiently suppress tumor growth. From observations of in vitro cytotoxicity in 4T1 cells and superior tumor accumulation in vivo, we further evaluated the anti-tumor efficacy of HA-GA@Ce6 in ectopic 4T1 tumor-bearing mouse models. Therapeutic effects were assessed by measuring tumor volumes (Figure 5A). The tumors of saline and saline + laser groups exhibited rapid growth after seeding. As expected, the HA-GA@Ce6 + laser group displayed tumor inhibition rate after three intravenous injections. In contrast, HA-GA@Ce6 without laser irradiation moderately suppressed tumor growth. These observations can be ascribed to the excellent tumor accumulation and slow disassembly of the micelles, which induced chemotherapy by GA. It was also noteworthy that during treatments, the drug treatment groups showed steady increases in body weight that were consistent with the saline and saline + laser groups, indicating negligible systemic cytotoxicity of HA-GA@GA (Figure 5B).
In vivo anti-tumor efficacy. (A) Tumor growth curves of different groups after treatment on the indicated days (shown by arrows). (B) body weight changes of 4T1 tumor-bearing mice over the treatment period. (C) Representative photographs of the 4T1-bearing mice and tumors taken on day 21. The circles indicate the tumor sites. Ex vivo photographs of tumors are vertically aligned top-to-bottom according to the left-to-right whole-animal images. (D) Tumor weights of the treatment groups after sacrifice. (E) Ex vivo histological analyses of tumor sections after various treatments by H&E and TUNEL staining. Scale bar = 100 μm. Data are shown as mean ± SD (n = 10). ***p<0.001.
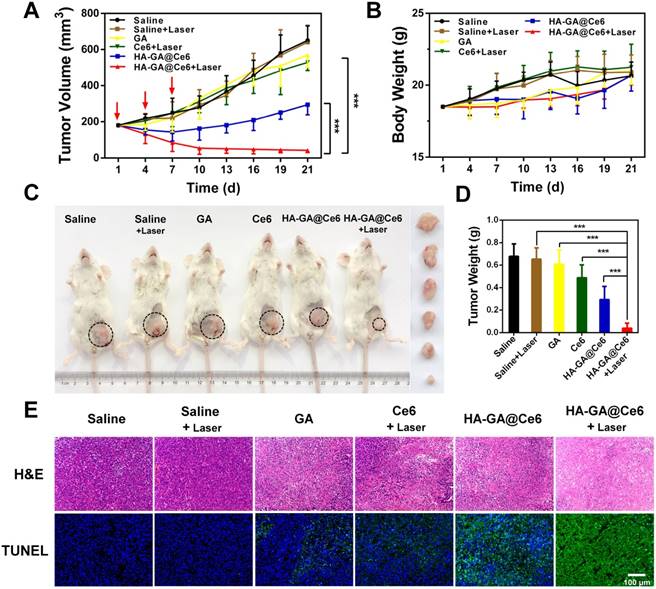
Mice were then sacrificed and tumors were collected, recorded and weighed (Figure 5C and Figure S8). The tumor weight of the HA-GA@Ce6 + laser group was only 6% of that of the saline + laser group and showed significant differences from those of the HA-GA@Ce6 without laser, free Ce6, and GA groups (Figure 5D). Tumor weights were consistent with tumor volumes (Figure 5A). Representative mouse images and ex-tumor images of each group on day 21 are shown (Figure 5C). Representative ex vivo tumor images are shown (Figure S8).
Histological analyses were performed to estimate the in vivo anti-tumor efficacy. H&E staining showed that HA-GA@Ce6 + laser caused necrosis and apoptosis of tumor cells, caused by Ce6-induced ROS generation and subsequent release of GA (Figure 5E). Data from the TUNEL assay revealed high levels of apoptosis in tumors harvested from mice treated with HA-GA@Ce6 + laser, while tumors in the HA-GA@Ce6 only group exhibited weak green fluorescence, indicating slight apoptosis. Thus, the comparison of with or without laser irradiation treatment groups validated the importance of the laser as a trigger for the combination therapy.
Safety evaluation
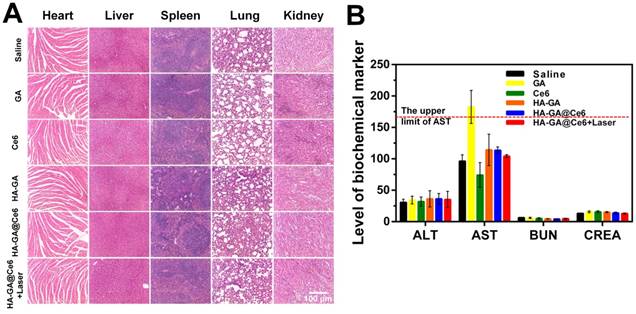
To evaluate the potential systemic toxicity of our drug delivery system, the main organs were subjected to H&E staining to prove there was no damage to the mice from the injection or PDT process of HA-GA@Ce6 (Figure 6A). Hepatotoxicity is reflected by elevated levels of serum AST and ALT, and renal toxicity is evaluated by BUN and CREA. All groups showed no significant differences in these markers when compared to the saline group, except for the free GA group. AST levels of this group were elevated, which may have been due to a slight hepatotoxicity of free GA at such high dosages. Nonetheless, this observation highlights the efficacy of HA-GA@Ce6 as having no toxic effects on the liver and kidney even following PDT (Figure 6B). Furthermore, when whole blood was collected from each mouse and routine blood tests were performed, all major blood indices in the HA-GA@Ce6 group were within normal physiological limits (Table 1).
Safety evaluation. (A) Histological assessment of the major organs (heart, liver, spleen, lung and kidney) by H&E staining. (B) Evaluation of liver functions (AST, ALT) and renal functions (BUN, CREA) in healthy mice after various treatments. Scale bar = 100 μm. Data are shown as mean ± SD (n = 6).
Routine blood test results of mice after treatment (data are shown as mean ± SD, n = 6).
| Group | WBC | RBC | hemoglobin | platelet | neutrophil | lymphocyte | eosinophil | monocyte | basophil |
|---|---|---|---|---|---|---|---|---|---|
| 100/μL | 1000/μL | g/L | 1000/μL | 1000/μL | 1000/μL | 1000/μL | 1000/μL | 1000/μL | |
| Saline | 7.51±0.46 | 9.07±0.29 | 144.33±3.21 | 853.00±133.19 | 1.41±0.69 | 4.05±1.59 | 0.08±0.07 | 0.27±0.14 | 0.04±0.05 |
| GA | 6.31±1.29 | 8.40±0.63 | 147.67±4.04 | 497.00±95.25 | 1.50±0.37 | 4.29±0.95 | 0.18±0.11 | 0.26±0.02 | 0.08±0.07 |
| Ce6 | 7.55±0.66 | 8.31±1.10 | 143.33±15.95 | 869.67±60.58 | 1.39±0.44 | 4.51±1.83 | 0.01±0.01 | 0.30±0.15 | 0.00±0.00 |
| HA-GA | 7.98±1.33 | 10.13±0.11 | 165.67±6.03 | 565.67±154.97 | 1.59±0.89 | 3.66±2.36 | 0.09±0.11 | 0.27±0.20 | 0.03±0.05 |
| HA-GA@Ce6 | 6.71±0.48 | 9.31±0.85 | 153.33±18.90 | 662.33±215.07 | 1.14±0.18 | 4.43±1.14 | 0.13±0.18 | 0.30±0.06 | 0.04±0.07 |
| HA-GA@Ce6 +Laser | 6.45±1.26 | 9.29±0.18 | 162.67±5.03 | 580.33±179.78 | 1.23±0.20 | 4.07±1.65 | 0.12±0.13 | 0.31±0.15 | 0.05±0.06 |
Conclusions
In summary, we developed a tumor-specific laser-activated HA-GA@Ce6 with an oxidation-regulated strategy for enhancing photodynamic therapy. The construction comprised a ROS-sensitive HA-GA prodrug and the photosensitizer Ce6. The prodrug HA-GA@Ce6 accumulates in the tumor site via CD44-mediated active targeting and EPR effects, while possessing remarkable retention capabilities. Ce6 increased oxidative stress after irradiation and activated the pro-drug HA-GA. GA efficiently consumed GSH to weaken the antioxidative capability of the cancer cells and killed them directly. Such a combined photodynamic delivery system can efficiently kill tumor cells both in vitro and in vivo. Overall, our results imply a promising potential for PDT to achieve superior anti-tumor efficacy by adjusting intracellular oxidation levels.
Abbreviations
ALT: alanine transaminase; AST: aspartate transaminase; BUN: blood urea nitrogen; Ce6: chlorin e6; CLSM: confocal laser scanning microscopy; CREA: creatinine; DAPI: 4',6-diamidino-2-phenylindole; DCFH-DA: dichlorodihydrofluorescein diacetate; DiR: 1,1-dioctadecyl-3,3,3,3-tetramethylindotricarbocyanine iodide; DLS: dynamic light scattering; DMSO: dimethyl sulphoxide; DS: degree of substitution; EDTA: ethylenediamine tetra acetic acid; EE: encapsulation efficiency; FBS: fetal bovine serum; FCM: flow cytometry; FRET: Förster resonance energy transfer; FTIR: Fourier transform infrared spectroscopy; GA: gambogic acid; GPC: gel permeation chromatography; GSH: glutathione; HA: hyaluronic acid; H&E: haematoxylin and eosin; HPLC: high-performance liquid chromatography; LE: loading efficiency; MTT: 3-(4,5-dimethylthiazol-2-yl)-2,5-diphenyltetrazolium bromide; MWCO: molecular weight cut off; NAC: N-acetyl-L-cysteine; NEM: N-Ethylmaleimide; PI: propidium iodide; NMR: nuclear magnetic resonance; PBS: phosphate buffered saline; PDI: polydispersity index; PDT: photodynamic therapy; Rh123: rhodamine 123; ROS: reactive oxygen species; RT: room temperature; TBA: tetrabutylammonium hydroxide; TEM: transmission electron microscopy; TUNEL: terminal deoxynucleotidyl transferase dUTP nick end labeling.
Acknowledgements
This project was supported by the National Natural Science Foundation of China (Grant Nos. 81673567). We thank International Science Editing for editing this manuscript.
Supplementary Material
Supplementary figures.
Competing Interests
The authors have declared that no competing interest exists.
References
1. Master A, Livingston M, Sen Gupta A. Photodynamic nanomedicine in the treatment of solid tumors: perspectives and challenges. J Control Release. 2013;168:88-102
2. Felsher DW. Cancer revoked: oncogenes as therapeutic targets. Nature reviews Cancer. 2003;3:375-80
3. Allison RR, Downie GH, Cuenca R, Hu X-H, Childs CJH, Sibata CH. Photosensitizers in clinical PDT. Photodiagnosis Photodyn Ther. 2004;1:27-42
4. Cheng Y, Doane TL, Chuang CH, Ziady A, Burda C. Near infrared light-triggered drug generation and release from gold nanoparticle carriers for photodynamic therapy. Small. 2014;10:1799-804
5. Wang T, Wang D, Yu H, Wang M, Liu J, Feng B. et al. Intracellularly acid-switchable multifunctional micelles for combinational photo/chemotherapy of the drug-resistant tumor. ACS Nano. 2016;10:3496-508
6. Park H, Na K. Conjugation of the photosensitizer Chlorin e6 to pluronic F127 for enhanced cellular internalization for photodynamic therapy. Biomaterials. 34; 6992-7000.
7. Jeong H HM, Lee SJ, Koo H, Kwon IC, Jeong SY, Kim K. Photosensitizer-conjugated human serum albumin nanoparticles for effective photodynamic therapy. Theranostics. 2011;6:230-9
8. Bellnier DA, Greco WR, Nava H, Loewen GM, Oseroff AR, Dougherty TJ. Mild skin photosensitivity in cancer patients following injection of Photochlor (2-[1-hexyloxyethyl]-2-devinyl pyropheophorbide-a; HPPH) for photodynamic therapy. Cancer Chemother Pharmacol. 2006;57:40-5
9. Zhou ZJ, Song JB, Nie LM, Chen XY. Reactive oxygen species generating systems meeting challenges of photodynamic cancer therapy. Chem Soc Rev. 2016:45 23; 6597-6626
10. Chunbai He DL, Wenbin Lin. Self-assembled coreshell nanoparticles for combined chemotherapy and photodynamic therapy of resistant head and neck cancers. ACS Nano. 2015;9:991-1003
11. Feng B, Zhou FY, Xu ZA, Wang TT, Wang DG, Liu JP, Fu YL, Yin Q, Zhang ZW, Yu HJ, Li YP. Versatile prodrug nanoparticles for acid-triggered precise imaging and organelle-specifc combination cancer therapy. Adv Funct Mater. 2016;26:7431-7442
12. Zhao L GQ, You QD, WU ZQ, Gu HY. Gambogic acid induces apoptosis and regulates expressions of bax and bcl-2 protein in human gastric carcinoma MGC-803 cells. Biol Pharm Bull. 2004;27:998-1003
13. Duan D, Zhang B, Yao J, Liu Y, Sun J, Ge C. et al. Gambogic acid induces apoptosis in hepatocellular carcinoma SMMC-7721 cells by targeting cytosolic thioredoxin reductase. Free Radic Biol Med. 2014;69:15-25
14. Yan. Gambogic acid inhibits the growth of osteosarcoma cells in vitro by inducing apoptosis and cell cycle arrest. Oncol Rep. 2011;25:1289-1295
15. Wang X CW. Gambogic acid is a novel anti-cancer agent that inhibits cell proliferation, angiogenesis and metastasis. Anticancer Agents Med Chem. 2012;12:994-1000
16. Nie F, Zhang X, Qi Q, Yang L, Yang Y, Liu WY, Lu N, Wu ZQ, You QD, Guo QL. Reactive oxygen species accumulation contributes to gambogic acid-induced apoptosis in human hepatoma SMMC-7721 cells. Toxicology. 2009:260 1-3, 60-7
17. Pan H, Michael L, Beshiri J, Yin JJ, Fang L, Supreet AHN, Corey E, Zhang Y, Liu J, Fan H, Kelly HLK. Gambogic acid inhibits thioredoxin activity and induces ROS mediated cell death in castration-resistant prostate cancer. Oncotarget. 2017:8 44; 77181-77194
18. Ju E, Dong K, Chen Z, Liu Z, Liu C, Huang Y. et al. Copper(II)-graphitic carbon nitride triggered synergy: improved ROS generation and reduced glutathione levels for enhanced photodynamic therapy. Angew Chem Int Ed Engl. 2016;55:11467-71
19. Lin LS, Song JB, Song L, Ke KM, Liu YJ, Zhou ZJ, Shen ZY, Li J, Yang Z, Tang W, Niu G, Yang HH, Chen XY. Simultaneous fenton-like ion delivery and glutathione depletion by MnO2-based nanoagent to enhance chemodynamic therapy. Angew Chem Int Ed Engl. 2018:57 4902 -4906
20. Ng KK, Zheng G. Molecular interactions in organic nanoparticles for phototheranostic applications. Chem Rev. 2015;115:11012-42
21. Lee D, Khaja S, Velasquez-Castano JC, Dasari M, Sun C, Petros J, Taylor WR, Murthy N. In vivo imaging of hydrogen peroxide with chemiluminescent nanoparticles. Nat Mater. 2007:6 10; 765-9
22. Gao S, Wang J, Tian R, Wang G, Zhang L, Li Y. et al. Construction and evaluation of a targeted hyaluronic acid nanoparticle/photosensitizer complex for cancer photodynamic therapy. ACS Appl Mater Interfaces. 2017;9:32509-19
23. Yoon HY, Koo H, Choi KY, Lee SJ, Kim K, Kwon IC. et al. Tumor-targeting hyaluronic acid nanoparticles for photodynamic imaging and therapy. Biomaterials. 2012;33:3980-9
24. Palumbo FS, Agnello S, Fiorica C, Pitarresi G, Puleio R, Tamburello A. et al. Hyaluronic acid derivative with improved versatility for processing and biological functionalization. Macromol Biosci. 2016;16:1485-96
25. Palumbo FS, Pitarresi G, Albanese A, Calascibetta F, Giammona G. Self-assembling and auto-crosslinkable hyaluronic acid hydrogels with a fibrillar structure. Acta Biomater. 2010;6:195-204
26. Palumbo FS, Pitarresi G, Fiorica C, Matricardi P, Albanese A, Giammona G. In situ forming hydrogels of new amino hyaluronic acid/benzoyl-cysteine derivatives as potential scaffolds for cartilage regeneration. Soft Matter. 2012;8:4918
27. Choi KY, Chung H, Min KH, Yoon HY, Kim K, Park JH, Kwon I C, Jeong SY. Self-assembled hyaluronic acid nanoparticles for active tumor targeting. Biomaterials. 2010:31 1; 106-14
28. Huang P, Wang D, Su Y, Huang W, Zhou Y, Cui D. et al. Combination of small molecule prodrug and nanodrug delivery: amphiphilic drug-drug conjugate for cancer therapy. J Am Chem Soc. 2014;136:11748-56
29. Tammam SN, Azzazy HME, Lamprecht A. The effect of nanoparticle size and NLS density on nuclear targeting in cancer and normal cells; impaired nuclear import and aberrant nanoparticle intracellular trafficking in glioma. J Control Release. 2017;253:30-6
30. Maeda H, Wu J, Sawa T, Matsumura Y, Hori K. Tumor vascular permeability and the EPR effect in macromolecular therapeutics: A review. J Control Release. 2000:65 271-284
31. Skandalis SS, Gialeli C, Theocharis AD, Karamanos NK. Advances and advantages of nanomedicine in the pharmacological targeting of hyaluronan-CD44 interactions and signaling in cancer. Adv Cancer Res. 2014;123:277-317
32. Song S, Qi H, Xu J, Guo P, Chen F, Li F. et al. Hyaluronan-based nanocarriers with CD44-overexpressed cancer cell targeting. Pharm Res. 2014;31:2988-3005
33. Kuang Y, Balakrishnan K, Gandhi V, Peng X. Hydrogen peroxide inducible DNA cross-linking agents: targeted anticancer prodrugs. J Am Chem Soc. 2011;133:19278-81
34. Jiang J, Auchinvole C, Fisher K, Campbell CJ. Quantitative measurement of redox potential in hypoxic cells using SERS nanosensors. Nanoscale. 2014;6:12104-10
35. Trachootham D, Alexandre J, Huang P. Targeting cancer cells by ROS-mediated mechanisms: a radical therapeutic approach. Nat Rev Drug Discov. 2009;8:579-91
36. Noh J, Kwon B, Han E, Park M, Yang W, Cho W. et al. Amplification of oxidative stress by a dual stimuli-responsive hybrid drug enhances cancer cell death. Nat Commun. 2015;6:6907
37. Zhou Z, Li H, Wang K, Guo Q, Li C, Jiang H. et al. Bioreducible cross-linked hyaluronic acid/calcium phosphate hybrid nanoparticles for specific delivery of siRNA in melanoma tumor therapy. ACS Appl Mater Interfaces. 2017;9:14576-89
38. Feng L, Tao D, Dong Z, Chen Q, Chao Y, Liu Z. et al. Near-infrared light activation of quenched liposomal Ce6 for synergistic cancer phototherapy with effective skin protection. Biomaterials. 2017;127:13-24
39. Spagnuolo G, D'Anto V, Cosentino C, Schmalz G, Schweikl H, Rengo S. Effect of N-acetyl-L-cysteine on ROS production and cell death caused by HEMA in human primary gingival fibroblasts. Biomaterials. 2006;27:1803-9
40. Li J, Dirisala A, Ge Z, Wang Y, Yin W, Ke W. et al. Therapeutic vesicular nanoreactors with tumor-specific activation and self-destruction for synergistic tumor ablation. Angew Chem Int Ed Engl. 2017;56:14025-30
Author contact
![]() Corresponding authors: Prof. Wenyuan Liu, Tel/Fax: 86 25 83271038, Email: liuwenyuanedu.cn; Prof. Feng Feng, Tel/Fax: 86 25 86185216, E-mail: fengfengedu.cn
Corresponding authors: Prof. Wenyuan Liu, Tel/Fax: 86 25 83271038, Email: liuwenyuanedu.cn; Prof. Feng Feng, Tel/Fax: 86 25 86185216, E-mail: fengfengedu.cn