Theranostics
13.3
Impact Factor
- Current Issue
- Advance Articles
- Volume 16; 2026
- Volume 15; 2025
- Volume 14; 2024
- Volume 13; 2023
- Volume 12; 2022
- Archive
- Cover Images
- Cover Suggestion
- Special Issues
Top
Introduction
Methods
Results
Discussion
Conclusion
Abbreviations
Supplementary Material
Acknowledgements
References
Introduction
Methods
Results
Discussion
Conclusion
Abbreviations
Supplementary Material
Acknowledgements
References
International Journal of Biological Sciences
International Journal of Medical Sciences
 Global reach, higher impact

Theranostics 2018; 8(15):4116-4128. doi:10.7150/thno.26539 This issue Cite
Research Paper
Near-infrared fluorescence imaging in the largely unexplored window of 900-1,000 nm
Guanjun Deng1,2, Sanpeng Li1,2, Zhihong Sun1, Wenjun Li1, Lihua Zhou1, Jiali Zhang1,2, Ping Gong1 ![]() , Lintao Cai1
, Lintao Cai1 ![]()
1. Guangdong Key Laboratory of Nanomedicine, Shenzhen Engineering Laboratory of Nanomedicine and Nanoformulations, CAS Key Lab for Health Informatics, Shenzhen Institutes of Advanced Technology, Chinese Academy of Sciences, Shenzhen 518055, China
2. University of Chinese Academy of Sciences, Beijing 100049, China
Received 2018-4-7; Accepted 2018-6-3; Published 2018-7-16
Citation:
Deng G, Li S, Sun Z, Li W, Zhou L, Zhang J, Gong P, Cai L. Near-infrared fluorescence imaging in the largely unexplored window of 900-1,000 nm. Theranostics 2018; 8(15):4116-4128. doi:10.7150/thno.26539. https://www.thno.org/v08p4116.htm
Other stylesAbstract

Near-infrared (NIR) fluorescence imaging has relied on fluorophores that emit in the 700-900 nm NIR-Ia or 1,000-1,700 nm NIR-II window for generating deep-tissue images. Up until now, there have been few fluorophores developed for the 900-1,000 nm NIR-Ib window. This is largely because NIR-Ib light is thought to be strongly absorbed by water.
Methods: Here we found that six heptamethine dyes had distinct emission peaks in both the NIR-Ia and NIR-Ib window. We tested the performance of these contrast agents by introducing them into the leaves of the common house plant Epipremnum aureum with early stage anthracnose leaf infections from Khaya senegalensis, as well as injecting them into the hind feet of nude mice and tails of tumour-bearing mice in vivo.
Results: Heptamethine dyes yielded superior images of leaf venation, anthracnose infection locations, sentinel lymph nodes, brain tumours and subcutaneous tumours in the NIR-Ib window. We found that NIR-Ib images had markedly enhanced signal-to-background ratio because autofluorescence, scattering and light absorption by biological tissues and water were weaker at longer wavelengths.
Conclusion: NIR-Ib fluorescence imaging was a powerful method for studying sentinel lymph nodes, tumours, leaf veins and early anthracnose infection locations in plant leaves. The findings challenge our current view of NIR fluorescence imaging and may have important implications for biomedical research and image-guided cancer surgery.
Keywords: near-infrared fluorescence imaging, heptamethine dyes, leaf vein imaging, lymphatic imaging, image-guided cancer surgery
Introduction
Near-infrared (NIR) fluorescence imaging is a fast, convenient and non-invasive imaging technique for visualizing deep-tissue structures [1-9]. It has been widely used by scientists to study anatomical features, internal organs and lymphatic vasculatures, as well as by clinicians to diagnose diseases, locate tumours and assist surgical procedures. Conventionally, fluorophores that emit light in the 700-900 nm NIR-Ia window upon excitation are used to illuminate objects of interest [10-19]. However, recent experiments with single-walled carbon nanotubes, quantum dots and small molecules that fluoresce in the 1,000-1,700 nm NIR-II window have highlighted the benefits of imaging at longer wavelengths [20-34], including increased spatial resolution, signal-to-background ratio (SBR) and penetration depth. Subsequently, these discoveries have led to a surge of interest in the application of NIR-II fluorescence imaging and the development of NIR-II fluorophores.
Despite these advances, however, little attention has been paid to fluorescence imaging in the 900-1000 nm NIR-Ib window [35, 36]. There are several reasons for this. First, NIR-Ib light is thought to be unsuitable for deep-tissue imaging because water, the main constituent of most biological samples, has an absorption peak centred at 970 nm [37]. Second, there are few known fluorophores with emission peaks in the NIR-Ib window [38]. Third, silicon cameras, the most widely used photodetectors for detecting NIR light, have sensitivity up to 900 nm only. Although nowadays there are indium-gallium-arsenide (InGaAs) cameras that can detect photons in the 900-1,700 nm window, these cameras are still a rarity [23, 39].
In this study, we report six heptamethine dyes that have distinct emission peaks in both the NIR-Ia and NIR-Ib window. These dyes, namely IR-775, IR-780, IR-783, IR-797, IR-806 and IR-808, exhibit excellent solubility in water, low cytotoxicity and intrinsic tumour-targeting properties. To test their feasibility as contrast agents, we performed NIR-Ia and NIR-Ib fluorescence imaging on live animals and plants following the administration of IR-808 via intravenous injection and root uptake, respectively. To our surprise, NIR-Ib fluorescence imaging yielded clear images of leaf venation, plant anthracnose infection locations, sentinel lymph nodes, brain tumours and subcutaneous tumours. Moreover, the spatial resolution, SBR and penetration depth of NIR-Ib images were superior to those of NIR-Ia images. To better understand the underlying mechanisms, we analysed signals from a simulated leaf/muscle comprising IR-808 in aqueous solution surrounded by leaf/mouse tissue homogenate using a spectral unmixing approach [40]. Our results show that autofluorescence, scattering and light absorption by biological tissues in the NIR-Ib window were much less than those in the NIR-Ia window. Therefore, despite a lower quantum yield, NIR-Ib signals were greater than NIR-Ia signals. Finally, to demonstrate that NIR-Ib fluorescence imaging has unique benefits, we compared signals between two simulated capillary networks placed in water, one containing IR-808 and the other containing IR-1061 (the latter has an emission peak in the NIR-II window). At the water depth of 20 mm, we detected signals in the capillary network containing IR-808 but not IR-1061. The result suggests that, contrary to widespread impressions, NIR-Ib light is actually ideal for imaging biological tissues and water-rich samples.
Methods
Materials
Heptamethine cyanine dyes (IR-775, IR-780, IR-783, IR-797, IR-806, IR-808), Intralipid and dimethyl sulfoxide (DMSO) were obtained from Sigma-Aldrich (St. Louis., MO, USA). Cell counting kit-8 (CCK-8) was purchased from Dojindo (Tokyo, Japan). Calcein-AM and propidium iodide (PI), fetal bovine serum (FBS), DMEM, trypsin-EDTA and penicillin-streptomycin were purchased from Gibco Life Technologies (AG, Switzerland). All other chemicals used in this study were of analytical reagent grade and used without further purification. Milli-Q grade (R > 18 MΩ cm) water was used throughout. Human glioblastoma luciferase-labeled U87 cell lines (U87L) were purchased from American Type Culture Collection (ATCC, Manassas, VA).
Preparation of leaf/muscle homogenate
Leaf/muscle tissue homogenate (5%) in buffer solution (50 mM Tris-HCl, 0.25 M sucrose, pH 7.4) was prepared. 5% leaf homogenate: a tube was packed with 0.5 g leaves collected from Epipremnum aureum and cut up by scissors; 9.5 mL buffer solution was added into the tube and the leaves were ground. 5% muscle homogenate: a tube was packed with 0.5 g muscle collected from BALB/c mice and cut up by scissors; 9.5 mL buffer solution were added into the tube and the tissues were homogenized.
Optical characterization of IR-X dyes
UV/vis absorption spectra were measured using a PerkinElmer Lambda 25 UV/vis absorption spectrophotometer. Fluorescence emission spectra of IR-X dyes were measured using an Edinburgh F920 fluorescence spectrometer equipped with R928P and G8605-23 photodetectors. Excitation and emission slits were set to 5 nm. Autofluorescence emission spectra of 5% leaf and mouse tissue homogenates were measured using an Edinburgh F920 fluorescence spectrometer equipped with Hamamatsu R928P and G8605-23 photodetectors. Total fluorescence spectra of simulated leaf/muscle were measured using an Edinburgh F920 fluorescence spectrometer equipped with R928P and G8605-23 photodetectors. In the complex system, IR-808 solution placed in a small 4 × 4 mm cuvette was embedded into 5% leaf/mouse tissue homogenate in a 10 × 10 mm cuvette. The spectral response for NIR-Ia and NIR-Ib window detector were measured, and the quantum efficiency of NIR-Ib detector was similar to NIR-Ia (Figure S1).
Determination of fluorescence quantum yield of IR-X dyes
The fluorescence quantum yield of IR-X dyes was determined against the reference fluorophore IR-26 dye with a known quantum yield of 0.5%.The optical absorbance was measured for both IR-X dyes solution and IR-26 dye solution at 808 nm using a PerkinElmer Lambda 25 UV/vis absorption spectrophotometer. Then their fluorescence emission intensity was measured using an Edinburgh F920 fluorescence spectrometer equipped with G8605-23 photodetectors under the same 808 nm excitation. Using the measured optical density (OD) and spectrally integrated fluorescence intensity (F), one can calculate the quantum yield of IR-X dyes according to the following formula, Φx(λ)= Φst (λ)*(Fx/Fst) *[(1-10-ODst(λ))/(1-10-ODx(λ))].
NIR-Ia and NIR-Ib fluorescence imaging
The NIR-Ia imaging, including lymphatic imaging, tumour imaging and leaf vein imaging, was obtained using an IVIS spectrum system (Caliper Life Sciences, Hopkinton, MA, USA) equipped with a silicon CCD camera (detection range 350-900 nm) and a 700-900 nm bandpass filter. The excitation wavelength was 680 nm and NIR-Ia images were taken at a fixed exposure time of 1 s. The images were processed by Maestro software. NIR-Ib fluorescence imaging, including in vitro imaging, lymphatic imaging, tumour imaging and leaf vein imaging, was performed with a 640 × 512 pixel two-dimensional InGaAs/SWIR VGA standard camera (detection range 900-1,700 nm, Photonic Science, UK) equipped with a 900-1,000 nm bandpass filter (Thorlabs FEL, Newton, NJ, USA). A NIR lens pair SWIR-35 (Navitar, Rochester, NY, USA) was used to focus the image onto the photodetector. The excitation light was provided by an 808-nm diode laser (laser glow technologies, Canada). The excitation power density at the imaging plane was 45 mW/cm2. The NIR-Ib images were taken at a fixed exposure time of 200 ms and Matlab 7 was used to process the images for any necessary flat-field correction.
Leaf vein imaging
Epipremnum aureum were grown in hydroponic culture containing 50 µg/mL IR-808 under long-day conditions (16 h light, 8 h dark) at 20 °C with 40% humidity. Leaves were fixed and NIR-Ia images were acquired on an IVIS spectrum system with 680 nm excitation and emission bandpass of 700-900 nm every 12 h. For NIR-Ib imaging, the excitation laser was an 808 nm laser diode. Emission was typically collected with a 900-1,000 nm bandpass filter.
Animal handling
Six-week-old female BALB/c nude mice were obtained from Vital River Laboratory Animal Technology Co. Ltd, Beijing, China. Animals received care in accordance with the Guidance Suggestions for the Care and Use of Laboratory Animals issued by the Ministry of Science and Technology of China. The protocol was approved by the Animal Care and Use Committee of Shenzhen Institutes of Advanced Technology, Chinese Academy of Sciences, Shenzhen, China. Mice were maintained under aseptic conditions in a small animal isolator, and then housed in standard cages (five mice per cage) with free access to food and water, as well as a 12 h light/dark cycle.
Brain tumour imaging
To establish the mouse model of brain tumours, six to eight-week-old female athymic nude mice were anesthetized with 1% pentobarbital sodium and placed on a stereotaxic apparatus. A burr hole was made 1.6 mm right of the bregma and 4.6 mm behind the coronal suture using an electric drill with a 1-mm drill bit. Subsequently, 1 × 10⁶ luciferase-expressing U87 glioma cells in 10 μL of PBS were injected 2.6 mm deep into the brain using a Hamilton syringe over 10 min (Hamilton, Reno, NV, USA). To perform bioluminescence and NIR-I fluorescence imaging in vivo, the orthotopic mouse model was anesthetized with 2% isoflurane in oxygen and placed in prone position. Bioluminescence images were acquired using an IVIS spectrum system (Caliper Life Sciences, Hopkinton, MA, USA). Afterwards, the mouse brain tumour model was administered IR-808 (100 μL, 100 μg/mL) via intravenous injection (three mice per group). NIR-Ia and NIR-Ib images were captured.
Lymphatic mapping
Athymic nude mice were administered IR-808 (10 µL, 100 µg/mL) via intradermal injection into the hind footpad (three mice each group). Images of lymphatic vasculature and sentinel lymph nodes were captured by NIR-Ia and NIR-Ib fluorescence imaging. Cross-sectional fluorescence intensity profiles were plotted and fluorescence signal blurring was quantified by determining the full width at half-maximum (FWHM).
Subcutaneous tumour imaging
To establish the mouse model of subcutaneous tumours, 5 × 10⁶ U87 glioblastoma cells were administered into the hind legs of athymic nude mice via subcutaneous injection. When tumour size reached 100 mm3, mice were administered IR-808 (100 μL, 100 μg/mL) via intravenous injection (three mice per group). NIR-Ia images were acquired with a 745 nm excitation laser and an 800-900 nm emission filter. NIR-Ib images were captured with an 808 nm excitation laser and a 900-1,000 nm bandpass filter. At 72 h post-injection, mice were sacrificed and their major organs including heart, liver, spleen, lung and kidneys were excised and imaged ex vivo by NIR-Ia or NIR-Ib fluorescence imaging.
Image-guided cancer surgery
Tumour-bearing mice were administered IR-808 (100 μL, 100 μg/mL) via intravenous injection. Animals were anesthetized and tumours were excised through the guidance of NIR-Ib fluorescence imaging under white light and 808 nm laser at 72 h post-injection. The surgical procedure for tumour resection was simultaneously recorded by InGaAs and mobile phone cameras.
Simulated capillary experiment for assessing the penetration depth in NIR-Ib and NIR-II fluorescence imaging
We performed a preliminary experiment to assess the fluorescence of two T-shaped capillary networks placed in water: one T-shaped capillary network contained IR-808 and the other contained the NIR-II dye IR-1061. NIR-Ib and NIR-II fluorescence imaging were performed with a 640 × 512 pixel two-dimensional InGaAs/SWIR VGA standard camera (Photonic Science, UK) equipped with a 900-1,000 nm bandpass filter for NIR-Ib imaging or a 1,000 nm longpass filter for NIR-II imaging). A NIR lens pair SWIR-35 (Navitar, Rochester, NY, USA) was used to focus the image onto the photodetector. The excitation light was provided by an 808-nm diode laser (laser glow technologies, Canada). The excitation power density at the imaging plane was 45 mW/cm2. At the water depth of 0 mm, the fluorescence intensity of the two T-shaped capillary networks was equal. At the water depth of 20 mm, we detected fluorescence signals from the capillary network containing IR-808 but not IR-1061. In fact, the capillary network containing IR-808 remained visible until the water depth reached 50 mm.
Cytotoxicity of IR-808
To observe the cytotoxicity of IR-808 in vitro, U87 cells or bEnd.3 (1 × 10⁴) were seeded into 96-well plates and incubated in 200 μL of culture medium overnight at 37 °C in a humidified atmosphere containing 5% CO2. The medium was replaced with fresh medium containing different concentrations of IR-808, including one without IR-808 as control. The cell viability was evaluated using standard CCK-8 assay at 24 h post-incubation.
The cytotoxicity of IR-808 on U87 cells were further verified by staining with calcein-AM and propidium iodide. U87 cells were seeded in 8-well chamber slides (5 × 10⁴ cells/well) and incubated overnight at 37 °C in a humidified atmosphere containing 5% CO2. After rinsing with PBS, the cells were incubated with different concentrations of IR-808 for another 12 h. Live cells were stained with calcein-AM, while dead cells were stained with propidium iodide according to the manufacturer's instructions (Invitrogen).
Hematoxylin and eosin staining
Hematoxylin and eosin staining were performed according to the manufacturer's instructions (BBC Biochemical). Briefly, major organs of mice treated with IR-808 (100 μL, 100 μg/mL) were excised at 72 h post-injection, embedded in OCT and flash frozen using liquid nitrogen. They were then cut into 8-μm tissue sections and fixed with methyl alcohol for 10 s at room temperature. After rinsing with water for 20 s to remove OCT, the tissue sections were stained with hematoxylin for 5 min, then rinsed with water for 20 s, then treated with 95% alcohol for 10 s, then stained with eosin for 25 s, then washed with PBS, then cleared with xylene, and then mounted onto slides with Canada balsam. Images were captured using a Nikon Eclipse 90i microscope.
Results
Optical and biochemical characterization
We began by characterizing the optical properties of IR-775, IR-780, IR-783, IR-797, IR-806 and IR-808 (hereafter collectively referred to as IR-X) in water (Figure 1A). UV/Vis spectra show that IR-X have prominent absorption features in the 600 nm to 850 nm regions and an absorption peak centred between 770 nm and 810 nm (Figure 1B, Figure S2, Figure S3 and Table S1). NIR fluorescence spectra show that IR-X have two emission peaks: one centred between 790 nm and 810 nm (Figure 1C), which is well documented in literature [41-43], and the other between 920 nm and 950 nm, which has largely been ignored (Figure 1D). The result suggests that IR-X dyes may be used to acquire NIR-Ia and NIR-Ib images simultaneously (i.e., dual-emission imaging studies). The NIR-Ib fluorescence quantum yield of IR-X dyes in aqueous solution or DMEM medium was determined, using IR-26 as a reference. Table S2 demonstrated that the quantum yield of IR-X dyes ranged from 5% to 6.5% in the NIR-Ib window. The fluorescence intensity of IR-X dyes was almost constant over 15 days, indicating the fluorescent stability of IR-X dyes in aqueous solutions (Figure S4). Figure S5A-B showed that the photostability of IR-808 dye (as a representative example) in NIR-Ia region and NIR-Ib region was good with 808 nm laser radiation up to 100 mW/cm2. The fluorescence properties of IR-X dyes in NIR-Ia region and NIR-Ib region did not photobleach under 808 nm laser irradiation with a power density of 50 mW/cm2 (Figure S5C-D).
Next, we studied the biochemical properties of IR-X. As a representative example, we performed fluorescence imaging on IR-808 in aqueous solution at different concentrations. Our results show that IR-808 has excellent solubility, as evident from the linear relationship between fluorescence intensity and concentration (Figure 1E-F). To evaluate the cytotoxicity of IR-808, we assessed the cell viability of U87 human glioma cells and bEnd.3 cells treated with different concentrations of IR-808 at 24 h post-incubation. CCK-8 assay results show that cell viability was greater than 93% for all concentrations up to 32 µM (Figure S6A and Figure S7). Confocal microscopy images show that very few U87 cells underwent cell death even when the IR-808 concentration was increased to 6 µM (Figure S6B). To investigate systemic toxicity, we examined major organs including heart, liver, spleen, lungs and kidneys excised from mice at 72 h post-injection. Histological examination did not reveal any significant damage, site of inflammation or differences between control and treated mice (Figure S6C). The blood circulation time of IR-808 after intravenous injection and half-life period of IR-808 was about 8 min, indicating IR-808 was easily metabolized in the body (Figure S8). Taken together, these preliminary results suggest that IR-X have low cytotoxicity, low systemic toxicity and excellent histocompatibility.
Figure 1
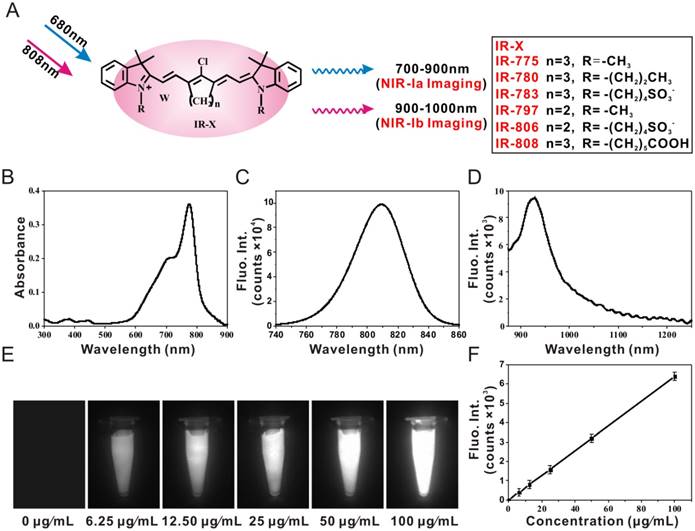
Chemical structure of IR-X and optical properties of IR-808. (A) Chemical structure of IR-X and schematic of NIR-Ia and NIR-Ib fluorescence imaging. (B) UV/Vis absorption spectra, (C) NIR-Ia emission spectra (λex = 680 nm) and (D) NIR-Ib emission spectra (λex = 808 nm) of IR-808 in water. (E) NIR-Ib images and (F) fluorescence intensity of IR-808 at different concentrations (λex = 808 nm).
Lymphatic mapping, tumour imaging and image-guided cancer surgery
We wanted to see if IR-X can be used for biomedical imaging and, more importantly, if there are differences in performance between NIR-Ia and NIR-Ib fluorescence imaging. To get answers, we performed lymphatic mapping, brain tumour imaging, subcutaneous tumour imaging and image-guided cancer surgery in mice following the administration of IR-808. For lymphatic mapping, NIR-Ia and NIR-Ib images of mouse hind limb were captured in vivo at 60 s post-injection (Figure 2A). Both revealed lymphatic vessels diverging from the injection site and coalescing into sentinel lymph nodes. The result was unexpected as NIR-Ib light is known to be strongly absorbed by water and biological tissues. More surprisingly, cross-sectional intensity profiles show that NIR-Ib images had better spatial resolution, as their full width at half maximum was only half that of NIR-Ia images (Figure 2B). NIR-Ib images also offered better contrast, as their SBR was approximately five times higher than that of NIR-Ia images (Figure 2C).
For brain tumour imaging, athymic nude mice with luciferase-expressing U87 cells injected into their brain were used as the animal model. We first confirmed the tumour location by bioluminescence imaging (Figure 2D), and then captured NIR-Ia and NIR-Ib images in vivo at different time points post-injection. At 12 h and 24 h, the brain tumour was clearly visible in NIR-Ib but not in NIR-Ia images (Figure 2E). The tumour-to-normal ratio (TNR) of NIR-Ib images increased with time and peaked at 24 h (Figure 2F). In comparison, the TNR of NIR-Ia images remained largely unchanged at unity. Taken together, the results suggest that NIR-Ib fluorescence imaging enables not only deep-tissue visualization but also through-skull imaging.
Figure 2
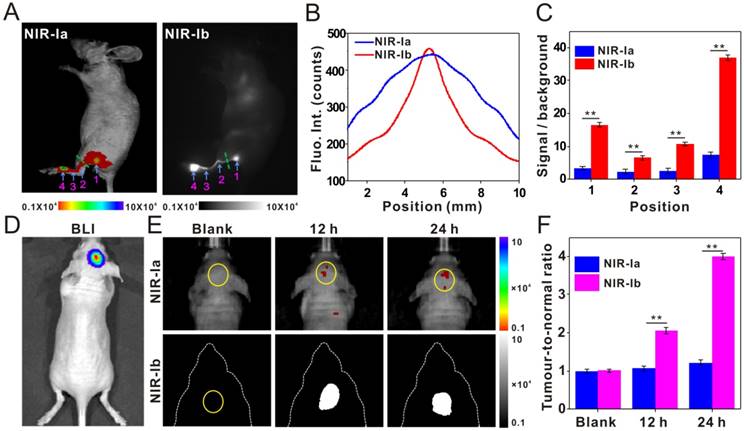
Brain tumour imaging and lymphatic mapping using IR-808. (A) NIR-Ia and NIR-Ib images of mouse hind leg captured at 60 s post-injection. Arrows 1-3 point to sentinel lymph nodes, while arrow 4 points to the injection site. The excitation wavelength was 680 nm for NIR-Ia imaging and was 808 nm for NIR-Ib imaging. A bandpass filter ranged from 700 nm to 900 nm for NIR-Ia imaging and from 900-1,000 nm for NIR-Ib imaging. A fixed exposure time of 1 s was used for NIR-Ia imaging and 200 ms for NIR-Ib imaging. The power density of excitation at the imaging plane was 45 mW/cm2. (B) Cross-sectional fluorescence intensity profiles along the green dashed line as shown in (A). (C) SBR of sentinel lymph nodes and the injection site as shown in (A). (D) Bioluminescence image of the tumour-bearing mouse and (E) NIR-Ia and NIR-Ib images of brain tumours (circled in yellow) at different time points post-injection. (F) TNR of fluorescence images at different time points post-injection.
For subcutaneous tumour imaging, athymic nude mice bearing subcutaneous xenografts of U87 cells were used as the animal model. NIR-Ia and NIR-Ib images of the mouse body were captured in vivo at different time points post-injection. We noted that, although the intensity of NIR-Ia and NIR-Ib images peaked at 6 h (Figure S9A), their TNR increased with time up to 72 h. The high TNR was due to both intrinsic tumour-targeting properties and rapid metabolism of IR-808 in normal tissues, as evident from the lack of fluorescence in major organs compared to tumours ex vivo (Figure S9B). We also noted that TNR of NIR-Ib images were 7.15 ± 0.17, which was generally 2-3 times that of NIR-Ia images. This result was somewhat expected as autofluorescence and scattering are known to be weaker at longer wavelengths. Taken together, the findings suggest that NIR-Ib fluorescence imaging offers not only high tumour detection accuracy but also better image fidelity.
For image-guided cancer surgery, athymic nude mice bearing subcutaneous xenografts of U87 cells were again used as the animal model. We performed tumour resection under white light at 72 h post-injection with the aid of NIR-Ib fluorescence imaging (Figure S9C). Time-lapse white-light and NIR-Ib images show how easy it was to remove the subcutaneous tumours (Figure S9D and Video S1). The surgical procedure took 60 s on average to complete. No residual fluorescence was detected in the mouse body after tumour resection. Furthermore, histological processing of the tumor bed, which had no residual NIR-Ib fluorescence-positive foci, revealed no residual tumor cells (Figure S10). We also observed that the emission of IR-808 dyes in the NIR-Ib window had negligible thermal effect on the tissue under 808 nm excitation with 45 mW/cm2 (Figure S11). These results also confirmed the tumour-targeting properties and safety of IR-808.
Leaf vein imaging and plant diseases detection
We were interested to see if IR-X has other novel applications and, more importantly, if NIR-Ib light can be used to image water-rich samples. Inspired by our indoor plant displays, we performed leaf vein imaging on E. aureum grown in water containing IR-808 (50 µg/mL), which was transported from stem vein to leaf vein under plant transpiration. NIR-Ia and NIR-Ib images of whole leaves were captured at different time points post-administration (Figure 3A). At 0 h, the leaf and its venation were visible in NIR-Ia images due to chlorophyll autofluorescence, which peaked at 740 nm, but not in NIR-Ib images as autofluorescence was negligible at longer wavelengths. At 12 h, the petiole, the midrib and secondary veins close to the leaf base became apparent in NIR-Ib images because IR-808 had presumably migrated to these sites, but not in NIR-Ia images as signals were largely masked by chlorophyll autofluorescence. At 48 h, almost the entire leaf, including the apex and tertiary veins, was illuminated in NIR-Ib images, but again not in NIR-Ia images. We noted that not all parts of the leaf were illuminated because water was unevenly distributed inside the leaf. The cause of this uneven distribution is not clear and warrants further investigation. Furthermore, Khaya senegalensis A. Juss with early anthracnose leaf infections were treated with water containing IR-808 (50 µg/mL), and NIR-Ia and NIR-Ib images of leaves were captured at 12 h post-administration. The early anthracnose infection locations in the leaves were illuminated in NIR-Ib images due to IR-808 that had transported to these sites by vessels, but not in NIR-Ia images as most of the signals were masked by chlorophyll autofluorescence (Figure 3B). Anthracnose hazards in Khaya senegalensis are very large and early detection of anthrax greatly increases plant survival rate. Therefore, these results demonstrated that NIR-Ib fluorescence imaging offered not only better leaf vein imaging but also high accuracy early disease detection.
Figure 3
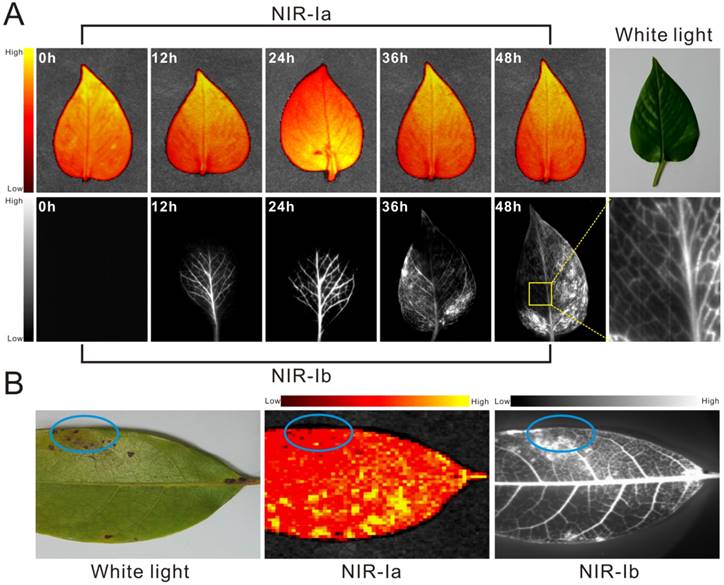
Leaf vein imaging and plant anthracnose infection detection using IR-808. (A) NIR-Ia and NIR-Ib images of whole leaves picked from E. aureum at different time points post dye administration. (B) NIR-Ia and NIR-Ib imaging detected anthracnose of Khaya senegalensis A. Juss (circled in blue). The excitation wavelength was 680 nm for NIR-Ia imaging and was 808 nm for NIR-Ib imaging. A bandpass filter of 700 nm to 900 nm was used for NIR-Ia imaging and from 900-1,000 nm for NIR-Ib imaging. A fixed exposure time of 1 s was used for NIR-Ia imaging and 200 ms for NIR-Ib imaging. The power density of excitation at the imaging plane was 45 mW/cm2.
Autofluorescence, scattering and light absorption by biological tissues and water
To find out why NIR-Ib fluorescence imaging had better performance, we evaluated the impact of autofluorescence on NIR-Ia and NIR-Ib signals by performing spectral analysis on a simulated leaf. Briefly, a 4 × 4 mm cuvette was placed inside a 10 × 10 mm cuvette to mimic leaf veins and lamina of E. aureum, respectively. NIR-Ia and NIR-Ib spectra were recorded under three scenarios. For the 'dye-only' scenario, the inner cuvette was filled with 50 µg/mL IR-808 solution. For the 'leaf-only' scenario, the outer cuvette was filled with 5% leaf homogenate. For the 'dye-and-leaf' scenario, the inner and outer cuvette were filled with 50 µg/mL IR-808 solution and 5% leaf homogenate, respectively. Figure 4A-F show NIR-Ia and NIR-Ib spectra for the different scenarios. Note that Figure 4A-D are pure-component spectra, whereas Figure 4E-F are mixed-component spectra. By numerical fitting, we could decompose or 'unmix' Figure 4E and Figure 4F into two peaks, one arising from dye fluorescence and the other arising from autofluorescence (see Figure 4G-H). Then, by dividing the area of the autofluorescence peak by that of the mixed-component spectra, we could determine the auto-to-total fluorescence ratio (ATR). For NIR-Ia and NIR-Ib spectra, the ATR was calculated to be 72.22% and 2.87%, respectively (Table S3). Based on these results, we speculated that reduced autofluorescence might be one of the reasons for improved signals in NIR-Ib fluorescence imaging.
Figure 4
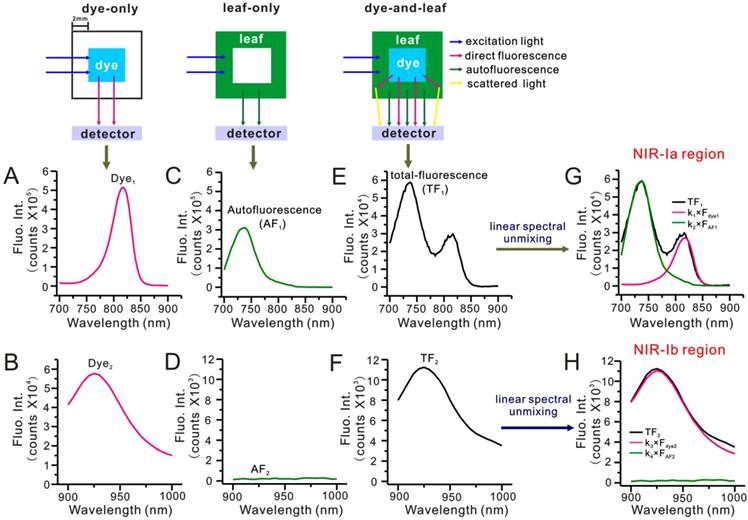
Simulated leaf experiment for evaluating the impact of autofluorescence on NIR fluorescence imaging. (A) NIR-Ia and (B) NIR-Ib fluorescence spectra of 50 µg/mL IR-808 solution. (C) NIR-Ia and (F) NIR-Ib autofluorescence spectra of 5% leaf homogenate. (E) NIR-Ia and (F) NIR-Ib fluorescence spectra of the simulated leaf prior to linear spectral unmixing. (G) NIR-Ia and (H) NIR-Ib fluorescence spectra of the simulated leaf after linear spectral unmixing. Dye fluorescence and autofluorescence components are highlighted in pink and green, respectively. Excitation and emission slits were set to 5 nm. The power density of excitation was 300 W. The excitation wavelength was 680 nm for NIR-Ia imaging and was 808 nm for NIR-Ib imaging. Fluorescence emission ranged from 700 nm to 900 nm for NIR-Ia imaging and from 900 nm to 1,000 nm for NIR-Ib imaging.
To confirm our hypothesis, we repeated the analysis in a simulated muscle wherein 5% leaf homogenate was replaced with 5% mouse tissue homogenate. For NIR-Ia and NIR-Ib spectra, the ATR was calculated to be 28.68% and 4.29%, respectively (Figure S12). These results, which are consistent with experimental observations, lend further support to our reduced autofluorescence hypothesis.
Besides autofluorescence, the scattering of dye fluorescence by chlorophyll and biological tissues is also known to be a source of interference. To understand its effects, we modified the simulated leaf setup by placing a screen in between cuvettes and the detector. The screen helped block out the direct component of dye fluorescence, allowing the scattering component to be detected. Figure 5A-D show unscreened and screened mixed-component spectra, and Figure 5E-H show the same spectra after autofluorescence subtraction. Note that Figure 5E and Figure 5G are dye fluorescence peaks (arising from the sum of direct fluorescence and scattering), whereas Figure 5F and Figure 5H scattering peaks. By dividing the area of scattering peak by that of dye fluorescence peak, we could determine the scattering-to-dye fluorescence ratio (SDR). For NIR-Ia and NIR-Ib spectra, the SDR was calculated to be 25% and 10%, respectively. Again, we repeated this analysis in the simulated muscle (see Figure S13). For NIR-Ia and NIR-Ib spectra, the SDR was calculated to be 22% and 10%, respectively. The results suggest that scattering was also reduced in the NIR-Ib window, hence the improved signals in NIR-Ib fluorescence imaging.
Figure 5
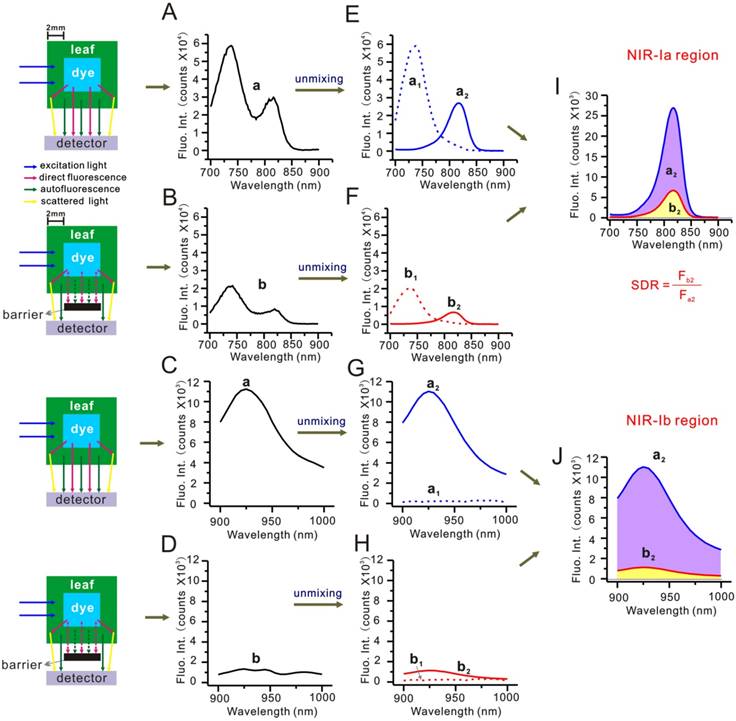
Simulated leaf experiment for evaluating the impact of scattering. (A) Unscreened and (B) screened NIR-Ia fluorescence spectra of the simulated leaf. (C) Unscreened and (D) screened NIR-Ib fluorescence spectra of the simulated leaf. (E) Unscreened and (F) screened NIR-Ia fluorescence spectra after autofluorescence subtraction. (G) Unscreened and (H) screened NIR-Ib fluorescence spectra after autofluorescence subtraction. (I) Schematic diagram for calculating SDR of NIR-Ia and (J) NIR-Ib fluorescence imaging.
To further investigate the effects of light absorption by biological tissues and water, we conducted a depth penetration experiment wherein a capillary tube containing 50 µg/mL IR-808 solution was free to move along the optical axis inside a 10 × 10 mm cuvette filled with 5% leaf homogenate. Figure 6A-B show NIR-Ia and NIR-Ib spectra of the capillary tube at varying depths inside the cuvette. We noted that, in both spectra, dye fluorescence decreased as depth increased, and that, due to the unchanging nature of autofluorescence, dye fluorescence became increasingly dominated in NIR-Ia spectra (the ATR at 1 mm, 3 mm and 5 mm depth was calculated to be 52%, 71% and 94%, respectively). In contrast, due to the near absence of autofluorescence, dye fluorescence remained dominant at all depths in NIR-Ib spectra (the ATR at 1 mm, 3 mm and 5 mm depth was calculated to be 1%, 2% and 6% only). For comparison, we repeated the same experiment by replacing 5% leaf homogenate first with 5% mouse tissue homogenate (Figure S14), and then with water (Table S4). We found that ATR of NIR-Ia spectra was consistently greater than that of NIR-Ib spectra, and that their difference was greatest for leaf homogenate. The absorption spectra of 5% leaf tissues (muscle tissues) in the NIR-Ia and NIR-Ib windows were measured, and light absorption by biological tissues in the NIR-Ib window were much less than those in the NIR-Ia window (Figure S15). We also used a highly scattering medium (Intralipid, 1 wt% aqueous solution) to mock human skin tissue. Without the intralipid solution, NIR-Ia and NIR-Ib imaging have similar absorbing and scattering properties (Figure S16). With increasing thickness of intralipid solution, the image clarity gradually decreased, due to the enhanced scattering at higher concentration of intralipid. The NIR-Ia images became blurred with broadened feature width, whereas the NIR-Ib images maintained higher image fidelity and integrity under intralipid solution up to 5 mm thick. These results help to explain why NIR-Ib fluorescence imaging has greater penetration depth than NIR-Ia fluorescence imaging, and why NIR-Ib light is particularly suited for leaf vein imaging.
Figure 6
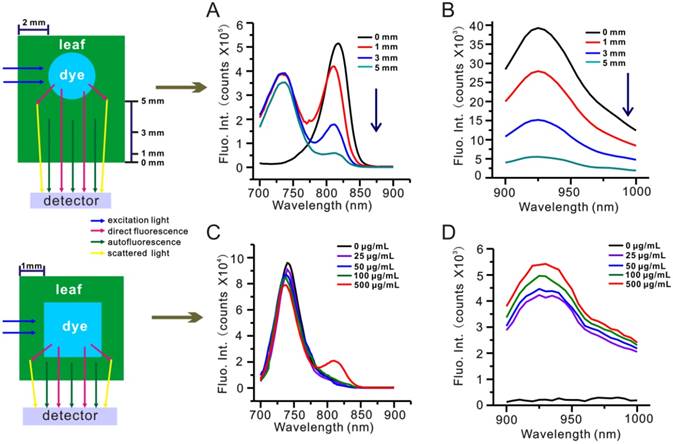
Depth penetration experiment for evaluating the impact of light absorption by biological tissues. (A) NIR-Ia and (B) NIR-Ib fluorescence spectra of the dye-filled capillary tube at varying depths inside a leaf homogenate-filled cuvette. (C) NIR-Ia and (D) NIR-Ib fluorescence spectra of a 4 × 4 mm cuvette filled with various concentrations of IR-808 solution inside a leaf-wrapped cuvette.
To better understand the impact of dye concentration, we conducted another depth penetration experiment wherein a 1 mm-thick E. aureum leaf was used to wrap a 4 × 4 mm cuvette containing IR-808 solution. Figure 6C-D show NIR-Ia and NIR-Ib spectra of IR-808 solution at varying concentrations inside the leaf-wrapped cuvette. We found that NIR-Ia signals were detectable in 500 µg/mL IR-808 solution only. In contrast, NIR-Ib signals were detectable across all samples, even when IR-808 concentration was down to 25 µg/mL.
Discussion
NIR fluorescence dyes have attracted great interest in recent years because of their potential applications in biomedical imaging and cancer therapy. As such, we have been studying heptamethine dyes, a subclass of cyanine dyes with strong NIR-Ia fluorescence, high photothermal conversion efficiency and tumour-targeting properties. Originally, our research was directed towards characterizing heptamethine dyes and assessing their suitability for image-guided cancer surgery. However, during the course of our study, we identified certain heptamethine dyes with distinct emission peaks not only in the NIR-Ia window but also in the NIR-Ib window. Moreover, we discovered by serendipity that NIR-Ib fluorescence could be used to yield images of sentinel lymph nodes, brain tumours, subcutaneous tumours and leaf veins. The results were contrary to our expectation as animal tissues and plant leaves contain much water, of which vibrational overtone peak is thought to strongly attenuate NIR-Ib fluorescence.
To understand how NIR-Ib fluorescence imaging works, we devised simulated leaf and depth penetration experiments to study the impact of autofluorescence, scattering and light absorption by water on NIR-Ia and NIR-Ib signals. By performing spectral unmixing analysis, we showed that autofluorescence and scattering were both reduced in the NIR-Ib window, hence the improved signals in NIR-Ib fluorescence imaging. We found that contrary to widespread impressions, the impact of light absorption by water on NIR-Ib signals was small, even when the penetration depth exceeded 5 mm. This is because autofluorescence was reduced to negligible levels in the NIR-Ib window. Therefore, despite light absorption by water, NIR-Ib signals remained dominant up to a threshold depending on the type of medium.
To better understand why NIR-Ib images are clearer and shaper than NIR-Ia images, let's consider how SBR is affected by autofluorescence in different NIR regions. First, we note that SBR = (DF + AF) / (SC + AF), where DF, AF and SC are contributions from direct fluorescence, autofluorescence and scattering. In NIR-Ia region where AF >> DF >> SC, SBR ≈ AF/AF = 1. In NIR-Ib region where DF >> AF and DF >> SC, SBR ≈ DF/SC >> 1. Indeed, when we re-analysed the NIR-Ia and NIR-Ib images of leaf veins in Figure 3A, the SBR was measured to be 1.00 and 5.70 (Table S5), respectively—only the latter exceeded the Rose criterion. In other words, the SBR of NIR-Ib images will always be greater than that of NIR-Ia images because of reduced autofluorescence and scattering. Now, the commonly used NIR-Ia dyes, such as ICG, IR-783 and IR-806, are all excitated by NIR light (mostly around 800 nm). Although the excitation wavelength at the NIR light can cause lower autofluorescence, scattering and higher penetration depth in biological tissues than that of visible light, the biological tissues absorption and tissue autofluorescence and reduced photon scattering of NIR-Ia windows always higher than that of NIR-Ib windows [44]. Thus, whatever wavelength is used for excitation, the SRB of NIR-Ib images are higher that of NIR-Ia images.
An interesting question that arises from our findings is whether NIR-Ib fluorescence imaging has any advantage over NIR-II fluorescence imaging, given that the latter operates in even longer wavelengths [44]. To answer this question, we performed a preliminary experiment to assess the fluorescence of two T-shaped capillary networks placed in water, one containing IR-808 and the other containing the NIR-II dye IR-1061 (Figure S17A). At the water depth of 20 mm, we detected fluorescence signals from the capillary network containing IR-808 but not IR-1061 (Figure S17B). In fact, the capillary network containing IR-808 remained visible until the water depth reached 50 mm (Figure S17C). The result suggests that light absorption by water has a greater impact on NIR-II fluorescence imaging than on NIR-Ib fluorescence imaging. In other words, contrary to widespread impressions, NIR-Ib light is actually ideal for imaging biological samples that are rich in water.
Currently, the scientific community posits that there are two 'biologically transparent windows' in the NIR region where light absorption by water is low: one called NIR-I (700-900 nm) and the other called NIR-II (1,000-1,700 nm) window [45]. Some have gone even further and segregated the NIR-II window into smaller sub-windows for acquiring fluorescence images [46]. In any case, most have been avoiding the 900-1,000 nm window due to the presence of a water overtone absorbance peak. Indeed, a search in the literature reveals that the absorbance spectrum of water does have local maxima at 970 nm, 1,200 nm, 1,450 nm and beyond 1,800 nm [44]. However, the absorbance at 970 nm, despite being a local maximum, is still much lower than that of the entire NIR-II region. Together with the findings from our work, we show that NIR-Ib fluorescence imaging is not only possible but may offer unique advantages not found in NIR-Ia or NIR-II fluorescence imaging.
Lastly, leaf vein structures have implications not only for plant phenotyping but also for monitoring plant responses to environmental changes. Our work demonstrates that NIR-Ib fluorescence imaging is a powerful method for studying leaf vein structures non-invasively, at high resolution and in vivo—even when the leaves being studied are thick and high in water content as in the case of E. aureum. NIR-Ib fluorescence imaging could even be used to image the internal systems of marine plants and live fish, which would have been impossible with conventional technologies because of the high chlorophyll and water content in both sample and the environment. However, the demonstration of these features is already outside the scope of this work.
Conclusion
In summary, we have found a family of heptamethine dyes that have emission peaks in both the NIR-Ia and NIR-Ib windows. We have applied them in dual-emission imaging studies of mice and plants and demonstrated the superiority of NIR-Ib fluorescence imaging in the characterization of sentinel lymph nodes, brain tumours, subcutaneous tumours, leaf veins and early anthracnose infection locations in plant leaves. Through simulated experiments and linear spectral unmixing analyses, we have shown that the SBR of NIR-Ib images are higher than that of NIR-Ia images because autofluorescence and scattering are diminished at longer wavelengths. Depending on the type of medium, NIR-Ib fluorescence imaging can achieve penetration depths of up to 50 mm. Given that heptamethine dyes exhibit excellent solubility in water, low cytotoxicity and tumour-targeting properties, we believe that our technology will find vast applications in scientific research and clinical settings.
Abbreviations
AF: atuofluorescence; ATR: atuo-to-total fluorescence ratio; DF: direct fluorescence; InGaAs: indium-gallium-arsenide; NIR: Near-infrared; TNR: tumour to normal ratio; SBR: signal-to-background ratio; SC: scattering light; SDR: scattering-to-dye fluorescence ratio.
Supplementary Material
Supplementary figures and tables.
Supplementary video 1.
Acknowledgements
This work was supported by Key International S&T Cooperation Project (2015DFH50230), the National Natural Science Foundation of China (31571013, 81671758, 51502333, and 81501580), Guangdong Natural Science Foundation of Research Team (2016A030312006), Shenzhen Science and Technology Program (JSGG20160331185422390, JCYJ20160429191503002, JCYJ20170818162522440 and JCYJ20170818154843625).
Competing Interests
The authors have declared that no competing interest exists.
References
1. Ashitate Y, Tanaka E, Stockdale A. et al. Near-infrared fluorescence imaging of thoracic duct anatomy and function in open surgery and video-assisted thoracic surgery. J Thorac Cardiov Sur. 2011;142:31-8
2. Marshall MV, Rasmussen JC, Tan I. et al. Near-infrared fluorescence imaging in humans with indocyanine green: a review and update. Open Surg Oncol J. 2010;2:12-25
3. Kosaka N, Ogawa M, Choyke PL. et al. Clinical implications of near-infrared fluorescence imaging in cancer. Future Oncol. 2009;5:1501-11
4. Mieog JS, Hutteman M, Van JR. et al. Image-guided tumor resection using real-time near-infrared fluorescence in a syngeneic rat model of primary breast cancer. Breast Cancer Res Treat. 2011;128:679-89
5. Ntziachristos V, Ripoll J, Wang LV. et al. Looking and listening to light: the evolution of whole-body photonic imaging. Nat Biotechnol. 2005;23:313-20
6. Choi HS, Gibbs SL, Lee JH. et al. Targeted zwitterionic near-infrared fluorophores for improved optical imaging. Nat Biotechnol. 2013;31:148-53
7. Frangioni JV. In vivo near-infrared fluorescence imaging. Curr Opin Chem Biol. 2003;7:626-34
8. He X, Gao J, Gambhir SS, Cheng Z. Near-infrared fluorescent nanoprobes for cancer molecular imaging: status and challenges. Trends Mol Med. 2010;16:574-83
9. Miller MA, Weissleder R. Imaging of anticancer drug action in single cells. Nat Rev Cancer. 2017;17:399-414
10. Cai W, Chen K, Li ZB. et al. Dual-function probe for PET and near-infrared fluorescence imaging of tumor vasculature. J Nucl Med. 2007;48:1862-70
11. Giepmans BN, Adams SR, Ellisman MH. et al. The fluorescent toolbox for assessing protein location and function. Science. 2006;312:217-24
12. Chu L, Wang S, Li K. et al. Biocompatible near-infrared fluorescent nanoparticles for macro and microscopic in vivo functional bioimaging. Biomed Opt Express. 2014;5:4076-88
13. Schaafsma BE, Mieog JS, Hutteman M. et al. The clinical use of indocyanine green as a near-infrared fluorescent contrast agent for image-guided oncologic surgery. J Surg Oncol. 2011;104:323-32
14. Owens EA, Lee S, Choi J. et al. NIR fluorescent small molecules for intraoperative imaging. Wiley Interdiscip Rev Nanomed Nanobiotechnol. 2015;7:828-38
15. Chance B. Near-infrared images using continuous, phase-modulated, and pulsed light with quantitation of blood and blood oxygenation. Ann N Y Acad Sci. 1998;838:29-45
16. Shimizu Y, Temma T, Hara I. et al. Development of novel nanocarrier-based near-infrared optical probes for in vivo tumor imaging. J Fluoresc. 2012;22:719-27
17. H. Hyun, Henary M, Gao T, et al. 700-nm zwitterionic near-infrared fluorophores for dual-channel image-guided surgery. Mol Imaging Biol. 2016;18:52-61
18. Quek CH, Leong KW. Near-infrared fluorescent nanoprobes for in vivo optical imaging. Nanomaterials. 2012;2:92-112
19. He X, Wang K, Cheng Z. In vivo near-infrared fluorescence imaging of cancer with nanoparticle-based probes. Wiley Interdiscip Rev Nanomed Nanobiotechnol. 2010;2:349-66
20. Welsher K, Liu Z, Sherlock SP. et al. A route to brightly fluorescent carbon nanotubes for near-infrared imaging in mice. Nat Nanotechnol. 2009;4:773-80
21. Jeong S, Song J, Lee W. et al. Cancer-microenvironment-sensitive activatable quantum dot probe in the second near-infrared window. Nano Lett. 2017;17:1378-86
22. Yang Q, Ma Z, Wang H. et al. Rational design of molecular fluorophores for biological imaging in the NIR-II window. Adv Mater. 2017;29:1605497
23. Smith AM, Mancini MC, Nie S. Bioimaging: second window for in vivo imaging. Nat Nanotechnol. 2009;4:710-11
24. Li B, Lu L, Zhao M. et al. An efficient 1064 nm NIR-II excitation fluorescent molecular dye for deep-tissue high-resolution dynamic bioimaging. Angew Chem Int Ed Engl. 2018;57:1-6
25. Wang R, Li X, Zhou L. et al. Epitaxial seeded growth of rare-earth nanocrystals with efficient 800 nm near-infrared to 1525 nm short-wavelength infrared downconversion photoluminescence for in vivo bioimaging. Angew Chem Int Ed Engl. 2014;53:12086-90
26. Du Y, Xu B, Fu T, Cai M. et al. Near-infrared photoluminescent Ag2S quantum dots from a single source precursor. J Am Chem Soc. 2010;132:1470-71
27. Zhang Y, Hong G, Zhang Y. et al. Ag2S quantum dot: a bright and biocompatible fluorescent nanoprobe in the second near-infrared window. ACS Nano. 2012;6:3695-3702
28. Hong G, Robinson JT, Zhang Y. et al. In vivo fluorescence imaging with Ag2S quantum dots in the second near-infrared region. Angew Chem Int Ed Engl. 2012;51:9818-21
29. Li C, Zhang Y, Wang M. et al. In vivo real-time visualization of tissue blood flow and angiogenesis using Ag2S quantum dots in the NIR-II window. Biomaterials. 2014;35:393-400
30. Sun Y, Zeng X, Xiao Y. et al. Novel dual-function near-infrared II fluorescence and PET probe for tumor delineation and image-guided surgery. Chem Sci. 2018;9:2092-97
31. Sun Y, Ding M, Zeng X. et al. Novel bright-emission small-molecule NIR-II fluorophores for in vivo tumor imaging and image-guided surgery. Chem Sci. 2017;8:3489-93
32. Antaris AL, Chen H, Diao S. et al. A high quantum yield molecule-protein complex fluorophore for near-infrared II imaging. Nat Commun. 2017;8:15269
33. Ding F, Zhang YB, Lu XJ. et al. Recent advances of near-Infrared II fluorophores for multifunctional biomedical imaging. Chem Sci. 2018;9:4370-80
34. Yang Q, Hu Z, Zhu S. et al. Donor engineering for NIR-II molecular fluorophores with enhanced fluorescent performance. J Am Chem Soc. 2018;140:1715-24
35. Antaris AL, Chen H, Cheng K. et al. A small-molecule dye for NIR-II imaging. Nat Mater. 2016;15:235-42
36. Hong G, Zou Y, Antaris AL. et al. Ultrafast fluorescence imaging in vivo with conjugated polymer fluorophores in the second near-infrared window. Nat Commun. 2014;5:4206
37. Wozniak B, Dera J. Light absorption in sea water. New Yok: Springer. 2007
38. Lei Z, Li X, Luo X. et al. Bright, stable, and biocompatible organic fluorophores absorbing/ emitting in the deep near-Infrared spectral region. Angew Chem Int Ed Engl. 2017;56:2979-83
39. Fried WA, Fried D, Chan KH. et al. Imaging early demineralization on tooth occlusal surfaces with a high definition InGaAs camera. Proc SPIE Int Soc Opt Eng. 2013;8566:85660I
40. Dickinson ME, Bearman G, Tille S. et al. Multi-spectral imaging and linear unmixing add a whole new dimension to laser scanning fluorescence microscopy. Biotechniques. 2001;31:1274-76
41. Harrison VR, Carney CE, Macrenaris KW. et al. Multimeric near IR-MR contrast agent for multimodal in vivo imaging. J Am Chem Soc. 2015;137:9108-16
42. Xiao L, Zhang Y, Yue W. et al. Heptamethine cyanine based (64)Cu-PET probe PC-1001 for cancer imaging: synthesis and in vivo evaluation. Nucl Med Biol. 2013;40:351-60
43. Yue C, Liu P, Zheng M. et al. IR-780 dye loaded tumor targeting theranostic nanoparticles for NIR imaging and photothermal therapy. Biomaterials. 2013;34:6853-61
44. Hong G, Antaris AL, Dai H. Near-infrared fluorophores for biomedical imaging. Nat Biomed Eng. 2017;1:0010
45. Hong G, Lee JC, Robinson JT. et al. Multifunctional in vivo vascular imaging using near-infrared II fluorescence. Nat Med. 2012;18:1841-46
46. Hong G, Diao S, Chang J. et al. Through-skull fluorescence imaging of the brain in a new near-infrared window. Nat Photon. 2014;8:723-30
Author contact
![]() Corresponding author: Ping Gong (email: ping.gongac.cn) and Lintao Cai (email: lt.caiac.cn).
Corresponding author: Ping Gong (email: ping.gongac.cn) and Lintao Cai (email: lt.caiac.cn).
Citation styles
APA
Deng, G., Li, S., Sun, Z., Li, W., Zhou, L., Zhang, J., Gong, P., Cai, L. (2018). Near-infrared fluorescence imaging in the largely unexplored window of 900-1,000 nm. Theranostics, 8(15), 4116-4128. https://doi.org/10.7150/thno.26539.
ACS
Deng, G.; Li, S.; Sun, Z.; Li, W.; Zhou, L.; Zhang, J.; Gong, P.; Cai, L. Near-infrared fluorescence imaging in the largely unexplored window of 900-1,000 nm. Theranostics 2018, 8 (15), 4116-4128. DOI: 10.7150/thno.26539.
NLM
Deng G, Li S, Sun Z, Li W, Zhou L, Zhang J, Gong P, Cai L. Near-infrared fluorescence imaging in the largely unexplored window of 900-1,000 nm. Theranostics 2018; 8(15):4116-4128. doi:10.7150/thno.26539. https://www.thno.org/v08p4116.htm
CSE
Deng G, Li S, Sun Z, Li W, Zhou L, Zhang J, Gong P, Cai L. 2018. Near-infrared fluorescence imaging in the largely unexplored window of 900-1,000 nm. Theranostics. 8(15):4116-4128.
This is an open access article distributed under the terms of the Creative Commons Attribution (CC BY-NC) license (https://creativecommons.org/licenses/by-nc/4.0/). See http://ivyspring.com/terms for full terms and conditions.