Theranostics
13.3
Impact Factor
- Issue 9; 2026
- Issue 8; 2026
- Issue 7; 2026
- Issue 6; 2026
- Issue 5; 2026
- Volume 16; 2026
- Advance Articles
- Past Issues
- Cover Images
- Cover Suggestion
- Special Issues
Top
Introduction
Methods
Results
Discussion
Conclusions
Abbreviations
Supplementary Material
Acknowledgements
References
Introduction
Methods
Results
Discussion
Conclusions
Abbreviations
Supplementary Material
Acknowledgements
References
International Journal of Biological Sciences
International Journal of Medical Sciences
 Global reach, higher impact

Theranostics 2018; 8(10):2782-2798. doi:10.7150/thno.23050 This issue Cite
Research Paper
Plectin-targeted liposomes enhance the therapeutic efficacy of a PARP inhibitor in the treatment of ovarian cancer
Siva Sai Krishna Dasa1,2 ![]() , Galina Diakova2,3, Ryo Suzuki3†, Anne M. Mills4, Michael F. Gutknecht1,2, Alexander L. Klibanov1,3, Jill K. Slack-Davis5, Kimberly A. Kelly1,2
, Galina Diakova2,3, Ryo Suzuki3†, Anne M. Mills4, Michael F. Gutknecht1,2, Alexander L. Klibanov1,3, Jill K. Slack-Davis5, Kimberly A. Kelly1,2
1. Department of Biomedical Engineering, University of Virginia, Charlottesville, VA, USA.
2. Cancer center, University of Virginia, Charlottesville, VA, USA.
3. Division of Cardiovascular Medicine, University of Virginia, Charlottesville, VA, USA.
4. Department of Pathology, University of Virginia, Charlottesville, VA, USA.
5. Department of Microbiology, University of Virginia, Charlottesville, VA, USA.
† Laboratory of Drug and Gene Delivery System, Faculty of Pharma-Sciences, Teikyo University, Tokyo, Japan. (Current address)
Received 2017-9-27; Accepted 2018-3-1; Published 2018-4-11
Citation:
Dasa SSK, Diakova G, Suzuki R, Mills AM, Gutknecht MF, Klibanov AL, Slack-Davis JK, Kelly KA. Plectin-targeted liposomes enhance the therapeutic efficacy of a PARP inhibitor in the treatment of ovarian cancer. Theranostics 2018; 8(10):2782-2798. doi:10.7150/thno.23050. https://www.thno.org/v08p2782.htm
Other stylesAbstract

Advances in genomics and proteomics drive precision medicine by providing actionable genetic alterations and molecularly targeted therapies, respectively. While genomic analysis and medicinal chemistry have advanced patient stratification with treatments tailored to the genetic profile of a patient's tumor, proteomic targeting has the potential to enhance the therapeutic index of drugs like poly(ADP-ribose) polymerase (PARP) inhibitors. PARP inhibitors in breast and ovarian cancer patients with BRCA1/2 mutations have shown promise. About 10% of the patients who received Olaparib (PARP inhibitor) showed adverse side effects including neutropenia, thrombocytopenia and in some cases resulted in myelodysplastic syndrome, indicating that off-target effects were substantial in these patients. Through proteomic analysis, our lab previously identified plectin, a cytolinker protein that mislocalized onto the cell surface during malignant transformation of healthy ovarian tissue. This cancer specific phenotype allowed us to image pancreatic cancer successfully using plectin targeted peptide (PTP) conjugated to nanoparticles or displayed on capsid protein of adeno-associated virus (AAV) particles.
Objective: The goal of this study was to integrate the available pharmacogenomics and proteomic data to develop effective anti-tumor therapies using a targeted drug delivery approach.
Methods: Plectin expression and localization in human ovarian tumor specimens were analyzed followed by in vitro confirmation of cell surface plectin localization in healthy and ovarian cancer cell lines. PTP-conjugated liposomes were prepared and their specificity for plectin+ cells was determined in vitro and in vivo. A remote loading method was employed to encapsulate a PARP inhibitor (AZ7379) into liposomes. An ideal buffer exchange method and remote loading conditions were determined based on the amount of lipid and drug recovered at the end of a remote loading process. Finally, in vivo tumor growth studies were performed to determine the efficacy of PTP liposomes in preventing PARP activity in mice bearing OVCAR8 (high grade epithelial ovarian cancer (EOC)) tumors.
Results: PTP liposomal AZ7379 delivery not only enhanced PARP inhibition but also resulted in decelerated tumor growth in mice bearing subcutaneous and intraperitoneal OVCAR8 tumors. In mice bearing subcutaneous or intraperitoneal tumors, treatment with PTP liposomes resulted in a 3- and 1.7-fold decrease in tumor volume, respectively, compared to systemic drug treatment.
Conclusion: Targeted drug delivery assisted by genomic and proteomic data provides an adaptable model system that can be extended to effectively treat other cancers and diseases.
Keywords: genomics, proteomics, plectin, poly(ADP-ribose) polymerase, targeted drug delivery, epithelial ovarian cancer, pharmacokinetics, pharmacodynamics
Introduction
Advances in cancer medicine lie at the rapidly evolving intersection of -omics technologies. In the clinically emergent field of pharmacogenomics, pharmacology and human genomics are combined to develop new therapies tailored to an individual's unique genetic profile [1]. With more expedited human genome sequencing and the genetic profiles of numerous cancer subtypes now defined, the immense potential for pharmacogenetics to improve patient care has been realized, as validated pharmacogenetic markers can streamline clinical management by directing the selection of the most efficacious agent while revealing others that would cause toxicity or would be ineffective. An exemplary display of this approach has been the identification of molecular alterations in the DNA homologous recombination pathway, including mutations to BRCA1/2, that are utilized to inform caregivers on potential patient response to poly(ADP-ribose) polymerase (PARP) inhibitors.
In companion, oncoproteomics aims to improve clinical management of cancer through identification of unique molecular targets and biomarkers that help diagnose and predict treatment response [2,3]. One illustration of this approach is the use of cell surface markers to aid in early cancer diagnosis and facilitate delivery of therapeutic agents preferentially to cancer cells. A pioneering study in this field conducted nearly a decade ago by Kelly, et al. utilized phage-based functional proteomics to identify plectin as a new cell surface target in pancreatic ductal adenocarcinoma (PDAC) [4]. Subsequent evaluation has revealed plectin exposed on the cell surface in cancers of the ovaries, esophagus, bile duct, and head and neck [5,6]. Importantly, plectin mislocalized to the cell surface during cancer progression while remaining cytoplasmic in healthy cells. This all-or-nothing phenotype makes plectin an exquisite target for directed therapies.
Ovarian cancer may serve as a model disease where pharmacogenomics and oncoproteomic technologies can intersect to produce effective anti-cancer therapies. Individuals that harbor mutations in BRCA1/2 proteins that are critical for the repair of double-stranded DNA breaks induced during homologous recombination, have a high risk for breast, pancreas or ovarian cancers [7,8]. Ovarian cancer is commonly associated with homologous recombination (HR) deficiency resulting from BRCA1/2 (10-20% of high grade ovarian cancers) and BRCA-like mutations (50% of high grade ovarian cancers) [9-11], which make them sensitive to agents such as PARP inhibitors that prevent DNA repair [12]. The US Food and Drug Administration (FDA) recently approved the use of PARP inhibitors (Olaparib, Niraparib and Rucaparib) in the population with BRCA1/2 mutations for treatment of ovarian cancer patients with platinum-sensitivity and recurrent ovarian cancer [13-15]. However, 10% of the patients showed adverse side effects, such as the life-threatening conditions of neutropenia and thrombocytopenia, when given the doses necessary to achieve PARP inhibition [12,16-19]. About 2% of patients who received Olaparib developed myelodysplastic syndrome and acute myeloid leukemia resulting from excessive PARP inhibition in the bone marrow [20], indicating that off-target effects were substantial in these patients. These studies suggest that the intended goals of PARP inhibition at the tumor site without compromise to patient safety may be achieved by the targeted deposition of an increased drug payload.
One potential route to address this is through a liposomal drug delivery platform. Liposomes have been shown to increase the pharmacokinetic (PK) and pharmacodynamic (PD) profiles of small molecule drugs [21,22], and, importantly, a number of non-targeted liposomal formulations have already been approved by the FDA in the treatment of cancer [23,24]. Similar non-targeted nanoparticle formulations of PARP inhibitors have shown promising results with minimal toxicities in animal studies [25,26]. The addition of a target-specific ligand (e.g., peptides or antibodies with affinity for cell surface targets/receptors) to liposomal formulations can amplify the therapeutic index of drugs approved for clinical use [27-30]. Peptides offer an appealing starting point for generating target-specific liposomes due to the fact that their specificities translate into excellent safety and efficacy profiles in humans. Additionally, peptides are typically known to be less immunogenic and associate with lower production complexity compared to antibodies [31,32].
In previous studies, we capitalized on the cancer-specific phenotype of cell-surface plectin to successfully image pancreatic cancer using plectin-targeted peptide (PTP) conjugated to nanoparticles or displayed on capsid protein of adeno-associated virus (AAV) particles [33]. For the current study, we hypothesized that a PARP inhibitor (AZ7379) encapsulated by a PTP-conjugated liposome will result in a more effective treatment of cancers with BRCA1/2 mutations. Our results demonstrate the robust loading of AZ7379 into liposomes and that AZ7379 delivered by PTP-targeted liposomes not only enhanced PARP inhibition but also resulted in decelerated tumor growth in animals bearing OVCAR8 (high grade epithelial ovarian cancer (EOC)) tumors. Treatment of mice bearing subcutaneous or intraperitoneal OVCAR8 tumor with PTP liposomes resulted in a 3- and 1.7-fold decrease in tumor volumes, respectively, compared to systemic drug treatment.
Methods
Experimental materials
Lipids for liposome preparation
1,2-dioleoyl-sn-glycerol-3-phosphocholine (DOPC), cholesterol, 1,2-distearoyl-sn-glycero-3-phosphoethanolamine-N-[methoxy(polyethylene glycol)-2000 (DSPE-PEG2000) and DSPE-PEG3400-Maleimide were purchased from Avanti polar lipids, Miami, FL. 1,1'-dioctadecyl-3,3,3'3'-tetramethylindotricarbocyanine iodide (DiR) was purchased from Invitrogen, Carlsbad, CA. Peptides were synthesized by the Tufts University peptide synthesis core facility using standard FMOC chemistry and Rink-Amide resin (Tufts University, Boston, MA).
Immunofluorescence of ovarian cancer cells and tumors
Healthy fallopian tube cells, FT132 and ovarian cancer cell lines and tumors (SKOV3 and OVCAR8) were stained for plectin using rabbit monoclonal anti plectin antibody (Abcam, Cambridge, MA) for both IHC and immunofluorescence. PARP activity in OVCAR8 tumors was determined through immunofluorescence of poly ADP ribose (PAR) using anti-PAR rabbit polyclonal (Trevigen, Gaithersburg, MD). Anti γ-H2AX (Abcam, Cambridge, MA) was used to quantify double stranded DNA (ds-DNA) breaks after treatment with AZ7379. Anti- LAMP-1 and EEA1 (Abcam, Cambridge, MA) were used to detect early and late endosomes. PARP-1 trapping on chromatin in response to AZ7379 was assessed by Western blotting for PARP-1 (Abcam, Cambridge, MA) in whole cell lysates and chromatin fraction. Appropriate secondary antibodies were employed as needed to identify the primary antibodies: goat anti-rabbit Alexa Fluor 488 (1:250) (Abcam, Cambridge, MA), donkey anti-rabbit Alexa fluor 594 (1:200) (Life Technologies, Frederick, MD).
Experimental methods
Immunohistochemistry for plectin
Paraffin-embedded tumor micro array (TMA) slides were deparaffinized, hydrated with TBS and blocked with H2O2. Antigen retrieval was performed by boiling the slides in Antigen retrieval solution (R&D Systems, Inc. Minneapolis, MN). The slides were later blocked with avidin/biotin (Vector laboratories, Burlingame, CA) and 5% goat serum in TBS followed by incubation overnight at 4 °C with 1:250 dilution of Plectin antibody (Abcam, Cambridge, MA). The slides were washed three times in TBST, followed by incubation with HRP-conjugated goat anti-rabbit secondary antibody (BD Biosciences, San Jose, CA). The slides were developed using DAB and visualized using a microscope. TMA consisted of 20 samples each of 5 high-grade tumor types (endometrioid, mucinous, serous papillary, clear cell, poorly differentiated) and 2 low-grade tumor types (serous cystadenoma and mucinous cystadenoma). Each tumor sample in the TMA was examined by a pathologist (A. M.) who assigned a score of 0 (negative), 1+ (weak), 2+ (moderate), and 3+ (strong). The pathologist also determined the percentage of plectin expression and its localization either in the cytosol or in the cell membrane.
Immunofluorescence and Western blot for cell surface plectin
FT 132, healthy fallopian tube cells, were cultured in DMEM supplemented with 10% FBS and ovarian cancer cell lines SKOV3 and OVCAR8 cells were grown in either RPMI supplemented with 10% FBS. For plectin immunofluorescence, cells were grown in glass chamber slides. Immunofluorescence was carried out after fixing the cells in 4% paraformaldehyde for 20 min at room temperature followed by blocking the slides with 0.5% BSA in PBS for 1 h at room temperature. Slides were later incubated with primary antibody (anti-plectin rabbit monoclonal antibody) overnight at 4 °C. The next day, the slides were washed 3-4 times with PBS and incubated with goat anti-rabbit alexa fluor 488 conjugated antibody for 30 min at room temperature. The slides were later washed 3 times with PBS, mounting media was added, a cover slip was placed over the slide and the slide was imaged using a confocal microscope (Nikon Eclipse TE2000-E2, Nikon, Melville, NY, USA). Cell surface plectin was quantified after isolating cell surface proteins using cell surface biotinylation protein isolation kit (Thermo Fisher, Waltham, MA). Biotinylated cell surface proteins were isolated according to the manufacturer's protocol using streptavidin beads. Plectin was quantified from total cell surface biotinylated proteins of FT 132, SKOV3 and OVCAR cells (~250k cells) and normalized to the expression levels of cell membrane protein, alpha 1 sodium potassium ATPase (ATP1A1) via Western blot. The relative densities were analyzed by one-way ANOVA followed by Tukey's multiple comparison test to determine if p values were significant (p < 0.05).
Biolayer interferometry (BLI) to study PTP-liposomes binding to C-terminus fragment of plectin
Biolayer interferometry (BLI) was performed using ForteBio octect Red 96 system (ForteBio, Menlo Park, CA); we used recombinant C-terminus fragment of plectin (4379-4684 aa). All BLI assays were performed in black 96-well plates (Nunc F96 Micro Well plates, Thermo Fisher, Waltham, MA). The total working volume for samples or buffer was 0.2 mL per well and the rpm setting for each equilibration and loading step was set at 1000 rpm. The association and dissociation step with C-terminus fragment of plectin and peptide-liposomes was carried out at 600 rpm. Prior to each assay, anti-his biosensor tips were pre-wetted in 0.2 mL PBS for at least 10 min followed by equilibrium with PBS for 100 s. Anti-his biosensors were then non-covalently loaded with his-tagged C-terminus fragment (50-200 g/mL, 100 s). Subsequently, association with No peptide, negative control peptide (NCP) and PTP liposomes (40 mM, 300 s) was carried out. Finally, the dissociation was monitored in PBS for 600 s.
Preparation and characterization of liposomes
Peptides (7-mers; PTP: plectin-targeting peptide, NCP: negative control peptide) were chemically synthesized with the following modifications on the C-terminus: 7-mer-GGSK(FAM)C. Peptides were conjugated to DSPE-PEG3400-maleimide as described previously [37]. Liposomes were prepared by hydration of lipid film prepared with 1,2-dioleoyl-sn-glycerol-3-phosphocholine (DOPC; Avanti Polar Lipids, Miami, FL), cholesterol, 1,2-distearoyl-sn-glycero-3-phosphoethanolamine-N- [methoxy (polyethylene glycol)-2000 (DSPE-PEG2000), DiR, and DSPE-PEG3400-peptide at a 46:46:6:1:1 molar ratio (9.5, 4.5, 4.5, 1, and 0.5 mg, respectively). 1,1'-dioctadecyl-3,3,3'3'-tetramethylindotricarbocyanine iodide (DiR, Invitrogen, Carlsbad, CA) was incorporated into the lipid bilayer as a non-exchangeable fluorescent lipid dye that provided FMT imaging of the peptide-conjugated liposomes in post-MI mice. The lipid mixture was dissolved in 1 mL of chloroform, dried using a rotary evaporator and left in a vacuum desiccator overnight to completely remove residual chloroform. The next day, the lipid film was hydrated with 1 mL of saline and the resulting lipid solution was extruded 41 times using a syringe extruder containing a 0.2 μm Nuclepore filter (Thermo Fisher Scientific Inc, Waltham, MA). The resulting liposomes were characterized by NanoSight NS300 (Malvern Instruments Ltd, Worcestershire, UK) to determine particle size and concentration. The absorbance of FAM on the peptides enabled the determination of the number of peptides that were incorporated in each liposomal formulation.
Liposomal binding to ovarian cancer cells
FT 132, SKOV3 and OVCAR8 cells were plated in triplicate in a 96 well black plate at a concentration of 5000 cells per well. After 48 h, liposomes at concentrations ranging from 0.1 to 8 μm were incubated with the three cell lines after washing the wells with PBS buffer for 1 h at 37 °C. The cells were later washed with PBS and liposomal DiR intensity was measured using a fluorescence plate reader (FLUOstar omega, BMG Labtech Inc. Cary, NC). PTP liposomal binding to the three cell lines was compared with liposomes containing no peptide (background binding) and with NCP (non-specific binding). Background binding by the no peptide liposomes was subtracted from both the non-specific (NCP) and PTP liposomes. To obtain specific binding of PTP liposomes, we subtracted non-specific (NCP) binding from the total binding by the PTP liposomes.
PK of peptide-conjugated liposomes
Each of the peptide-conjugated liposomes was later injected via tail vein in post-MI mice to determine their pharmacokinetics using fluorescence molecular tomography (FMT) imaging. Animals (n=8) were injected with 2 mg of lipid (100 μL containing 1×10¹¹ liposomes-No Peptide, NCP and PTP) and DiR present in the tumor ROI was imaged using the 750 nm laser of the FMT 4000 system (PerkinElmer, Waltham, MA). The amount of DiR in the tumor region was plotted against time to determine tumor specificity and accumulation of PTP liposomes. Following 24 h post injection, ex vivo imaging of organs was carried out to determine the amount of DiR present in these organs and was represented as percentage of injected dose (%ID). From the same data, area under the curve (AUC) was determined using MATLAB based on a two-compartment model fit (Supplementary Material). The presence of DiR in the lipid bilayer of liposomes quickly enabled us to identify the presence of liposomes in the tumor sections. The PK curves were analyzed by one-way ANOVA followed by Tukey's multiple comparison test to determine if p values were significant (p < 0.05).
In vitro growth inhibition studies
SKOV3 and OVCAR8 cells were plated in triplicate in 96-well opaque plates at a concentration of 5000 cells per well. After 24 h, cell culture media was replaced with fresh media for untreated control wells or RPMI with varying concentrations of AZ7379. After 48 h of incubation with AZ7379, the number of viable cells was determined by quantifying ATP using CellTiter-Glo® (Promega, Madison, WI) cell viability luminescent assay kit. 100 µL of CellTiter Glo® reagent was prepared as described by the manual and added to each plate. The plates were incubated for 10 min in the dark followed by measuring luminescence using a FLUOstar OPTIMA microplate reader. Relative growth was calculated with untreated wells as being at 100% and plotted against concentration of AZ7379. Using prism software, IC50 values were determined for OVCAR8 and SKOV3 cells.
Remote loading of AZ7379
Chemical structure and physiochemical properties of AZ7379 (provided by AstraZeneca) are represented in Figure S4. Optimization of remote loading was carried out through a two-step process that involved first the identification of a buffer exchange method with the least loss of lipid followed by determination of the remote loading conditions with high loading efficiencies (Figure S5). These optimization steps were initially carried out with no peptide liposomes followed by PTP liposomes.
For remote loading of AZ7379, liposomes were prepared as decribed previously by reverse phase evaporation [37]. In brief, the lipid mixture containing DOPC, cholesterol, DSPE-PEG(2k) were dissolved in 1 mL of chloroform and to this 3 mL of ethyl ether and 1 mL of 0.25 M ammonium sulfate solution was added. This lipid mixture was sonicated with a probe sonicator (XL2020, Misonix Inc, Farmingdale, NY) to prepare a water-in-oil emulsion, and, with the help of a rotary evaporator, organic solvents were removed under vacuum. Liposomes were prepared by passing through a 0.2 μm Nuclepore filter using a syringe extruder. Before remote loading, the ammonium sulfate present outside of the liposomes was removed by passing twice through size-exclusion, Zeba Spin desalting columns (Thermo Scientific, Rockford, IL). Zeba spin columns were washed three times with 10 mM HEPES buffer (pH 7.4) by spinning columns in a swinging bucket rotor at 1500 ×g for 1 min before loading ammonium sulfate liposomes. 0.5 mg of AZ7379 (2.5 mg/mL in 10 mM HEPES pH 7.4) was then incubated with 5 mg of lipid (20 mg/mL) at 65 °C for 1 h or 4 h and at room temperature for 4 h (Figure S5 and Figure S6A). The free drug was removed by passing through Zeba spin columns that were washed with 10 mM HEPES buffer, and the drug-to-lipid ratio for the purified liposomes was determined by HPLC (Figure S6) using a combination of spectrophotometric and evaporative light scattering detectors as described previously [37].
AZ7379 release kinetics
The efficiency of remote loading was typically 100-120 μg of AZ7379 per mg of lipid for No Pep liposomes and 80 μg of AZ7379 per mg of lipid for PTP and NCP liposomes quantified by HPLC methods. The size and concentration of the liposomes was determined using NanoSight. AZ7379-loaded No Pep and PTP liposomes were mixed with 50% fetal bovine serum in saline and the release was assessed at regular time points by measuring the amount of drug released into 50% FBS maintained at 37 °C by HPLC. Release rates were plotted for each of the liposomal formulations as cumulative % release over time.
In vivo anti-tumor effects of AZ7379
Animal experiments were performed after approval from the Institutional Animal Care and Use Committee (IACUC), University of Virginia. To determine the benefits of plectin-specific delivery over systemic delivery, tumor volume over time and extent of PAR formation at the end of treatment period were compared after treating mice bearing OVCAR8 tumors (2 tumors per animal) with PTP liposomes loaded with AZ7379 vs. systemic AZ7379. Athymic nude mice (n=28) were injected subcutaneously in two regions with OVCAR8 cells and once the tumors reached a volume of ~100 mm3, we randomly assigned the mice to one of 5 different groups: 1) untreated (n=5), 2) systemic AZ7379-0.5 (n=5), 3) systemic AZ7379-1 (n=6) 4) No Pep AZ7379 (n=6), 5) negative control peptide (NCP) AZ7379 (n=6), 6) PTP AZ7379-0.5 (n=6), and 7) PTP AZ7379-1 (n=6). Systemic AZ7379-0.5 and -1 were given via oral gavage 3 times a week at 0.5 and 1 μmol/kg/gavage respectively and liposomes were injected via tail vein 2 times a week at 1.5 μmol/kg/injection except PTP AZ7379-0.5, where liposomes were injected twice a week at 0.75 μmol/kg/injection (Figure 5A). Tumor volume was measured using calipers and average tumor volume per group was plotted against time. Tumor volume (TV) was determined every week and calculated using the formula TV = L × W × W / 2. Mouse body weight was also recorded every week to check if there were any sudden changes in the body weight due to the tumors. Tumor volumes from each group were analyzed by paired t test to determine if the treatment groups were significant (P < 0.05). After 3 weeks of treatment, mice were euthanized and one tumor from each animal was snap frozen and used for Western blot for PAR and another tumor was fixed in 4% paraformaldehyde to quantify PAR through immunofluorescence.
A second ovarian cancer model was employed to mimic metastasis to the intraperitoneal (IP) cavity and to evaluate liver function and myeloid cell population in response to AZ7379 treatment. OVCAR8 cells expressing iRFP720 protein were injected intraperitoneally, and after 7 days the mice were imaged via FMT and randomized into treatment groups; 1) untreated (n=6), 2) systemic AZ7379 (n=6), 3) No Pep AZ7379 (n=6), and 4) PTP AZ7379 (n=6). 10 days prior to the tumor cell injection and all through the treatment period, animals were maintained on non-fluorescent diet (Envigo, Indianapolis, IN) so as to avoid background fluorescence from the animal diet. Right before OVCAR8 cells were injected, mice were imaged using FMT to determine background fluorescence (emission at 720 nm). Systemic AZ7379 was delivered via oral gavage 3 times a week at 1 μmol/kg/gavage and liposomes were injected via tail vein 2 times a week at 1.5 μmol/kg/injection. Mice were treated for 3 weeks with similar dosing described previously in the subcutaneous model. Tumor growth was monitored by performing FMT imaging of mice twice a week. At the end of 3 weeks, blood granulocyte and monocyte populations were quantified by flow cytometry. Liver function was determined by measuring aspartate aminotransferase (AST) and alanine aminotransferase (ALT) (Sigma-Aldrich, St. Louis, MO) levels in the serum. After necroscopy, visible tumor nodules were counted and the organs in the IP cavity were imaged ex vivo via FMT. The fluorescence from each organ was normalized to its weight. PAR levels in the tumors were determined by immunoblot.
PAR quantification (immunofluorescence and Western blot)
The tumor samples were fixed in 4% paraformaldehyde and frozen in OCT so that 5 μm sections could be prepared using a cryostat. PARP-1 activity was assessed by quantitative image analysis as the percentage of poly(ADP-ribose) (PAR)-positive nuclei present in tumor sections. PAR accumulation was assessed in at least 5, 5 μm sections taken from each tumor using antibody recognizing PAR (Trevigen, Gaitherburg, MD). In the image analysis, a total of 5, 20x and 5, 60x images from each tumor was used for PAR quantification. Percent PAR+ area within each tumor section was determined using imageJ and was compared between the different groups. The second tumor from each animal was lysed and used for PAR quantification using Western blot analysis using the same antibody as described above. 10 µg of protein from 3 animals from each group were separated on a SDS gel followed by transferring of proteins onto a nitrocellulose membrane. Once the proteins were transferred, the membrane was blocked using 5% non-fat dry milk in Tris buffered Saline (TBS) buffer containing 0.2% tweem-20 (TBST) for 30 min at room temperature on a shaker. The membrane was later incubated with anti-PAR rabbit polyclonal antibody at 1:1000 dilution in 5% milk in TBST overnight at 4 °C. The next day, the membrane was washed 4 times with TBST followed by incubation with donkey anti-rabbit HRP antibody (GE healthcare biosciences, Pittsburg, PA) at 1:10000 dilution in 5% milk in TBST for 20 min at room temperature. The membrane was washed 3 times with TBST followed by incubation with Immobilon Western chemiluminescent HRP substrate (Emdmillipore, Billerica, MA) for 2 min at room temperature. The membrane was later exposed to autoradiography film in a dark room and developed using an x-ray film developer. After film development, the membrane was washed with TBST overnight at 4 °C. The membrane was later blotted for alpha-actin by incubating overnight at 1:5000 dilution in 5% milk in TBST at 4 °C. The next day, the membrane was washed and incubated with goat anti-mouse HRP antibody and actin bands were imaged as described above. PAR and actin bands on x-ray film were quantified using a densitometer (Bio-Rad GS-800, Bio-Rad, Hercules, CA) and ImageQuant software (GE healthcare biosciences, Pittsburg, PA). PAR to actin density for each tumor sample was plotted for each experimental group. Ratios of PAR to actin were analyzed by one-way ANOVA followed by Tukey's multiple comparison test to determine if p values were significant (p < 0.05).
Flow cytometry
500-700 μL of blood was drawn from each mouse via cardiac puncture and placed in a tube containing 1 mL of 5 mM EDTA/Hank's balanced saline solution (-Mg, -Ca) (HBSS). An additional 10 mL of HBSS was added and the blood was centrifuged and the cell pellet was resuspended in MACS buffer (0.5% BSA, 250 mM EDTA in PBS). To remove RBCs, the cells were incubated with ACK lysis buffer (Thermo Scientific, Waltham, MA) for 5 min at room temperature and immediately quenched with complete media. The cells were then washed in MACS buffer and counted using a hemocytometer. For 0.35×10⁶ cells, anti-Ly-6G PE (1:200 dilution; BioLegend, San Diego, CA), anti-Ly-6C PE/Dazzle (1:800 dilution; BioLegend, San Diego, CA), anti-CD45 PE/cy5 (1:800 dilution; BioLegend, San Diego, CA), anti-CD11b PE/cy7 (1:800 dilution; BioLegend, San Diego, CA), and Live dead stain (1:200; Thermo Scientific, Waltham, MA) were incubated for 30 min and washed 3 times before fixing the cells in 4% paraformaldehyde. The stained blood cells were analyzed by CyAn ADP (Beckman Coulter, Brea, CA).
Table 1
Plectin expression and cellular localization
| Tumor type | Scorea | Percentageb | Localization |
|---|---|---|---|
| Endometrioid | 2+ | >80 | cytosol |
| Mucinous | 2+ | >80 | cytosol |
| Serous papillary | 3+ | >90 | cell Membrane |
| Clear cell | 3+ | >80 | cell membrane |
| Poorly differentiated | 3+ | >80 | cell membrane |
| Serous cystadenoma | 2+ | >70 | cytosol |
| Mucinous cystadenoma | 2+ | >70 | cytosol |
a 0 = negative, 1+ weak, 2+ moderate, 3+ strong. b Percentage of cells positive.
Statistical analysis
All experiments were repeated at least three times, and statistical analysis of the data was performed by one-way analysis of variance (ANOVA) followed by Tukey's multiple comparison test. PKs of different liposomes were compared using paired t-test to determine if they were significant. Tumor volumes between groups were compared using paired t-test to determine if they were significant. All data represented here is mean ± standard deviation of at least three independent measurements. For all comparisons, p < 0.05 was considered significant.
Results
Plectin expression in ovarian cancer
Plectin was previously identified in our lab as a PDAC cell surface biomarker through a phage display-based proteomics approach [4-6]. In follow-up studies a plectin-targeting peptide (PTP) that displayed specific binding to plectin was generated and subsequently utilized in vivo to image animals bearing pancreatic tumors [4,5,33,34]. Immunohistochemical analyses of human patient specimens demonstrated high levels of plectin expression in cancers of the pancreas, ovaries, head and neck but low or medium levels of expression in healthy specimens. However, in the case of ovarian cancer, only serous carcinoma was evaluated. Therefore, we expanded analysis of plectin to tumor microarrays (TMA) from several different classes of low- and high-grade ovarian tumors. Each TMA spot was examined by a pathologist (A. M.) who assigned both the cellular localization of plectin, cytosol or membrane, and a score for relative expression, with 0 (negative), 1+ (weak), 2+ (moderate), and 3+ (strong) (Table 1). Our results indicate that plectin expression was either moderate or strong for all types of ovarian cancer that were evaluated. In serous, clear cell and poorly differentiated ovarian cancer specimens, plectin expression was observed in more than 80% of the cancer cells and its expression was mainly localized to the cell membrane (Figure 1A). Conversely, plectin was mainly cytosolic in endometrioid and mucinous cancer specimens, as well as in low-grade tumors such as serous cystadenoma and mucinous cystadenoma. These results indicate that plectin localization to the cell membrane occurs in several types of human ovarian cancer—importantly in clear cell carcinoma, which has a paucity of treatment options.
To further evaluate plectin cell surface expression, we performed cell surface biotinylation on healthy human fallopian tube epithelial cells (FTECs), FT132 [35], and two ovarian cancer cell lines of different grade and BRCA1/2 status, SKOV3 (low-grade, WT BRCA1/2) and OVCAR8 (high-grade, mutated BRCA1/2). Immunoblot detection of the surface protein isolates revealed that indeed plectin is present on the cell surface and expressed at the highest levels in high-grade OVCAR8 cells (12-fold over FT132). The low-grade SKOV3 cells had reduced expression compared to that of OVCAR8; however, their expression was still markedly above that of healthy cells (3-fold over FT132) (Figure 1B-C).
Preparation and characterization of PTP liposomes
Following confirmation of cell surface plectin expression, we next generated and characterized our liposomal preparations. First, peptide sequences KTLLPTPGGSK(FAM)C (PTP: plectin-targeting peptide) and TALPRLNGGSK(FAM)C (NCP: negative control peptide) were conjugated to DSPE-PEG3400-maleimide to form PTP-PEG3400-DSPE (Figure 2A). No peptide-containing liposomes (No Pep) were prepared in parallel as an additional control. The size and concentration of the three liposome formulations, as determined by NanoSight analysis, were similar and ranged between 110-120 nm and 3×10¹³ ± 4×10¹¹ particles per mL, respectively. The zeta potential for liposomes without peptide was 32 ± 1.2 mV and liposomes with peptides (NCP or PTP) had a zeta potential of 31 ± 1.6 mV, suggesting very little influence of peptide charge on the zeta potential of the liposomes (Figure S1).
Second, we wanted to verify that our PTP liposome formulation maintained PTP's ability to bind to plectin. To accomplish this, we utilized the ForteBio octet system and biolayer interferometry (BLI) to measure the binding of PTP, NCP, and no peptide liposomes to recombinant c-terminus fragment of plectin (4379-4384 aa) (Figure 2B). Only PTP liposomes associated with plectin, confirming not only their specificity for plectin but also that the incorporated PTP-DSPE conjugate was in the correct orientation.
Figure 1
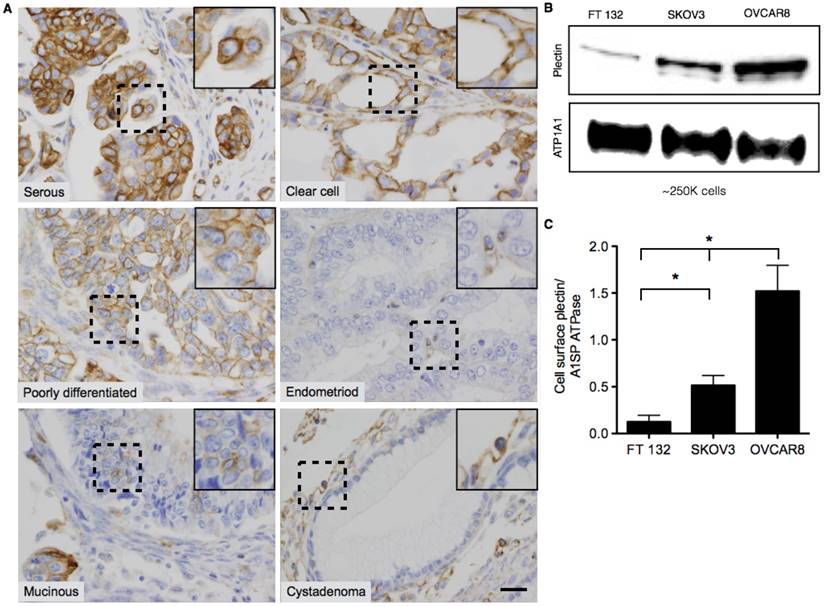
Representative images of Plectin-1 immunohistochemistry of Ovarian TMAs. (A) Representative images of serous, clear cell, poorly differentiated, mucinous, and endometrioid carcinomas and benign cystadenoma tumors. In serous, clear cell and poorly differentiated carcinomas, plectin was highly expressed and localized mostly in the cell membrane. In endometrioid and mucinoius carcinomas, plectin was mostly localized in the cytosol. In benign samples (serous and mucinous cystadenoma), plectin expression was low and localized in the cytosol. Insets in the images are magnified regions from the corresponding black squares. (Scale bar: 20 μm) (B) Western blot for plectin and cell membrane protein, alpha 1 sodium potassium ATPase (ATP1A1) from surface biotinylated fraction of proteins from FT132, SKOV3 and OVCAR8 cells. (C) Densitometric ratios of plectin to ATP1A1 were plotted for FT132, SKOV3 and OVCAR8 to determine plectin expression in relation to ATP1A1. (* represents p < 0.05).
PTP liposomes display binding specificity and enhanced tumor uptake
Based on the expression data presented in Figure 1B-C, we utilized the FT132, SKOV3 and OVCAR8 cell lines to determine if the PTP liposomes showed specificity in a cell-based context. Liposomes containing the lipophilic dye DiR were serially diluted and incubated with each of the three cell lines, followed by measurement of fluorescent intensity to quantify liposome-cell binding. PTP liposomes bound to SKOV3 and OVCAR8 cells with a Kd of 0.12 nM and 0.11 nM, respectively (Figure 3). In contrast, PTP liposomes did not exhibit significant binding above background when incubated with healthy fallopian tube cells, FT132 (Figure 3A). No peptide and NCP liposomes demonstrated similar background levels of binding to the three cell types. These results indicate that cells with the highest level of cell surface plectin also display the greatest capacity to bind specifically to our PTP liposomes. In addition to binding, we also sought to determine whether our PTP liposomes were endocytosed. PTP liposomes containing DiR were added to the culture of OVCAR8 cells in which EEA1 (early endosome antigen 1) or LAMP-1 (lysosomal-associated membrane protein 1) (late endosomal biomarker) were co-stained (Figure S2A). No Pep and PTP were both endocytosed but at 8 h, PTP liposomes were associated with EEA1 2.3-fold greater compared to No Pep liposomes (Figure S2B). Similarly, at 24 h PTP liposomes associated with LAMP-1 1.6-fold greater when compared to No Pep liposomes (Figure S2C).
Next, we studied the PK and biodistribution of No peptide, NCP, and PTP liposomes (1 mg of lipid) in SKOV3 and OVCAR8 subcutaneous tumor models using fluorescence molecular tomography (FMT), which, due to the presence of DiR (a lipophilic, near-IR dye) in the lipid bilayer of liposomes, allowed PK analysis through non-invasive serial imaging [36] (Figure 4A-B). The amount of DiR in the tumor region was quantified from the reconstructed images using FMT system software and the percent injected dose (%ID) of liposomes (DiR) was plotted against time for both SKOV3 and OVCAR8 tumors (Figure 4C-D). Using a two-compartment model fit, we observed a 1.3- and 1.9-fold greater area under the curve (AUC) of PTP liposomes in SKOV3 and OVCAR8 tumors, respectively, compared to the No peptide liposomes (AUC 50 for PTP vs. 38 for No Pep in SKOV3; AUC 64 for PTP vs. 34 for No pep in OVCAR8) or NCP liposomes (AUC 39 in SKOV3; AUC 41 in OVCAR8). AUC represents the total exposure of the tumor to the liposome with a higher AUC indicating higher drug delivery to the tumor. A direct comparison of PTP liposome in tumor-bearing animals (AUC 64 in OVCAR8, AUC 50 in SKOV3) and ex vivo biodistribution analysis at 24 h post-injection (4.3 pmol in OVCAR8 and 3.8 pmol in SKOV3) indicated ~1.2-fold greater amount of accumulation in OVCAR8 compared to SKOV3 tumors (Figure 4E). Association of PTP liposomes with OVCAR8 tumors was ~1.3-fold greater than SKOV3 tumors, which was comparable to what we observed in cell binding assays (Figure 3-4).
Figure 2
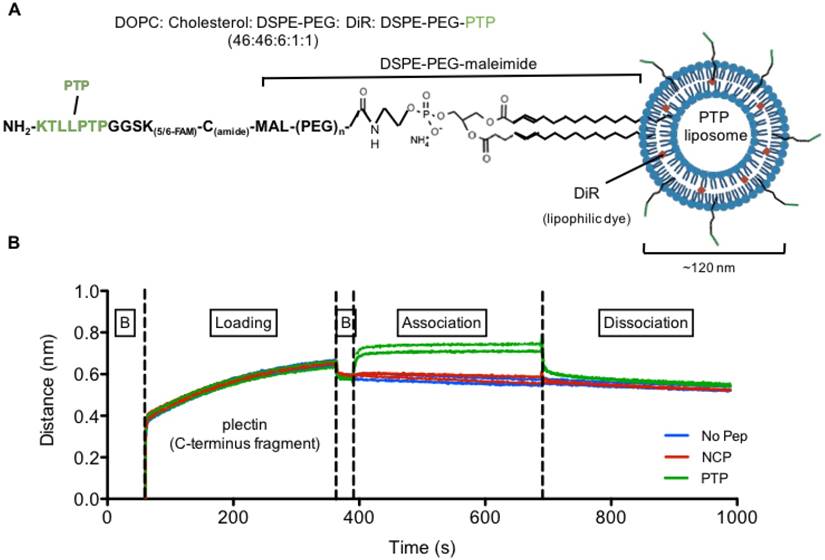
Plectin-targeted peptide (PTP) liposomes bind to Plectin. (A) PTP peptide was conjugated to DSPE-PEG-maleimide via the thiol present on the C-terminus of the peptide. (B) Binding of PTP liposomes to the C-terminus of Plectin was measured using biolayer interferometry (BLI). The anti-His antibody coated sensors were used to bind his-tagged plectin fragment followed by association with no peptide, NCP and PTP liposomes. Association and dissociation response was seen by PTP liposomes but not with No peptide and NCP liposomes. (B, baseline).
The delivery platform tested here is founded on the targeted delivery of liposomal-encapsulated drug. Therefore, we wanted to confirm that our results presented above were in fact due to PTP liposomes binding to OVCAR8 and SKOV3 cells and no other cells within the tumor milieu. Specimens from SKOV3 and OVCAR8 tumor-bearing mice were harvested 24 h post liposomal DiR injection and stained for plectin expression. Immunofluorescence analysis indicated a high degree of overlap of DiR+ liposomes and plectin-positive cancer cells, suggesting that liposomes accumulated primarily in the targeted tumor cells (Figure 4F). When explored further, No Pep liposomes associated with only 20% of plectin+ or CD31+ cells but PTP liposomes associated with 50% of plectin+ cells and 24% fo CD31+ cells, suggesting a shift in the distribution of liposomes favoring plectin+ tumor cells (Figure S3).
Figure 3
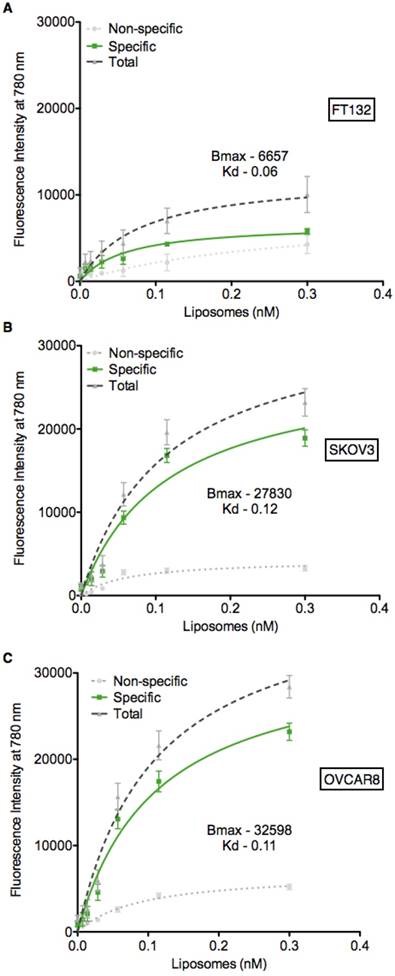
PTP liposomes bind to SKOV3 and OVCAR8 cells. Cell binding assay (ELISA) was carried out to assess PTP liposome association to cell surface plectin on SKOV3 and OVCAR8 cells. Liposomes (No Pep, NCP and PTP) at varying concentrations were incubated with FT132, SKOV3 and OVCAR8 cells for 1 h at 37 °C followed by quantification of DiR using fluorescent plate reader. The binding of No Pep liposomes was subtracted from NCP to determine the non-specific binding. NCP binding was subtracted from PTP liposomes to determine specific binding of PTP liposomes to (A) FT132, (B) SKOV3 and (C) OVCAR8 cells.
Remote loading of AZ7379 into PTP liposomes and their stability in 50% animal serum
It is well established that cancer cells harboring mutant BRACA1/2 are more susceptible to PARP inhibition than are WT BRAC1/2 cells. For maximum efficacy and minimum off target effects, PARP inhibitors must be delivered specifically to the target cell at high payload. Therefore, we determined the liposome remote loading capacity of several PARP inhibitors, including Olaparib, AZ7379, AZ3598, and AZ9594. Our results indicated that the loading efficiency of Olaparib, AZ3598, and AZ9594 was less than 30% (data not shown); however, since AZ7379 displayed an efficiency of greater than 60% (Figure S4A-B), we selected this compound for our studies.
We first validated the drug in our hands by measuring SKOV3 and OVCAR8 growth at different concentrations of drug. As expected, the BRCA1/2 mutated OVCAR8 were more susceptible to AZ7379-induced growth inhibition than WT BRCA SKOV3, with a demonstrated IC50 of 177 μM AZ7379 (Figure S4C). We next systematically characterized the loading, composition, and stability of our liposomal formulations. To optimize a remote loading protocol, we determined the buffer exchange conditions that resulted in the greatest lipid retention during preparation (Figure S5 and Figure S6A-B). Size exclusion permitted the greatest recovery of lipid (41% recovered, with identical molar ratios of lipids as in the initial lipid mixture), as determined by HPLC, compared to ultracentrifugation (32%) or dialysis (38%). Second, we determined that a 4 h incubation at room temperature was optimal for loading AZ7379 compared to two other tested conditions, which lead to a 70% loading efficiency with a drug (μg) to lipid (mg) ratio of 135 ± 2.3 (Figure S5 and Figure S6A, C). Nanoparticle tracking analysis indicated that liposome size was consistent at each stage (initial, after buffer exchange (BE), after remote loading (RL)); however, the concentration of liposomes decreased progressively, which correlated with the HPLC quantification of final lipid content (~41% lipid recovered) (Figure S6B). Cryo-TEM also revealed that the structure of liposomes remained intact during this process (Figure S7B-H).
Using the above optimized conditions, we evaluated similar parameters in remote loading of AZ7379 into PTP liposomes. We quantified the number of peptides/ liposomes at each step using the fluorescent molecule FAM, present on the C terminal end of the PTP, and observed ~10% loss of PTP-DSPE conjugate, indicating that it was incorporated stably. The size of PTP liposomes (~110 nm) was not altered and the loss of lipid was comparable to No Pep liposomes (data not shown). While the final drug (μg) to lipid (mg) ratio was much lower compared to No Pep liposome (~80 ± 4.6 to 135 ± 2.3), it was similar to that seen in our previous study [37]. Cryo-TEM confirmed that the liposome structure was not altered (Figure S8). Lastly, we evaluated AZ7379 retention under physiologic conditions by measuring the release of AZ7379 at 37 °C over a 72 h period either in saline or 50% fetal bovine serum (FBS). AZ7379 was released to a much greater extent in saline (60% compared to 20% in FBS) (Figure S9B), suggesting that both liposomal AZ7379 formulations (No Pep and PTP) would be stable in the blood. These results also suggest that having a peptide-lipid construct in the liposomal formulation does not interfere with the retention of AZ7379.
Figure 4
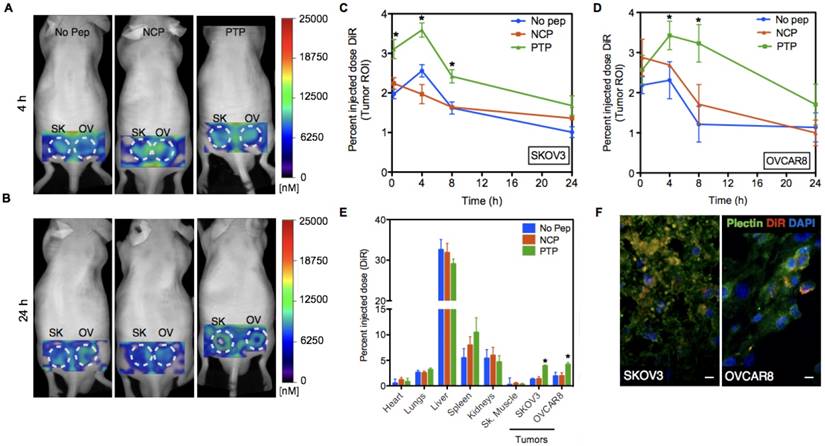
PTP liposomes accumulate in OVCAR8 tumors to a greater extent than SKOV3. (A) In vivo images of mice bearing SKOV3 and OVCAR8 tumors injected with No Peptide (No Pep), Negative Control Peptide (NCP) and PTP liposomes (t=4 h). (B) The same animals were imaged at 24 h post-injection. (C-D) Graphs showing pharmacokinetics (percent injected dose of DiR) of three liposomes obtained using FMT imaging followed by image analysis using the tumor as the region-of-interest (ROI; white dotted circles). FMT imaging of the liposomal preparations was performed in live mice (n=6). Liposomes displaying a NCP were included to compare random vs. targeted liposome kinetics. In this instance, targeted liposome accumulation was largely consistent with the density of available cellular targets (* represents p < 0.05). (E) Biodistribution of liposomes 24 h post-injection from different organs including the tumors (* represents p < 0.05). (F) Following 24 h of in vivo imaging, tumor sections were prepared and stained for plectin followed by confocal microscopy to look at plectin and DiR colocalization. Confocal images of the tumor sections revealed DiR-labeled liposomes (red) accumulated in the plectin+ (green) SKOV3 and OVCAR8 cells (DAPI, blue; scale bar, 20 μm).
To confirm PARP inhibition, we quantified double-stranded DNA (ds-DNA) breaks by immunostaining for γ-H2AX, a biomarker for double-stranded DNA breaks. PTP AZ7379-treated OVCAR8 cells had 35% of nuclear area positive for γ-H2AX, compared to 18% for free AZ7379, and <1% for untreated cells (Figure S10A-D). PARP inhibition in OVCAR8 cells also resulted in trapping of PARP-1 on chromatin. This phenomenon was observed with both free AZ7379- and PTP AZ7379-treated OVCAR8 cells (Figure S10E).
PTP liposomal delivery of AZ7379 inhibits PARP activity and elicits anti-tumor effects
To determine the therapeutic efficacy of our AZ7379 PTP liposome formulation, we compared OVCAR8 tumor outgrowth during seven treatment regimens: 1) untreated, 2) systemic AZ7379-0.5 (0.5 μmol/kg/gavage), 3) systemic AZ7379-1 (1 μmol/kg/gavage), 4) No Pep AZ7379 (1.5 μmol/kg/injection, 0.25 mg lipid/injection), 5) NCP AZ7379 (1 μmol/kg/injection, 0.25 mg lipid/injection), 6) PTP AZ7379-0.5 (0.75 μmol/kg/injection, 0.12 mg lipid/injection), 7) PTP AZ7379-1 (1.5 μmol/kg/injection, 0.25 mg lipid/injection) (Figure 5A). Groups 1, 3, 4, 5, 7 received 3 μmol/kg and groups 2 and 6 received 1.5 μmol/kg over a 7-day period. We chose to deliver free AZ7379 via oral gavage every other day based on previous experiments that determined pharmacokinetics and optimal dosing [37]. In that study, we administered free AZ7379 at doses 1, 5 and 25 μmol/kg whtout any apparent adverse effects. As shown in Figure S4B, the blood half-life of AZ7379 in mice is 55 min when delivered orally compared to 3 min when delivered via tail vein injection. Thus oral delivery was selected to avoid rapid systemic clearance, consistent with clinical applications where PARP inhibitors are typically administered orally [12,17]. Tumor volume was measured every week out to 24 days, at which time the tumors were removed for additional analyses. Our data revealed that all liposomal formulations reduced tumor outgrowth to a greater extent than systemic drug delivery, indicating the contribution of the enhanced permeability and retention (EPR) effect to liposomal drug delivery (Figure 5B) [38-40]. Notably, we found tumors in PTP liposome-treated animals (groups 6 and 7) were significantly smaller than those in the other two liposome-treated cohorts, indicating that the presence of the PTP targeting moiety was having an effect above background liposome EPR (Figure 5C). Systemic AZ7379 at 0.5 μmol/kg was not significantly different from untreated group in terms of tumor growth (Figure 5B). But PTP AZ7379-0.5 had significantly lower final tumor volume compared to other treatment groups (2.5-fold lower compared to untreated, 2.4-fold lower compared to systemic AZ7379-0.5, 2.2-fold lower compared to systemic AZ7379-1, 1.8-fold lower compared to No Pep AZ7379 and 1.6-fold compared to NCP AZ7379) (Figure 5C). These results suggest that at lower dose of AZ7379, PTP liposomes had much greater anti-tumor effect compared to systemic AZ7379 delivery. Similarly, PTP AZ7379-1 had significantly lower final tumor volume compared to other treatment groups (2.9-fold lower compared to untreated, 2.7-fold lower compared to systemic AZ7379-0.5, 2.5-fold lower compared to systemic AZ7379-1, 2-fold lower compared to No Pep AZ7379 and 1.8-fold compared to NCP AZ7379) (Figure 5C). The body weights of the mice were similar across the untreated and all treated groups, indicating that there were no systemic adverse effects of drug delivery (Figure S11). Additionally, similar in vivo experiments conducted in mice bearing SKOV3 tumors (WT BRCA1/2) were resistant to the effects of AZ7379 on tumor growth, indicating that BRCA1/2 status was a determining factor in therapeutic efficacy (Figure S12).
Figure 5
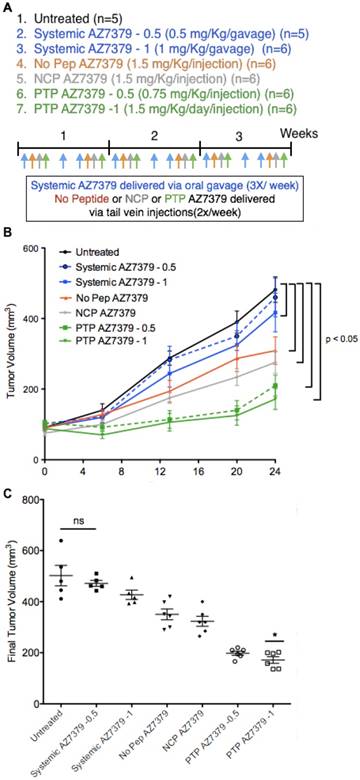
PARP inhibition in OVCAR8 tumors following AZ7379 delivery. (A) Experimental design for measuring PD following AZ7379 delivery. There were 7 groups - 1. Untreated (n=5), 2. Systemic AZ7379-0.5 (n=5), 3. Systemic AZ7379-1 (n=5), 4. No Peptide liposomes AZ7379 (No Pep AZ7379) (n=6), 5. NCP liposomes AZ7379 (n=6), 6. PTP liposomes AZ7379-0.5 (n=5), 7. PTP liposomes AZ7379-1 (n=6). Systemic AZ7379 was delivered three times a week by oral gavage and liposomal groups were delivered twice a week via tail vein injections. (B) Tumor volume (mm3) was measured every week following treatment and plotted over time to determine the efficacy of each treatment group. (C) Final tumor volume from all the 7 groups indicates significantly lower tumor volumes with PTP liposomes-0.5,-1 (* represents p < 0.05, n.s- non-significant).
As a further indicator of pharmacodynamics, we measured the extent of PARP inhibition as a surrogate for the delivery of AZ7379 to the tumor. During the DNA repair process, the C-terminus catalytic domain of PARP hydrolyzes NAD+ and attaches poly(ADP-ribose) (PAR) polymers covalently to proteins. Therefore, PARP activity in tumor cells can be quantified by measuring PAR levels. The PAR+ area in the tumor, as determined by immunofluorescence staining intensity, was 3.6-fold lower in PTP AZ7379-1 compared to untreated controls (group 1), 3.4-fold lower compared to systemic AZ7379-0.5 (group 2), 2.8-fold lower compared to systemic AZ7379-1 (group 3), 2.3-fold lower compared to No Pep/NCP liposomes (groups 4 and 5), and 1.4-fold lower compared to PTP AZ7379-0.5 (group 6) (Figure S13A-B). Similarly, immunoblot detection of PAR in tumor lysate preparations showed PTP AZ7379-1 resulted in a 24-fold lower PAR/actin ratio compared to untreated animals (group 1), 21-fold lower compared to systemic AZ7379-0.5 (group 2), 17-fold lower compared to systemic AZ7379-1 (group 3), 12 -fold lower compared to No Pep/NCP liposomes (Figure S13D-E) (groups 4 and 5), and 3-fold lower compared to PTP AZ7379-0.5 (group 6). Additionally, tumor volumes displayed strong correlation with PAR expression as determined by immunofluorescence (r2=0.93, P=0.0004) and immunoblot (r2=0.97, P=0.0001) (Figure S13C, F).
Intraperitoneal injections of ovarian tumor cells into nude mice in many aspects resemble late stage ovarian cancer where extensive peritoneal dissemination and the development of ascites is observed. To assess the efficacy and toxicity of PTP liposomes under these conditions, OVCAR8 that express iRFP720 (~ 1 x 10⁶ cells) were injected into the peritoneal cavity and imaged via FMT one week post injection for tumor growth. Mice were maintained on non-fluorescent diet from 10 days prior to OVCAR8 cell injection to the end of the treatment period. There was no significant background fluorescence (~500 - 1000 pmol of iRFP) observed in mice after 10 days on non-fluoresccent diet or right before OVCAR8 cell injection (Figure S14). Similar results were obtained in our previous experiments with no background fluorescence in mice maintained on non-fluorescent diet for 7-10 days. A second FMT imaging was performed on day 7 post OVCAR8 cell injection and the mice were randomized into four treatment groups (n=6 mice/group): 1) untreated control, 2) systemic AZ7379, 3) No Pep AZ7379, and 4) PTP AZ7379 (Figure 6B). Systemic AZ7379 was performed 3 times a week via oral gavage and liposomes (No Pep and PTP) were delivered via tail vein injections 2 times a week. The total amount of drug given per week across all delivery platforms was kept constant. Mice were imaged twice a week using FMT and tumor growth for all groups was plotted over time (Figure 6A, C). PTP liposomes-treated animals had delayed tumor growth compared to other treatment groups with a final tumor volume that was 2-fold lower compared to untreated control group (455,581 vs. 211,884 pmol iRFP), 1.7-fold lower compared to systemic AZ7379-treated group (375,894 vs. 211,884 pmol iRFP) and 1.6-fold lower compared to No Pep AZ7379-treated group (331,821 vs. 211,884 pmol iRFP) (Figure 6C and Figure S15B). The body weights of the mice were similar across the untreated and all treated groups, indicating that there were no systemic adverse effects of drug delivery (Figure S15A). Upon necropsy, organs were removed and scanned to determine the presence of iRFP OVCAR8 cells (Figure 6D). We observed that major tumor mass was associated with the omentum followed by other organs including liver, diaphragm, intestine, reproductive tract, pancreas, and kidneys. The amount of iRFP fluorescence associated with each organ was normalized to tissue weight and represented in Figure 6D. Tumor burden associated with omentum and diaphragm had the highest iRFP fluorescence per gram tissue compared to other tissues (Figure 6D). Tumors were homogenized and lysed and the amount of PAR in the tumor was assessed by Western blot analysis (Figure 6E). PTP liposomal delivery of AZ7379 resulted in a 2.4-fold lower PAR/actin ratio compared to untreated animals (group 1), 1.9-fold lower compared to systemic AZ7379 (group 2) and 1.6-fold lower compared to No Pep liposomes (Figure 6E-F).
PTP liposomal delivery of AZ7379 resulted in 1.7-fold fewer tumor nodules compared to untreated animals (group 1), 1.6-fold fewer compared to systemic AZ7379 (group 2) and 1.4-fold lower compared to No Pep liposomes (Figure S15C). In order to detect any potential drug toxicity, blood was collected at the end of the treatment period and liver function was evaluated by measuring serum levels of alanine aminotransferase (ALT) and aspartate aminotransferase (AST). There was no significant difference in the serum levels of ALT (42-48 mUnits/mL) or AST (46-54 mUnits/mL) among the treatment groups (Figure S15D-E). We also performed flow cytometry analysis on blood cells to determine total myeloid lineage cells (%CD11b+ of the CD45+ population) (Figure S16), cells that comprise the neutrophils/ granulocyte subset of myeloid-derived suppressor cells (MDSCs) (Ly6G+ population of CD45+CD11b+ cells) (Figure S17), and monocytes (LY6C+ and Ly6C- populations of CD45+CD11b+Ly6G- cells). We observed that there was no significant difference in total percentage of myeloid cells among the 4 groups (Figure S16A). Similarly, there was no difference in the percentage of Ly6G+ myeloid cells and monocytes (Figure S16B). This indicates that PARP inhibition with free or liposomal AZ7379 at 3 μmol/kg/week over the three-week treatment period did not alter myeloid cell populations in the blood.
Taken together, these results indicate that PTP liposomes-mediated delivery of the PARP inhibitor AZ7379 provides a superior platform for drug delivery compared to systemic and No Pep liposome delivery. We demonstrated two important outcomes: first, that PARP inhibition in the tumor was enhanced with our PTP liposomes, and second, that tumor volume was reduced in these mice compared to other groups. More broadly, these results strengthen the concept that targeted liposomal delivery can reduce the frequency of therapeutic dosing while at the same time increase the efficacy of the PARP inhibition.
Figure 6
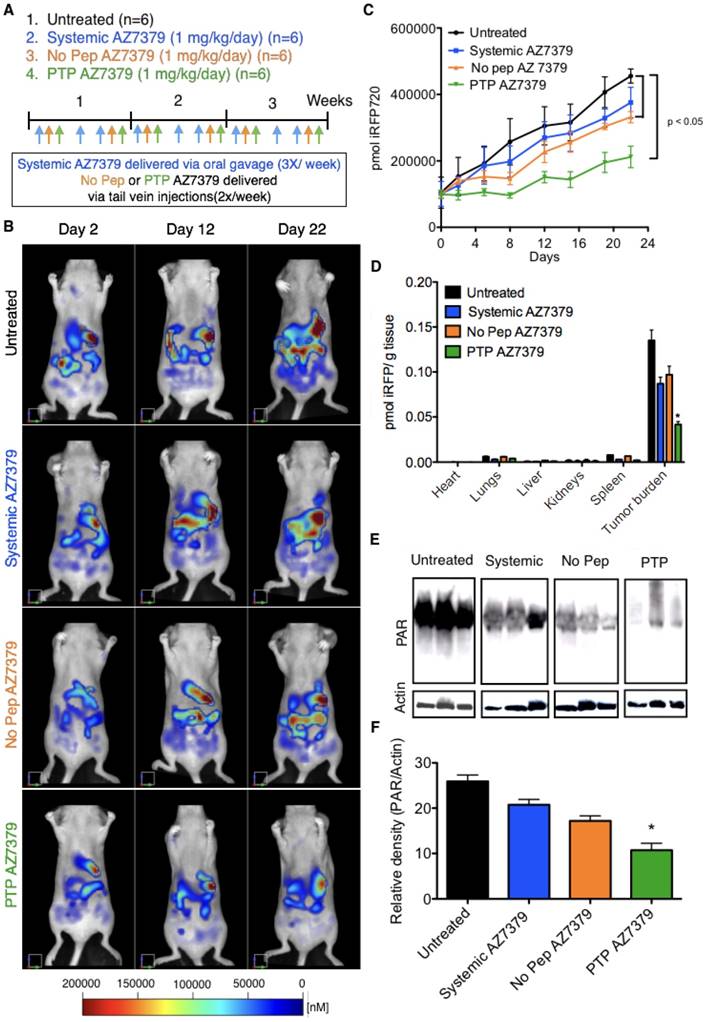
PTP liposomes delay tumor growth of OVCAR8 cells expressing iRFP. (A) Experimental design for measuring PD following AZ7379 delivery. There were 4 groups: 1) untreated (n=6), 2) systemic AZ7379 (n=6), 3) No Pep AZ7379 (n=6), 4) PTP liposomes AZ7379 (n=6). Systemic AZ7379 was delivered three times a week by oral gavage and liposomal groups 3 and 4 were delivered twice a week via tail vein injections. (B) FMT images of mice from different treatment groups at days 2, 12, and 22 after treatment. (C) Tumor volume was measured every week following treatment by imaging the mice via FMT and plotted over time to determine the efficacy of each treatment (p< 0.05). (D) Ex vivo FMT images of organs after 3 weeks of treatment. iRFP fluorescence was normalized to the weight of the organs and represented as pmol of iRFP per g tissue. Tumor burden included tumor isolated from the omentum and diaphragm, which were the majors regions where tumor mass was observed. (E) PAR and actin were quantified from tumor lysates by Western blot. The Western blot images represent lysates from 3 animals of each group chosen randomly from this study. (F) PAR expression was normalized to actin expression in the same lysates/ blot (* represents p< 0.05).
Discussion
Our current work using a PTP liposomal AZ7379 formulation provides evidence that the individual powers of pharmacogenomics and oncoproteomics can be magnified when combined. Our methodology involved using pharmacogenomics data to select our model, BRCA1/2-deficient OVCAR8 cells, and the PARP inhibitor, AZ7379, that we utilized in the study. We then systematically defined the critical oncoproteomic elements—that plectin is highly expressed in more advanced human ovarian cancer and that it is expressed on the cell surface. When combined with oncoproteomic data from our previous work demonstrating that the PTP peptide specifically targets cell surface plectin, we thus had a foundation upon which to test our hypothesis: that targeted liposomes encapsulating a PARP inhibitor would increase drug delivery to the tumor. As a final component, we developed and optimized a protocol to generate liposomes that showed little loss of initial lipid content, were uniform in size, retained drug at a dose that was therapeutically effective, maintained structural integrity, and were stable under physiological conditions. Following this approach, we demonstrated that AZ7379 encapsulated in PTP liposomes increased PARP inhibition in OVCAR8 tumors (subcutaneous and intraperitoneal) over No Pep/NCP liposomes, and that tumor growth was reduced under these conditions. The long-term use of PARP inhibitors can lead to resistance, often attributed to changes in the DNA damage response mediated by secondary mutations in BRCA genes or changes in cellular response to PARP inhibitors like altered ATP-binding cassette (ABC) transporters that reduce the efficacy of PARP-1 inhibitors [41,42]. Others have shown that NF-κB inhibitors were effective in overcoming PARP-1 inhibitor resistance [43]. To effectively overcome PARP inhibitor resistance, combination or sequential therapies of liposomal formulations of PARP inhibitor and other drugs will be needed.
Most promising is that we now have an adaptable therapeutic platform, incorporating pharmacogenomics, oncoproteomics, and liposome-mediated delivery. Optimization of each component in relation to the others is essential for success. A critical feature of our method and the goal of any therapeutic is cell-specific delivery. Relating this to our study, the development of PARP inhibitors to treat cancers with BRCA-like mutations displays the strengths of the pharmacogenomics, while the adverse effects in healthy organs following clinical application displays its weaknesses. The most concerning adverse effects associated with PARP inhibition are myelodysplastic syndrome and acute myeloid leukemia. Under these conditions, the patients are unable to replenish blood cells, to the point of death in some cases. Although liposomes accumulate in the liver, in vivo toxicity studies suggested that liposomal AZ7379 did not cause measurable liver damage as seen from unaltered serum ALT, AST levels.
Furthermore, the PTP AZ7379 formulation could potentially be used to enhance efficacy in other cancer types that harbor cell surface plectin/BRCA-deficient cancer cells, including several head and neck squamous cell carcinomas (HNSCC) and pancreatic cancer. In a recently concluded clinical study, Rucaparib (PARP inhibitor) showed benefit in 36% of pancreatic cancer patients [44,45]. In HNSCC, BRCA1/2 and BRCA-like mutations contribute to >10% of cases [46-49]. Even without targeting, No Pep liposomal AZ7379 formulations like those described here can be used to effectively treat BRCA-like mutations that contribute to ~13% of all tumors [49]. Thus, a liposomal formulation incorporating a PARP inhibitor holds promise for a number of cancer treatment strategies.
Additionally, this platform can be expanded to deliver chemotherapeutic drugs at prescribed stages of cancer treatment either as a mono or combinatorial therapy. For example, the presence of plectin can be exploited to deliver liposomes encapsulated with carboplatin or doxorubicin, among other frontline drugs. The chemical properties of all potential drugs would need to be considered on a case-by-case basis alongside liposome preparation. Remote loading was chosen as the method for encapsulating PARP inhibitors (Olaparib, AZ7379, AZ3598, and AZ9594) as it is a highly efficient and simple procedure. Due to the low solubiliuty of Olaparib, AZ3598, and AZ9594 in buffers tested for remote loading combined with low loading efficiencies, we had to move on with AZ7379 as it had greater than 60% loading efficiencies. Computational modeling and various experimental methods have already been explored that optimize remote loading techniques with the properties of any given drug [50-52]. The clinical applicability of any liposomal formulation depends on the stability upon long-term storage and in vivo following administration. In our case, storage of PTP liposomes at 4 °C for 3 months resulted in only a loss of 10% AZ7379 (data not shown) and the loss occurred during the first 24 h upon storage. The anti-tumor effects seen in our studies confirm the in vivo stability of PTP liposomes, and they also indicate successful uptake of liposomes by cell surface plectin+ OVCAR8 cells followed by release of AZ7379 and inhibition of PARP. The current AZ7379 formulation can be further optimized by minimizing the loss of lipids during the remote loading process, which can likely be addressed through identification of the right packing material for size exclusion chromatography. Even with the loss of lipid during the size exclusion process, we were able to achieve a loading of 80 µg of AZ7379 per mg of lipid for peptide-conjugated liposomes. Although this is lower than what has been previously reported for doxorubicin in unlabeled liposomes (200 μg drug per mg of lipid) [40], it does highlight the therapeutic strength of our formulation, as we were able to achieve PARP inhibition and reduced tumor growth at these levels. Similar technical advacnes will increase the arsenal of effective solutions, as the repertoire of suitable drugs for targeted liposomal-mediated drug delivery expands.
Conclusions
This work serves as a model system for developing effective anti-tumor therapies against cancer with specific genetic and protein expression profiles. Given that this approach is based on the integration of pharmacogenomics and oncoproteomic information, we predict that these two rapidly expanding and clinically accepted fields will unveil a new field of diseases that can be treated more efficaciously with reduced deleterious side effects to the patients. Targeted drug delivery thus serves as a bridge between the -omics technologies, which can further streamline precision cancer medicine.
Abbreviations
AUC: area under the curve, DiR: 1,1'-dioctadecyl-3, 3, 3', 3'-tetramethylindotricarbocyanine iodide, FAM: 5(6)-carboxyfluorescein, FMT: fluorescence molecular tomography, PAR: poly(ADP-ribose), PARP: poly(ADP-ribose) polymerase, PD: pharmacodynamics, PK: pharmacokinetics, ROI: region of interest.
Supplementary Material
Supplementary figures.
Acknowledgements
This work was supported in part by grants from the: AstraZeneca/UVA Strategic Alliance (to K.A.K & A.L.K) and NIH/NCI (to K.A.K) (R01CA168712). The authors would also like to thank Dr. Kelly Dryden in the UVA Molecular Electron Microscopy Core facility, which is significantly supported by the School of Medicine, for her help in performing cryoTEM of liposomes. We also would like to thank Craig Rumpel in the UVA Biorepository and Tissue Research Facility (BTRF) for his help in obtaining ovarian TMA. We also would like to thank Dr. Patcharin Pramoonjago in the UVA Biorepository and Tissue Research Facility (BTRF) for her help with plectin IHC staining. The authors would also like to thank Dr. Lindsey T. Brinton for her help with MATLAB code to determine AUC of liposomes in tumors. PARP inhibitor, AZ7379 and its physicochemical properties including pharmacokinetic data was kindly provided by Erik Michaelsson, Cardiovascular and Metabolic Diseases, IMED Biotech Unit, AstraZeneca, Gothenburg, Sweden.
Competing Interests
The authors have declared that no competing interest exists.
References
1. Hofree M, Shen JP, Carter H, Gross A, Ideker T. Network-based stratification of tumor mutations. Nat Methods. 2013;10(11):1108-15
2. Cho WC. Contribution of oncoproteomics to cancer biomarker discovery. Mol Cancer. 2007;6:25
3. Meani F, Pecorelli S, Liotta L, Petricoin EF. Clinical application of proteomics in ovarian cancer prevention and treatment. Mol Diagn Ther. 2009;13(5):297-311
4. Kelly KA, Bardeesy N, Anbazhagan R, Gurumurthy S, Berger J, Alencar H. et al. Targeted nanoparticles for imaging incipient pancreatic ductal adenocarcinoma. PLoS Med. 2008;5(4):e85
5. Bausch D, Thomas S, Mino-Kenudson M, Castillo CF, Bauer TW, Williams M. et al. Plectin-1 as a novel biomarker for pancreatic cancer. Clin Cancer Res. 2011;17(2):302-9
6. Reynolds F, Panneer N, Tutino CM, Wu M, Skrabal WR, Moskaluk C. et al. A functional proteomic method for biomarker discovery. PloS One. 2011;6(7):e22471
7. Tutt A, Ashworth A. The relationship between the roles of BRCA genes in DNA repair and cancer predisposition. Trends Mol Med. 2002;8(12):571-6
8. Cancer Genome Atlas Research Network. Integrated Genomic Analyses of Ovarian Carcinoma. Nature. 2011;474(7353):609-15
9. Bolton KL, Chenevix-Trench G, Goh C, Sadetzki S, Ramus SJ, Karlan BY. et al. Association between BRCA1 and BRCA2 mutations and survival in women with invasive epithelial ovarian cancer. JAMA. 2012;307(4):382-90
10. Konecny GE, Wang C, Hamidi H, Winterhoff B, Kalli KR, Dering J. et al. Prognostic and therapeutic relevance of molecular subtypes in high-grade serous ovarian cancer. J Natl Cancer Inst. 2014;106(10):dju249
11. Balmaña J, Domchek SM, Tutt A, Garber JE. Stumbling blocks on the path to personalized medicine in breast cancer: the case of PARP inhibitors for BRCA1/2-associated cancers. Cancer Discov. 2011;1(1):29-34
12. Ledermann J, Harter P, Gourley C, Friedlander M, Vergote I, Rustin G. et al. Olaparib maintenance therapy in patients with platinum-sensitive relapsed serous ovarian cancer: a preplanned retrospective analysis of outcomes by BRCA status in a randomized phase 2 trial. Lancet Oncol. 2014;15(8):852-61
13. https://www.fda.gov/newsevents/newsroom/comunicadosdeprensa/ucm427584.htm
14. Approved Drugs - Rucaparib. https://www.fda.gov/Drugs/InformationOnDrugs/ApprovedDrugs/ucm533891.htm
15. Approved Drugs - Niraparib (ZEJULA). https://www.fda.gov/Drugs/InformationOnDrugs/ApprovedDrugs/ucm548487.htm
16. Kristeleit R, Shapira-Frommer R, Burris H, Patel MR, Lorusso PM, Oza AM. et al. 882PDphase 1/2 study of oral rucaparib: updated phase I and preliminary phase 2 results. Ann Oncol. 2014;25(suppl 4):307-8
17. Kristeleit RS, Burris HA, LoRusso P, Patel MR, Asghar US, El-Khouly F. et al. Phase 1/2 study of oral rucaparib: Final phase 1 results. J Clin Oncol. 2014;32(suppl 15):2573-2573
18. Kristeleit R, Shapiro GI, Burris HA, Oza AM, LoRusso P, Patel MR. et al. A Phase I-II Study of the Oral PARP Inhibitor Rucaparib in Patients with Germline BRCA1/2-Mutated Ovarian Carcinoma or Other Solid Tumors. Clin Cancer Res. 2017;23(15):4095-106
19. Shapiro G, Kristeleit R, Middleton M, Burris H, Molife LR, Evans J. et al. Pharmacokinetics of orally administered rucaparib in patients with advanced solid tumors. Mol Cancer Ther. 2013;12:A218-A218
20. Ricks TK, Chiu HJ, Ison G, Kim G, McKee AE, Kluetz P. et al. Successes and Challenges of PARP Inhibitors in Cancer Therapy. Front Oncol. 2015;5:222
21. Allen TM, Cullis PR. Liposomal drug delivery systems: From concept to clinical applications. Adv Drug Deliv Rev. 2013;65(1):36-48
22. Song G, Wu H, Yoshino K, Zamboni WC. Factors affecting the pharmacokinetics and pharmacodynamics of liposomal drugs. J Liposome Res. 2012;22(3):177-92
23. Torchilin VP. Recent advances with liposomes as pharmaceutical carriers. Nat Rev Drug Discov. 2005;4(2):145-60
24. Çağdaş M, Sezer AD, Bucak S. Liposomes as Potential Drug Carrier Systems for Drug Delivery. London UK: IntechOpen publishers. 2014
25. Caster JM, Sethi M, Kowalczyk S, Wang E, Tian X, Nabeel Hyder S. et al. Nanoparticle delivery of chemosensitizers improve chemotherapy efficacy without incurring additional toxicity. Nanoscale. 2015Feb14;7(6):2805-11
26. van de Ven AL, Tangutoori S, Baldwin P, Qiao J, Gharagouzloo C, Seitzer N. et al. Nanoformulation of Olaparib Amplifies PARP Inhibition and Sensitizes PTEN/TP53- Deficient Prostate Cancer to Radiation. Mol Cancer Ther. 2017;16(7):1279-89
27. Chang DK, Li PC, Lu RM, Jane WN, Wu HC. Peptide-mediated liposomal Doxorubicin enhances drug delivery efficiency and therapeutic efficacy in animal models. PLoS One. 2013;8(12):e83239
28. Wu CH, Kuo YH, Hong RL, Wu HC. α-Enolase-binding peptide enhances drug delivery efficiency and therapeutic efficacy against colorectal cancer. Sci Transl Med. 2015;7(290):290ra91
29. Dasa S, Suzuki R, Mugler E, Chen L, Jansson-Löfmark R, Michaëlsson E. et al. Evaluation of Pharmacokinetic and Pharmacodynamic Profiles of Liposomes for the Cell Type-Specific Delivery of Small Molecule Drugs. Nanomedicine. 2017;13(8):2565-2574
30. King A, Ndifon C, Lui S, Widdows K, Kotamraju VR, Agemy L. et al. Tumor-homing peptides as tools for targeted delivery of payloads to the placenta. Sci Adv. 2016;2(5):e1600349
31. Fosgerau K, Hoffmann T. Peptide therapeutics: current status and future directions. Drug Discov Today. 2015;20(1):122-8
32. Uhlig T, Kyprianou T, Martinelli FG, Oppici CA, Heiligers D, Hills D. et al. The emergence of peptides in the pharmaceutical business: From exploration to exploitation. EuPA Open Proteomics. 2014;4:58-69
33. Konkalmatt PR, Deng D, Thomas S, Wu MT, Logsdon CD, French BA. et al. Plectin-1 Targeted AAV Vector for the Molecular Imaging of Pancreatic Cancer. Front Oncol. 2013;3:84
34. Leung K. (111) In-Tetrameric Plectin-1 targeting peptide (4(βAKTLLPTP-GGS(PEG5000)) KKK-(111) In-DOTA-βA-NH2). http://www.ncbi.nlm.nih.gov/books/NBK54202/
35. Jazaeri AA, Bryant JL, Park H, Li H, Dahiya N, Stoler MH. et al. Molecular Requirements for Transformation of Fallopian Tube Epithelial Cells into Serous Carcinoma. Neoplasia. 2011;13(10):899-911
36. Vasquez KO, Casavant C, Peterson JD. Quantitative whole body biodistribution of fluorescent-labeled agents by non-invasive tomographic imaging. PLoS One. 2011;6(6):e20594
37. Dasa S, Suzuki R, Gutknecht M, Brinton LT, Tian Y, Michaelsson E. et al. Development of target-specific liposomes for delivering small molecule drugs after reperfused myocardial infarction. J Control Release. 2015;220(Pt A):556-67
38. Noble GT, Stefanick JF, Ashley JD, Kiziltepe T, Bilgicer B. Ligand-targeted liposome design: challenges and fundamental considerations. Trends Biotechnol. 2014;32(1):32-45
39. Nichols JW, Bae YH. EPR: Evidence and fallacy. J Control Release. 2014;190:451-64
40. Barenholz Y. Doxil®-the first FDA-approved nano-drug: lessons learned. J Control Release. 2012;160(2):117-34
41. Lord CJ, Ashworth A. Mechanisms of resistance to therapies targeting BRCA-mutant cancers. Nat Med. 2013Nov;19(11):1381-8
42. Yalon M, Tuval-Kochen L, Castel D, Moshe I, Mazal I, Cohen O. et al. Overcoming Resistance of Cancer Cells to PARP-1 Inhibitors with Three Different Drug Combinations. PLoS One. 2016May19;11(5):e0155711
43. Nakagawa Y, Sedukhina AS, Okamoto N, Nagasawa S, Suzuki N, Ohta T. et al. NF-κB signaling mediates acquired resistance after PARP inhibition. Oncotarget. 2015Feb28;6(6):3825-39
44. Domchek SM, Hendifar AE, McWilliams RR, Geva R, Epelbaum R, Biankin A. et al. RUCAPANC: An open-label, phase 2 trial of the PARP inhibitor rucaparib in patients (pts) with pancreatic cancer (PC) and a known deleterious germline or somatic BRCA mutation. J Clin Oncol. 2016;34(suppl 15):4110
45. Syed YY. Rucaparib: First Global Approval. Drugs. 2017Apr;77(5):585-92
46. Feldman R, Gatalica Z, Knezetic J, Reddy S, Nathan C-A, Javadi N. et al. Molecular profiling of head and neck squamous cell carcinoma. Head Neck. 2016;38(S1):E1625-38
47. Heitmann J, Geeleher P, Zuo Z, Weichselbaum RR, Vokes EE, Fetscher S. et al. Poly (ADP-ribose) polymerase inhibitor efficacy in head and neck cancer. Oral Oncol. 2014;50(9):825-31
48. Heeke A, baker T, Lynce F, Pishvaian M. Meeting Library | Prevalence of Homologous Recombination Deficiency (HRD) Among All Tumor Types. J Clin Oncol. 2017;35(Suppl 15):1502
49. Cern A, Marcus D, Tropsha A, Barenholz Y, Goldblum A. New drug candidates for liposomal delivery identified by computer modeling of liposomes' remote loading and leakage. J Control Release. 2017;252:18-27
50. Zucker D, Marcus D, Barenholz Y, Goldblum A. Liposome drugs' loading efficiency: a working model based on loading conditions and drug's physicochemical properties. J Control Release. 2009;139(1):73-80
51. Barenholz Y. Amphipathic Weak Base Loading into Preformed Liposomes Having a Transmembrane Ammonium Ion Gradient. In: (ed.) Gregoriadis G. Liposome Technology, Volume II. Entrapment of drugs and other materials into liposomes, third edition. Boca Raton, USA: CRC press. 2006:1-25
52. Szoka F, Papahadjopoulos D. Procedure for preparation of liposomes with large internal aqueous space and high capture by reverse-phase evaporation. Proc Natl Acad Sci U S A. 1978;75(9):4194-8
Author contact
![]() Corresponding author: Siva Sai Krishna Dasa, Ph.D. Instructor, 415 Lane Road, Department of Biomedical Engineering, University of Virginia, Charlottesville, VA, United States. 22908. Email: sd7nfedu, phone: 434-243-9434.
Corresponding author: Siva Sai Krishna Dasa, Ph.D. Instructor, 415 Lane Road, Department of Biomedical Engineering, University of Virginia, Charlottesville, VA, United States. 22908. Email: sd7nfedu, phone: 434-243-9434.
Citation styles
APA
Dasa, S.S.K., Diakova, G., Suzuki, R., Mills, A.M., Gutknecht, M.F., Klibanov, A.L., Slack-Davis, J.K., Kelly, K.A. (2018). Plectin-targeted liposomes enhance the therapeutic efficacy of a PARP inhibitor in the treatment of ovarian cancer. Theranostics, 8(10), 2782-2798. https://doi.org/10.7150/thno.23050.
ACS
Dasa, S.S.K.; Diakova, G.; Suzuki, R.; Mills, A.M.; Gutknecht, M.F.; Klibanov, A.L.; Slack-Davis, J.K.; Kelly, K.A. Plectin-targeted liposomes enhance the therapeutic efficacy of a PARP inhibitor in the treatment of ovarian cancer. Theranostics 2018, 8 (10), 2782-2798. DOI: 10.7150/thno.23050.
NLM
Dasa SSK, Diakova G, Suzuki R, Mills AM, Gutknecht MF, Klibanov AL, Slack-Davis JK, Kelly KA. Plectin-targeted liposomes enhance the therapeutic efficacy of a PARP inhibitor in the treatment of ovarian cancer. Theranostics 2018; 8(10):2782-2798. doi:10.7150/thno.23050. https://www.thno.org/v08p2782.htm
CSE
Dasa SSK, Diakova G, Suzuki R, Mills AM, Gutknecht MF, Klibanov AL, Slack-Davis JK, Kelly KA. 2018. Plectin-targeted liposomes enhance the therapeutic efficacy of a PARP inhibitor in the treatment of ovarian cancer. Theranostics. 8(10):2782-2798.
This is an open access article distributed under the terms of the Creative Commons Attribution (CC BY-NC) license (https://creativecommons.org/licenses/by-nc/4.0/). See http://ivyspring.com/terms for full terms and conditions.