Impact Factor
- Issue 12; 2026
- Issue 11; 2026
- Issue 10; 2026
- Issue 9; 2026
- Issue 8; 2026
- Volume 16; 2026
- Advance Articles
- Past Issues
- Cover Images
- Cover Suggestion
- Index & Coverage
- Special Issues
Introduction
Material and Methods
Results
Discussion
Abbreviations
Acknowledgements
Supplementary Material
References
International Journal of Biological Sciences
International Journal of Medical Sciences
 Global reach, higher impact

Theranostics 2018; 8(8):2117-2133. doi:10.7150/thno.22610 This issue Cite
Research Paper
3D Imaging and Quantitative Analysis of Vascular Networks: A Comparison of Ultramicroscopy and Micro-Computed Tomography
Jeremy Epah1, Katalin Pálfi1, Franziska Luise Dienst1, Pedro Felipe Malacarne1, Rolf Bremer2, Michael Salamon3, Sandeep Kumar4, Hanjoong Jo4, Christoph Schürmann1,5, ![]() , Ralf Peter Brandes1,5
, Ralf Peter Brandes1,5 ![]()
1. Institut für Kardiovaskuläre Physiologie, Fachbereich Medizin der Goethe-Universität, Theodor-Stern-Kai 7, D-60590 Frankfurt am Main, Germany
2. HBB Datenkommunikation & Abrechnungssysteme, Hannover, Germany
3. Fraunhofer-Institut für Integrierte Schaltungen IIS, Fürth, Germany
4. Wallace H. Coulter Department of Biomedical Engineering, Georgia Institute of Technology and Emory University, Atlanta, Georgia, United States of America
5. German Center for Cardiovascular Research (DZHK), Partner site RheinMain, Frankfurt, Germany
Received 2017-8-30; Accepted 2018-1-30; Published 2018-3-7
Abstract

Rationale: Classic histology is the gold standard for vascular network imaging and analysis. The method however is laborious and prone to artefacts. Here, the suitability of ultramicroscopy (UM) and micro-computed tomography (CT) was studied to establish potential alternatives to histology.
Methods: The vasculature of murine organs (kidney, heart and atherosclerotic carotid arteries) was visualized using conventional 2D microscopy, 3D light sheet ultramicroscopy (UM) and micro-CT. Moreover, spheroid-based human endothelial cell vessel formation in mice was quantified. Fluorescently labeled Isolectin GS-IB4 A647 was used for in vivo labeling of vasculature for UM analysis, and analyses were performed ex vivo after sample preparation. For CT imaging, animals were perfused postmortem with radiopaque contrast agent.
Results: Using UM imaging, 3D vascular network information could be obtained in samples of animals receiving in vivo injection of the fluorescently labeled Isolectin GS-IB4. Resolution was sufficient to measure single endothelial cell integration into capillaries in the spheroid-based matrigel plug assay. Because of the selective staining of the endothelium, imaging of larger vessels yielded less favorable results. Using micro-CT or even nano-CT, imaging of capillaries was impossible due to insufficient X-ray absorption and thus insufficient signal-to-noise ratio. Identification of lumen in murine arteries using micro-CT was in contrast superior to UM.
Conclusion: UM and micro-CT are two complementary techniques. Whereas UM is ideal for imaging and especially quantifying capillary networks and arterioles, larger vascular structures are easier and faster to quantify and visualize using micro-CT. 3D information of both techniques is superior to 2D histology. UM and micro-CT together may open a new field of clinical pathology diagnosis.
Keywords: Ultra microscopy, Light sheet fluorescence microscopy, Micro-CT
Introduction
The qualitative and quantitative evaluation of preexisting vascular networks or remodeling processes due to neovascularization or angiogenesis are important tasks in preclinical animal studies. The spatial resolution of in vivo vascular imaging techniques like magnetic resonance imaging (MRI), positron electron tomography (PET) and X-ray computed tomography (CT) is not sufficient to visualize neovascularization or angiogenesis of small capillaries [1]. Intravital confocal laser scanning microscopy provides the required spatial resolution (500 nm) but the penetration depth into tissue is limited to 500 µm and the field-of-view is small. These aspects are also true for multi-photon microscopy [2].
Currently, histology is the gold standard to quantify capillary vascular networks, but serial sectioning and histological two-dimensional (2D) analysis is time consuming and possibilities to re-construct 3D image information are very limited. Post mortem light sheet ultramicroscopy (UM) may overcome these limitations and has successfully been used in fields of neuroscience, tumor analysis [3] and embryonic development. UM uses a plane illumination of the sample and detects the fluorescence perpendicular to the illumination axis. The removal of water from the tissue and replacing it with liquids, which have the same refractive index as the sample/tissue, is necessary to enable the penetration of the specimen by laser light and to prevent scattering of the light sheet [4]. Commonly used optical clearing methods for ultramicroscopy are: three-dimensional imaging of solvent-cleared organs (3DISCO) [4], immunostaining 3DISCO (iDISCO+) [5], ultimate 3DISCO (uDISCO) [6], benzyl alcohol, benzyl benzoate (BABB) [7], ethyl cinnamate (ECi) [8] or clear, unobstructed brain/body imaging cocktails and computational analysis (CUBIC) [9]. UM has a pixel size up to 0.51 × 0.51 μm2 and generates 2D image stacks that are used to generate three dimensional (3D) datasets to visualize anatomical and morphological structures [10].
Volumetric-computed tomography in combination with blood pool contrast agents has been used for decades to visualize the vascular system [11,12]. Depending on the organ of interest, scientists have to adjust the x-ray dose, compensate for movement artifacts or perform ex vivo scans. For postmortem CT imaging, numerous contrast agents are available. Most ex vivo studies use the polymerizing contrast agent MicroFil, which has an ideal viscosity for perfusion of the smallest capillaries under external perfusion pressures, almost perfect curing properties, exhibits high x-ray absorbance and is retained in the vascular system [13]. For in vivo techniques, nanoparticles carrying elements with high x-ray absorbance like gold are being used [13]. Vascular retention, renal excretion and uptake by macrophages varies between the compounds.
In vitro angiogenesis in cultured cells and endothelial cell outgrowth has been analyzed using UM [14]. Moreover, several high-performance UMs have also been developed to image in vivo angiogenesis in translucent animals like zebra fish larvae expressing protein-based fluorescent molecules [15,16]. Due to the special sample requirements, in vivo UM, however, can obviously not be applied to living rodents. After tissue clearing, UM has frequently been used to image the vasculature of embryos [17] but reports on applications imaging the vascular network in whole organs of rodents are still limited [6,18,20] and largely restricted to the brain [4,17,19,21,22, 23].
One way to study angiogenesis in vivo is to determine vessel ingrowth into matrigel plugs. In the assay, the vascularization of the matrigel can be quantified using 2D histological sectioning following specific staining [24,25], expression analysis using polymerase chain reaction (PCR) for endothelial marker genes [26], determination of the hemoglobin content [25] or cytometry of the contained cells [27]. To determine the angiogenic capacity of genetically engineered human endothelial cells, the matrigel plug assay has been modified [28]. The human cells grown in spheroids are mixed into the matrigel prior to injection into immunocompromised SCID mice. In the subsequent angiogenic process the human endothelial cells are expected to incorporate into the murine vascular network. As the number of human cells is low in this assay, their unbiased quantification is basically impossible on the basis of 2D laser scanning confocal microscopy (LSM) sections. The use of UM to image this complex assay, to our knowledge, has not been carried out.
Atherosclerotic plaque development, plaque burden evaluation and plaque angiogenesis have been analyzed in humans and mouse models. Plaque angiogenesis increases plaque vulnerability and accelerates atherosclerosis [29]. As a robust model of accelerated atherosclerosis and plaque capillarization, the unilateral partial carotid ligation model in apolipoprotein E knockout (ApoE-/-) mice was developed [30]. It is not known whether these processes can be imaged using techniques beyond conventional histology.
For the present study, we set out to determine the suitability of micro-CT and UM techniques to study vascular networks in mice. Our data suggest that UM is well suited to image capillary networks, whereas CT techniques are restricted to somewhat larger vessels. Compared to histologic serial sectioning, both methods are less observer-dependent and allow study of larger samples in a quantitative manner.
Material and Methods
Animal model
All animal experiments were performed in accordance with the National Institutes of Health Guidelines on the Use of Laboratory Animals. The University Animal Care Committee and the Federal Authorities for Animal Research (Darmstadt, Germany) approved the study protocol. The study design is shown in Table 1.
Study design
| Mouse strain | C57BL/6 | C57BL/6 | C57BL/6 | C57BL/6 | SCID | ApoE-/- |
|---|---|---|---|---|---|---|
| Study, Figure | Heart, Fig. 1 | Kidney 1, Fig. 2, S3 | Kidney 2* Fig. S1-S2 | Matrigel plug Fig. 3-4, S4 | Spheroid matrigel plug Fig. 5-6, S5 | Partial c. ligation** Fig. 7-8 |
| Imaging modality | ||||||
| Micro-CT (MicroFil) | ca | vvf, # | a | cca, ####, | ||
| Nano-CT (MicroFil) | cca, vv, #### | |||||
| UM (Isolectin or aSMA) | ca, c, aSMA | vvf, g, c, aSMA, vvf, # | g, c, p, ## | c, cd, ### | c, h, vvf, bp | cca, c, vv |
| IHC (CD31, H/E) | cca, c, vv | |||||
| LSM (Isolectin or aSMA) | g, c, aSMA | c, cd, ### | c, h, vvf, bp |
Murine vascular network studies of the heart, kidney, matrigel plug, spheroid matrigel plug and atherosclerotic plaque after partial ligation of the left common carotid artery were performed. All studies analysed vascular networks in given samples. Kidney study 2 not only analysed vascular networks but also compared different tissue clearing methods for UM. If not indicated otherwise, 3DISCO was used as clearing method for UM. The following compartments were visualized or parameters extracted: aSMA: a-smooth muscle actin positive vessel; a: arteriols; bp: branching points; c: capillary diameter; ca: left coronary artery vessel diameter; cca: common carotid artery; g: glomeruli diameter; h: HUVEC amount; p: parenchyma; vvf: vascular volume fraction; vv: vasa vasora. *: clearing methods: 3DISCO, BABB, ECi or iDISCO+; **: clearing method ethanol; #: analysis of the same animal, left respectively right kidney; ##: analysis of the same animal, fourth part of the left kidney; ###: analysis of the same sample, first UM scan then LSM; ####: analysis of the same sample, first micro-CT scan then nano-CT. Micro-CT data were analyzed with Imalytics Preclinical and UM data with Imaris (Bitplane Version 7.6). CT: computed tomography; H/E: hematoxylin and eosin; IHC: Immunohistochemistry; Isolectin: Isolectin GS-IB4 A647; LSM: laser scanning confocal microscopy; UM: ultra-microscopy.
Partial left common carotid artery ligation model
ApoE-/- mice were purchased from Taconis M&B A/S (Ry, Denmark, strain B6.129P2-Apoetm1Unc N6) and bred at the local facility under standard conditions with a 12/12 h dark-light cycle and free access to chow and water. Western-type (42% of total calories from fat, 0.15% cholesterol) diet was purchased from Harlan Teklad Germany (Harlan Winkelmann, Borchen, Germany). Animals were started on the Western-type diet at the age of 10 weeks. Neo-intima formation and accelerated atherosclerosis was induced four days later using partial left common carotid artery ligation as described previously [13]. After partial ligation of the carotid arteries of ApoE-/-mice, samples were analyzed using conventional histology and using postmortem micro-CT and UM.
Matrigel plug assay
Liquid matrigel (0.5 mL; Corning, Kaiserslautern, Germany) was mixed at 4 °C with vascular endothelial growth factor (VEGF; 200 ng/mL; Peprotech, Hamburg, Germany). Matrigel and matrigel supplemented with VEGF was injected s.c. into each C57BL/6 mice. After the injection, SU5416 (10 mg/kg/day, i.p.; Tocris, Wiesbaden-Nordenstadt, Germany) was administered daily. 14 days later, the mice were analyzed as described below.
Spheroid-based matrigel plug assay
150,000 Human Umbilical Vein Endothelial Cells (HUVECs)/plug (Lonza, Basel, Switzerland) were stained with Vybrant Dil (1:200 in 1 mL Basal Medium (EBM); Thermo Fischer #V-22885). After incubation (45 min at 37°C, 5 min at 4°C) cells were washed with EBM (Lonza, Basel, Switzerland), resuspended (25 mL EGM containing 20% methocel; Sigma-Aldrich, Taufkirchen, Germany) and cultured in hanging drops (25 µL/drop). Harvesting of spheroids and injection of matrigel containing spheroids into SCID-mice (Harlan Winkelmann, Borchen, Germany) were performed as described in [28]. At day 26 after injection, the matrigels were analyzed as described below.
Micro-CT
Samples were scanned using micro-CT (Skyscan 1176, Bruker micro-CT, Kontich, Belgium) with the following settings: 50 kV, 0.5 mm aluminum filter, 500 µA source current, exposure time 875 ms, 9 µm isotopic resolution, 3 projection images per 0.3° rotation step, rotation range 360° and a field of view (FOV) covering the entire carotid artery or heart. Carotid arteries were then scanned using nano-CT (Subµ-CT Lab, Fraunhofer EZRT) with the following settings: 60 kV, 500 µA source current, 500 ms exposure time per image, 2 images every 0.3° of 360° rotation range at a voxel size of 0.7 µm.
Three-dimensional reconstruction and image analysis for CT
For micro-CT datasets, volumetric data were reconstructed with the NRecon/InstaRecon CBR Server—Premium software (Skyscan, Kontich, Belgium/InstaRecon, Champaign, Illinois, USA). Image analysis, segmentation of micro-CT data and quantification of vessel diameter were performed with the Imalytics Preclinical Software (Gremse-IT, Aachen, Germany). The lumen diameters of the left coronary arteries were measured with the virtual elastic sphere tool as described previously [13]. For high-resolution micro-CT three-dimensional reconstruction was completed using Fraunhofer Volex 6.2. The reconstruction was performed using binning mode, providing an isotropic voxel size of 1.4 µm. The image analysis was carried out with the VolumePlayer developed at Fraunhofer EZRT.
Ultramicroscopy
Samples were scanned using UM (Ultramicroscope II, LaVision BioTec, Bielefeld, Germany) with the following settings: Main laser power 95% and software laser power adjusted according to the different experimental setups. Excitation was performed at 470/40 nm and emission 525/50 nm, excitation 545/30 nm and emission 595/40 nm, or excitation 630/30 nm and emission 690/30 nm. Step size was set to 1 µm or 2 µm. Exposure time was 300 ms, 20× magnification (10× zoom body + 2× Objective). 100× magnification (50× zoom body + 2× objective) was used for matrigel and kidney. Pictures were taken with a Neo 5.5 (3-tap) sCOMs Camera (Andor, Mod. No.: DC-152q-C00-FI). ImSpectorPro Version 5.0.110.
Image analysis for UM
3D Images and quantification were completed with Imaris (Bitplane Version 7.6). See additional methods in Supplementary Material).
Optical tissue clearing methods
The following methods were used: 3DISCO [4], BABB [7], ECi [8], and iDISCO+ [5].
In vivo Isolectin staining in mice
Mice were anesthetized with isoflurane and 100 µL Isolectin GS-IB4 from griffonia simplicifolia, Alexa Fluor 647 conjugate (Isolectin GS-IB4 A647; 0.5 µg/µL, 0.25 mM CaCl2 in NaCl; Thermo Fischer Scientific, Dreieich, Germany) was injected i.v. After 30 min, animals were sacrificed and perfused transcardially.
Sample preparation for micro-CT and UM
Carotid artery, heart or matrigel preparation for ex vivo micro-CT
C57BL/6 mice (12 weeks of age) were used for heart preparation. Animals were sacrificed and perfused transcardially with vasodilation buffer (5 min; PBS, papaverine 4 mg/L, adenosine 1 g/L; Sigma-Aldrich, Taufkirchen, Germany) followed by intravascular paraformaldehyde fixation (15 min; 4% PFA; Roth, Karlsruhe, Germany). For this, a 24G × ¾ catheter was inserted into the abdominal aorta and connected to PE tubings for retrograde perfusion as reported [31]. For the matrigel plug perfusion, anterograde perfusion was used. Following intravascular PFA fixation, the vascular system of the mouse was perfused with the radiopaque contrast agent MicroFil (Flow Tech, Carver, MA, USA) with a pressure of 200 mmHg until the silicon polymer cured (~20 min). The preparation was fixed overnight in 4% PFA at 4 °C.
Kidney and heart preparation for micro-CT and UM
C57BL/6 mice (12 weeks of age) were used for UM of the heart and left kidney together with micro-CT of the right kidney. After i.v. Isolectin injection, animals were sacrificed and perfused transcardially with vasodilation buffer. A catheter was inserted into the thoracic aorta and then the animals were perfused with vasodilation buffer. Following this, the left renal artery was ligated, the left kidney and heart were removed and the right kidney was perfused with MicroFil. Kidneys and hearts were stored overnight in 4% PFA. Isolectin-stained kidneys and hearts were then washed in PBS and permeabilized with 0.5% Triton X-100 (Sigma-Aldrich, Taufkirchen, Germany) for two days. An anti-smooth muscle α-Actin (aSMA)-Cy3 antibody (C6198, Sigma-Aldrich, Germany) was used to visualize smooth muscle cells. After 3DISCO clearing [4], samples were subsequently scanned using UM.
Kidney preparation, optical clearing and UM
C57BL/6 mice (12 weeks of age) were used. Isolectin injection, perfusion and fixation were performed as described earlier. The left kidney was divided into four equal parts. Three quarters of the left kidney were stained for aSMA, and cleared with the following methods: 3DISCO [4], BABB [7] or ECi [8]. One quarter was stained with the iDISCO+ [5] protocol (Fig. S1-2).
Spheroid-based or matrigel plug preparation and UM
Isolectin staining was performed as described earlier. Afterwards, the mouse was sacrificed and perfused transcardially with PBS. The matrigel plugs were dissected free and fixed in 4% PFA overnight. For clearing, the 3DISCO clearing procedure was used [4] and plugs were subsequently imaged. After UM imaging, the matrigels were embedded in paraffin for histological sectioning.
Carotid artery preparation and UM
After partial ligation of the carotid artery of ApoE-/- mice, samples were analyzed by postmortem UM. Isolectin staining was performed as described earlier. Animals were sacrificed and perfused transcardially with vasodilation buffer. For the preparation of the carotid arteries, a 24G × ¾ catheter was inserted into the abdominal aorta and connected to PE tubing for retrograde perfusion with warm 1.3% low melting agarose (Sigma-Aldrich, Taufkirchen, Germany). Dissected carotid arteries were stored overnight in 4% PFA at 4 °C, and stained against aSMA (C6198, Sigma-Aldrich, Germany). After clearing (dehydration with ethanol (Sigma-Aldrich, Taufkirchen, Germany) for one hour each of 50 v/v%, 75 v/v%, 90 v/v%, 100 v/v%, 100 v/v%), the sample was incubated in dibenzyl ether (DBE, Sigma-Aldrich, Taufkirchen, Germany) overnight and subsequently scanned by UM.
Laser scanning confocal microscopy (LSM)
After UM scanning, the samples were incubated in 100% xylene and embedded in paraffin (Sigma-Aldrich, Taufkirchen, Germany). Serial tissue slices of 4 µm were created. Five representative serial slides of each spheroid-based matrigel were scanned using a Zeiss LSM 510 meta confocal laser scanning microscope and subsequently analyzed with the Imaris “Filament Algorithm”. As described in the additional methods in Supplementary Material, the “Surface -” and the “Filament Algorithm” (“Autopath loops”) were used with an approximate diameter of 3 µm.
To compare UM and LSM, five representative kidney images of the 3D dataset and 2D serial slices were selected and quantified. Quantification of the glomeruli with Imaris was performed as described in Supplementary Material. Histology was analyzed using DAPI, Isolectin GS-IB4-Alexa Fluor 647 or aSMA-Cy3.
Immunohistochemistry
ApoE-/- mice were perfused with vasodilation buffer as described earlier. Dissected carotid arteries were stored overnight in 4% PFA at 4 °C and embedded in paraffin. 4 µm sections were counterstained with hematoxylin and eosin (H/E). In addition, 4 µm sections were incubated with target retrieval solution pH9 (Agilent, Santa Clara, CA, United States) and with antisera raised against murine CD31 (ThermoFisher Scientific, Dreieich, Germany). The slides were subsequently incubated with secondary antibody and stained using 3,3-diaminobenzidine-tetra-hydrochloride as chromogenic substrate (Vector Laboratories, Peterborough, United Kingdom). Sections were counterstained with hematoxylin and mounted.
Statistical analyses
Data are shown as mean ± SEM. Correlations between micro-CT data and UM were performed by ordinary least products regression carried out in the software R [32]. Statistical analyses were carried out in Graph Pad Prism 5. Comparisons between UM and micro-CT were performed by student´s T-test or ANOVA. Bonferroni correction was applied whenever appropriate. Values of p<0.05 were considered statistically significant.
Results
Micro-CT and UM yield similar lumen profiles of murine coronary arteries
Angiograms of the heart are a well described method to visualize the lumen of coronary arteries in patients. In mice, cast preparations are an established ex vivo method [33]. In the present study, the coronary arteries were filled with MicroFil through the aorta [31] (Fig. 1A). The luminal diameter of the left coronary artery was quantified using micro-CT (Fig. 1B). The left coronary artery was segmented into nine equidistant parts (each 0.5 mm) from the offspring of the arteria coronaria sinistra till the rami ventriculares. It became apparent that lumen diameter, as expected, was smaller in the distal sections than in the proximal sections.
Murine cardiac vessel imaging and quantification. Hearts of C57BL/6 mice are shown. (A) Volume rendering of a micro-CT angiography of a heart perfused with MicroFil. The left coronary artery (LCA) was segmented into nine equidistant parts (right panel). A virtual elastic sphere (green, right panel) was fitted through the segmented lumen (yellow, dotted line). Depicted is the lumen profile of the LCA: 1 = left coronary artery, 2-9 = paraconal interventricular branch. Scale bar represents 1 mm. (B) Diameter of the LCA (n=5). (C1) Cardiac virtual 2D section stained with Isolectin GS-IB4 A647 (green) and aSMA (red) scanned by UM. Scale bar represents 200 µm. (C2) Volume rendering of Isolectin GS-IB4 A647 and whole mount staining for aSMA. The vessel diameter of the left coronary artery is shown in white. (D) Diameter of the left coronary artery as measured by micro-CT and UM (n=4). (E) Comparison between mean lumen areas of LCA of each heart evaluated by micro-CT and UM. Data are shown as mean ± 95% Cl. Correlations were performed by ordinary least products regression. LCA: left coronary artery; micro-CT: micro computed tomography; UM: ultra-microscopy.
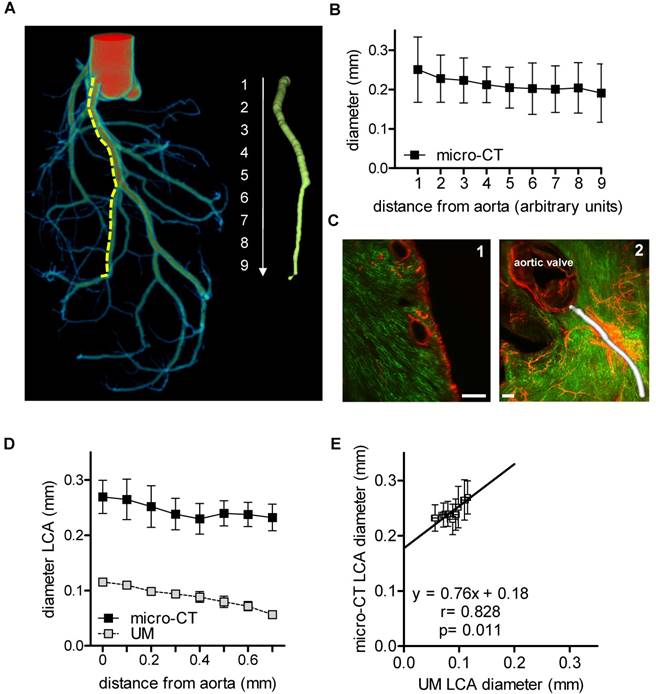
In vivo staining of the vascular bed using Isolectin GS-IB4-coupled with a fluorescent dye and whole mount staining for aSMA enabled visualization of the capillary network and arterioles and arteries of the heart using UM (Fig. 1C). Thresholding for aSMA-negative voxels allowed the quantification of the vessel diameter, as exemplified for the left coronary artery. However, only the first 700 µm of the vessel could be compared to micro-CT, as aSMA staining intensity decreased subsequently to an extent that made automatic segmentation impossible (Fig. 1D). Thus, for a simple lumen visualization, micro-CT and radiopaque contrast agent are superior over UM for quantification of the murine coronary arteries. To compare the quantitative data obtained by both techniques, the lumen diameters of the initial segments were compared, which showed a good correlation (r=0.828, p=0.011). Linear regression analysis, however, revealed that the lumen diameters determined by UM were approximately 0.8-fold smaller than those of the corresponding micro-CT data (Fig. 1E). It is unclear whether this difference is a consequence of thresholding or shrinking artifacts during the clearing process. Micro-CT, with a nominal resolution of 9 µm, is not able to visualize capillaries. This task is specific for UM with a resolution limit of 1 µm. With UM, the cardiac capillaries were indeed readily visible (Fig. 1C).
Micro-CT vascular volume fraction correlates with aSMA-positive vessels in the murine kidney determined using UM
CT has been used to assess vascular alterations in branching or diameters of large vessels during progression of kidney disease in mice [34]. Similarly, larger renal vessels could be visualized by micro-CT in the mouse kidney after MicroFil perfusion (Fig. 2A). Threshold-based segmentation of ex vivo micro-CT data allowed detection of the renal, segmental and interlobar arteries and veins but failed to visualize capillaries. The vascular volume fraction was 16.0%±1.0% of the murine kidney and comparable to published data [35]. In the present study, it was not possible to segment glomeruli and thereby determine their size from CT data, as X-ray attenuation of MicroFil was insufficient for this task. Successful perfusion of glomeruli was verified with microscopy. In fact, segmentation of glomeruli was possible using the contrast agent barium (Micropaque, Guerbet, Sulzbach, Germany). As perfusion of the post-glomerular structures, however, was impossible with barium (potentially due to its higher granularity), this approach was also no alternative to study the kidney as a whole (data not shown).
Murine renal vessel imaging and quantification. Kidneys of C57BL/6 mice are shown. (A) Representative micro-CT 2D image and 3D volume rending of a MicroFil-perfused kidney. Light microscopy image of a MicroFil (blue)-perfused kidney vessel. Glomeruli are marked with a dot (yellow). Scale bar represents 1 mm. (B) UM imaging of cleared kidneys stained with Alexa Fluor 647-coupled Isolectin GS-IB4 (green) and whole-mount stained for aSMA (red). (B1) Volume rendering and (B2) 3D section of a representative vessel segment. (B3) Glomeruli as identified by the Imaris “Spots Algorithm”. Scale bar represents 200 µm. (C) Confocal image of a previously UM-scanned sample showing aSMA-positive arterioles (red) and Isolectin GS-IB4 A647-stained endothelium of the glomerulus (green). Nuclei are stained with DAPI (blue). Scale bar represents 50 µm (B2-3). (D) Quantification of glomeruli diameter as analyzed by UM and LSM. (E) Micro-CT (n=4) and UM (n=6) evaluation of vascular volume fraction of the renal cortex. (F) UM-based evaluation of the vascular volume fraction of capillaries, glomeruli and aSMA-positive vessels of the renal cortex (n=6). (G) Comparison between vascular volume fraction of the cortex evaluated by micro-CT and aSMA-positive vessel vascular fraction evaluated by UM (n=4). Data are shown as mean ± SEM. Correlations were performed by ordinary least products regression and paired student´s T-test; *p<0.05. aSMA pos. v.: alpha smooth muscle actin positive vessel; LSM: laser scanning confocal microscopy; micro-CT: micro computed tomography; UM: ultra-microscopy; vvf: vascular volume fraction.
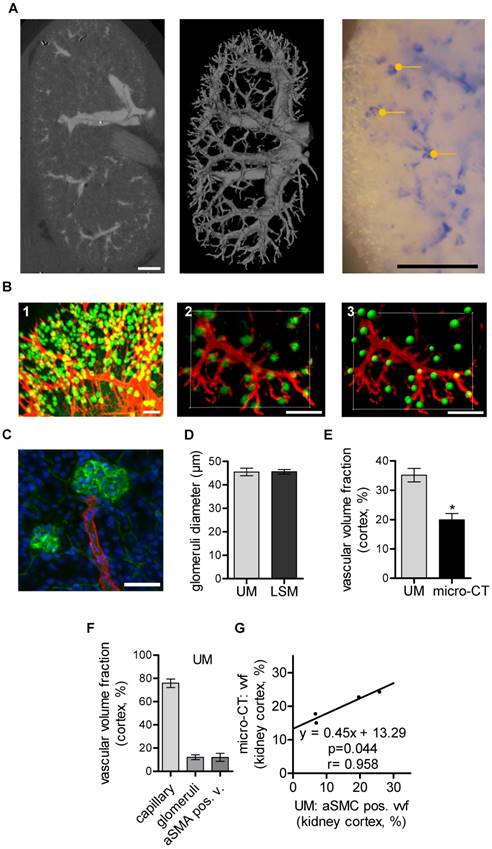
In vivo staining of the whole vascular bed using Isolectin GS-IB4-coupled with a fluorescent dye and whole mount staining against aSMA is shown in Fig. 2B. UM enabled threshold-based masking and 3D-calculation of the glomeruli diameters (Fig. 2B1-3). Laser scanning confocal microscopy (LSM) confirmed the UM measurement of the glomerular diameters and thus demonstrated its high accuracy (Fig. 2C-D). Importantly, UM also allowed quantification of the total number of glomeruli/cm3, 375000± 15546, and thereby the assessment of fundamental parameters of kidney architecture. Unexpectedly, the vascular volume fraction of the renal cortex as determined using micro-CT was significantly smaller when compared to measurements performed with UM (Fig. 2E). A differentiation of the UM measurement into capillaries, glomeruli and aSMA-positive vessels and correlation of these vascular sub fractions to micro-CT measurements showed that only the aSMA-positive vessel fraction correlated with the micro-CT measurements (Fig. 2F-G).
Collectively, these data demonstrate that micro-CT provides an overview of larger vascular structures of the murine kidney whereas UM is suitable to assess vascular sub fractions, the diameter of glomeruli and the total number of glomeruli in a semi-automated fashion. However, as the kidney cannot be completely cleared by the 3DISCO method, imaging of a whole mouse kidney using UM is not feasible and rather smaller segments have to be analyzed separately.
UM, but not micro-CT, is suited for studying matrigel plug capillarization
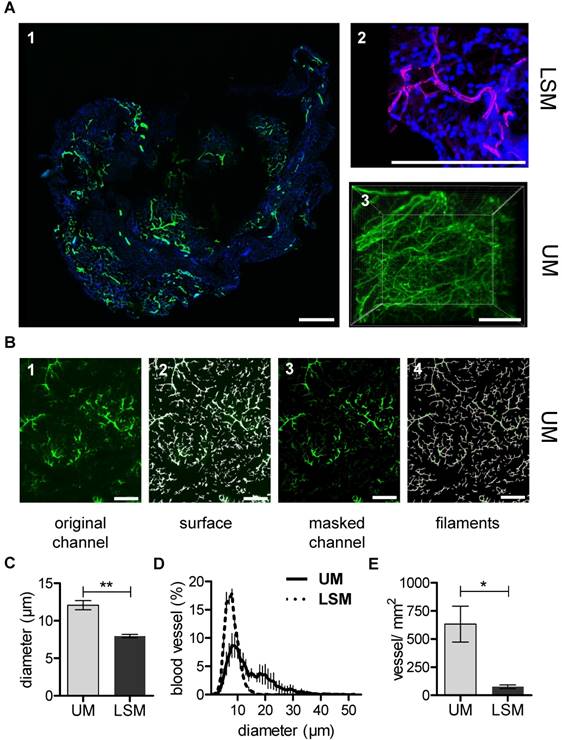
In vivo matrigel angiogenesis is a process that largely depends on endothelial vascular outgrowth and capillary sprouting. Using the micro-CT technique, direct visualization of the matrigel plug vascularization could not be achieved with certainty. Although MicroFil-positive vessels could be detected, they were located at the border zone of the matrigel plug and thus presumably represent pre-existent vessels (Fig. S4). In contrast to this, after in vivo Isolectin GS-IB4 A647 application, the matrigel plug capillarization was readily detected using UM (Fig 3A). In order to directly compare UM to the current gold standard LSM, samples were first scanned using UM and subsequently sectioned and imaged by LSM. The same quantification algorithm was than applied to both image stacks (Fig. 3B). Interestingly, mean vessel diameter and vessel density were significantly lower when measured by LSM as compared to UM (Fig. 3C-E).
Matrigel plug angiogenesis imaging and quantification. In vivo matrigel angiogenesis assay in SCID mice. Isolectin GS-IB4 A647 conjugate-stained vessels (green), DAPI (blue). Images were taken by confocal microscopy (A1-2) or by UM (A3) 26 days after matrigel injection. Representative pictures and 3D renderings are shown. Scale bar represents 100 µm. (B) The original channel (B1) was masked with the “IsoSurface Algorithm” (B2) and the new masked channel (B3) was analyzed with the “Filament Algorithm” (B4). Quantification of capillary diameter (C), vessel size distribution (D) and vessel density (E) analyzed by confocal microscopy and UM. Data are shown as mean ± SEM (n=5). Paired student´s T-test was used; *p<0.05, **p<0.01. LSM: laser scanning confocal microscopy; UM: ultra-microscopy.
UM is superior to LSM for detection of cell integration into the murine vasculature
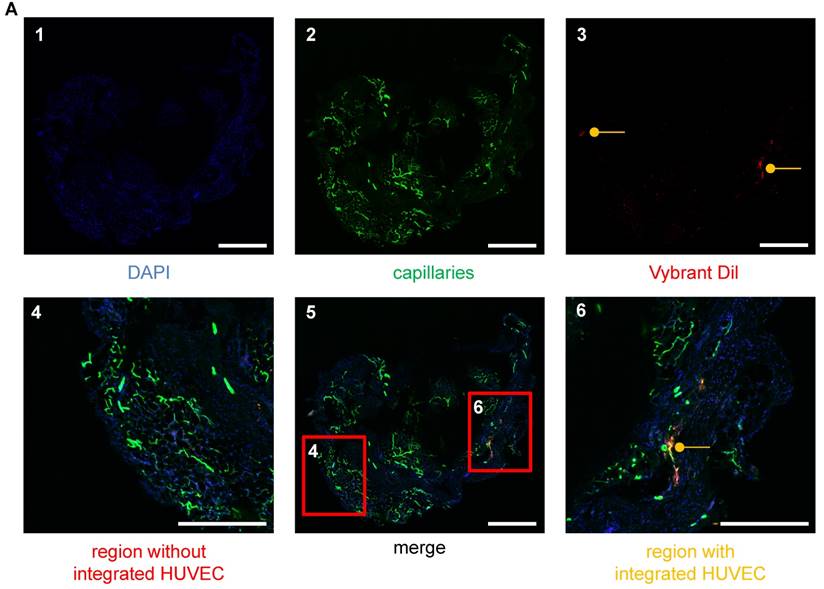
The integration of human endothelial cells into murine vascular networks in matrigel plugs was studied by LSM and UM (Fig. 4-6). The majority of cells in an LSM section were not stained positive for Vybrant dil /HUVECs (Fig. 4) and thus numerous slices had to be analyzed to obtain reliable results. As vascular integration occurs in all dimensions of the 3D space, Z-stacks (Video S1) have to be analyzed to determine the true proximity of a cell to a vessel. Using LSM, the procedure is, therefore, highly time-consuming, laborious and observer-dependent.
Visualization of HUVECs in the vascular networks of matrigel plugs using LSM. (A) HUVECs were stained with Vybrant DiI (red), embedded in matrigel and injected into SCID mice. The plug was removed after 26 days and analyzed for angiogenesis. Cellular nuclei are stained with DAPI (blue) (A1). Isolectin GS-IB4 A647 conjugate-stained vessels (green) (A2) and HUVECs (red) (A3) are shown. (A5) Merge of images A1-3. (A6) Example of a region with integrated HUVECs (orange). (A4) Example of a region without integrated HUVECs. Scale bar represents 400 µm. DAPI: 4′,6-Diamidin-2-phenylindol; HUVEC: human umbilical vein endothelial cell.
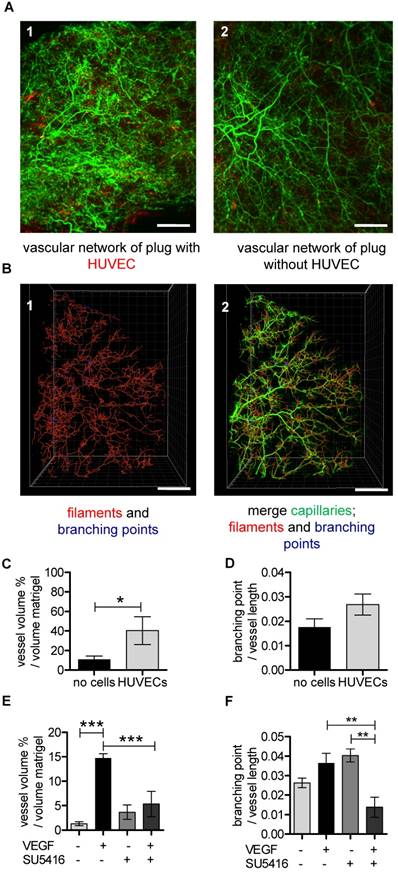
UM-based visualization and quantification of the vascular network in matrigel plugs. (A-D) HUVECs stained with Vybrant DiI (red) were embedded in matrigel (A1) and cell-free matrigel (A2) and injected into SCID mice. Red dots in cell-free matrigel (A2) are false positive signals. Isolectin GS-IB4 A647 conjugate-stained vessels are in green. (B1) A quarter of the Isolectin GS-b4 Alexa 647-stained vascular network is shown and was analyzed by detecting filaments (red) and branching points (blue). (B2) The vascular network and the created filaments and branching points were merged. Scale bar represents 500 µm. (C-D) Analysis of vessel volume in percent per volume of matrigel plug or branching points per vessel length with and without HUVECs. Data are shown as mean ± SEM (n=4). Unpaired student´s T-test was used. (E) VEGF (200 ng/mL) and VEGF-free matrigels were injected in C57BL/6 mice. (E-F) C57BL/6 mice were treated with (n=3) or without (n=4) VEGF receptor antagonist SU5416. Data are shown as mean ± SEM. One-way ANOVA followed by Newman-Keuls post-hoc test was used; **p<0.01, ***p<0.001. HUVEC: human umbilical vein endothelial cell; VEGF: vascular endothelial growth factor.
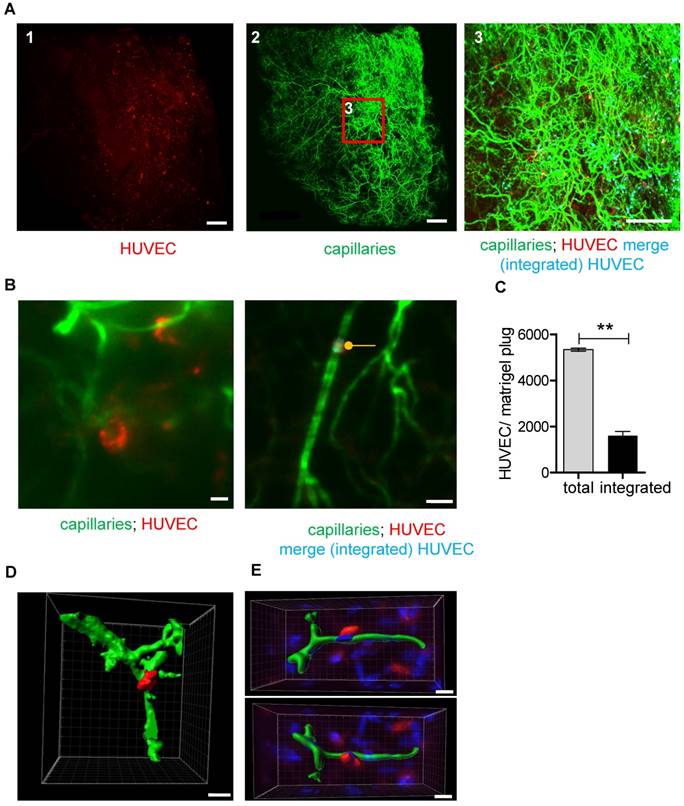
Using UM, human cells could be readily detected in the plug and also the murine vessel system was easily visualized (Fig. 5A-B). Integration of the human endothelial cells into the murine vessel system was observed in 30%±3.1% of cases (Fig. 5B-C). In many cases, the endothelial cell configured around the vessel, so it could even be segmented (Fig. 5D-E and Fig. S5). As the total number of cells detected by UM was so high that manual analyses were not feasible, an Imaris script was developed to determine cell number and integration of the HUVECs into the murine vessel system. Integration was judged on the basis of proximity, assuming that integrated cells are double positive for Isolectin and Vybrant Dil. Importantly, this technique allowed a rapid and observer-independent analysis of the HUVEC integration (Fig. 5C and Video S1). To determine whether the technique really detects integration, fibroblasts, a cell type that should not integrate into the vascular system, were seeded into the matrigel. Whereas human umbilical vein endothelial cells integrated with 30.0%±3.1% efficiency, fibroblast integration was only 8.3%±1.3%. Manual analysis of the images demonstrated that this low number of cells were randomly in proximity to the vessel but did not truly integrate. Collectively, these observations demonstrate that UM together with computer-based image analysis is a powerful approach to detect cellular integration into the vascular network.
UM-based visualization and quantification of HUVEC integration into capillary networks in matrigel plugs. (A) HUVECs stained with Vybrant DiI (red) were embedded in matrigel and injected into SCID mice. Analyses were done 26 days after implantation. Isolectin GS-IB4 A647 conjugate-stained vessels (green) are shown. Integrated HUVECs are marked in blue. Scale bar represents 500 µm. (B) High magnification of a Vybrant DiI (red)-stained HUVEC integrated into the capillary network and visualization of merged green and red staining (integrated HUVEC, blue, marked with a dot). Scale bar represents 50 µm. (C) Quantification of total and integrated HUVEC per plug using UM. Data are shown as mean ± SEM (n=3). Paired student´s T-test was used; **p<0.01. (D-E) 3D reconstruction of Vybrant DiI (red)-stained HUVEC integrated into the capillary network (green). Shown is a UM (D) or confocal microscopy (E) dataset. Scale bar represents 20 µm (D) or 10 µm (E). Nuclei were stained with DAPI (blue). HUVEC: human umbilical vein endothelial cell.
The total vascular volume within the matrigel plug is an important parameter to characterize the amount of newly formed vessels. Interestingly, to our knowledge this has never been studied. Relative vessel volume was higher in plugs supplemented with HUVECs compared to HUVEC-free plugs (Fig. 6A-C and Video S2). The diameter of the vessels, however, was not different between the two groups (data not shown). There was a trend towards an increase in branching density (branching points normalized to vessel length) in plugs supplemented with HUVECs, but this did not reach the significance level (Fig. 6D).
In order to determine whether this technique can also be used to monitor efficacy of drugs changing the course of angiogenesis, a second series of experiments was performed. Mice received matrigel with or without VEGF and in subgroups the VEGF receptor blocker SU5416 was applied. Subsequently, the size of the murine vascular network was determined. VEGF, as expected, increased the vascular volume and inhibition of VEGF receptor signaling prevented this effect (Fig. 6E). There was a trend that the pro-angiogenic effect of VEGF led to an increase in the branching density (Fig. 6F). The VEGF-dependent increase in the branching density could be inhibited with VEGF receptor blocker (Fig. 6F).
UM visualizes intraplaque angiogenesis
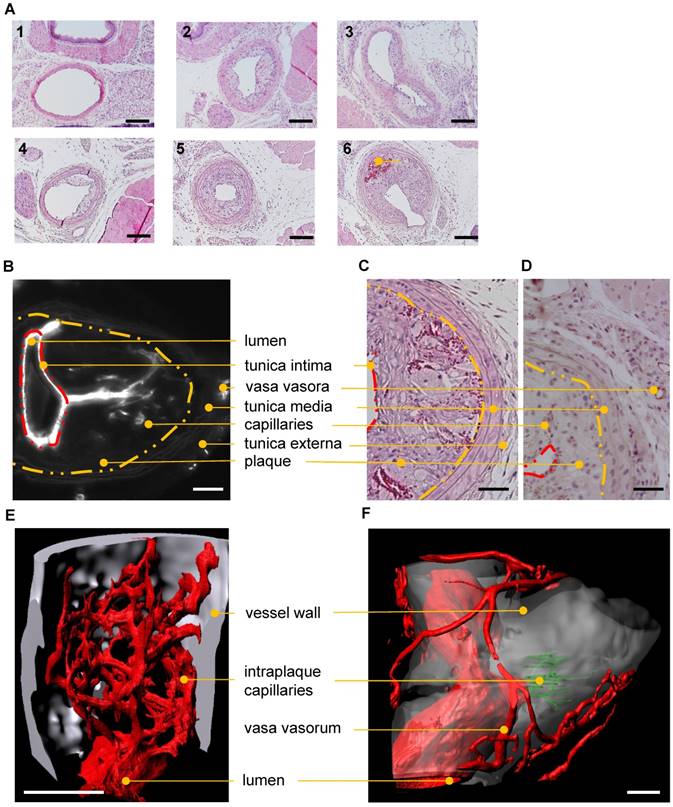
Standard techniques to visualize intraplaque angiogenesis are rather indirect. They rely on identifying erythrocytes or endothelial cells in the plaque. A true intraplaque vascular network has, to our knowledge, not been visualized. Using the indirect techniques outlined earlier, conventional histology (Fig. 7A) revealed an average of 1.1±0.4 capillarized plaque per vessel at post-operative day 28 after partial carotid artery ligation and fat feeding. No capillarized plaques were detected 2 weeks after the operation (data not shown, n=9). CD31 staining demonstrated the occurrence of capillaries penetrating atherosclerotic plaques (Fig. 7C-D). Using UM, visualization of the intraplaque capillary network was possible (Fig. 7B, E-F and Video S3). Capillarized plaques were present in two of five carotid arteries near the bifurcation. Vasa vasora, which promote plaque angiogenesis and plaque progression, were also detected.
Histological and UM-based visualization of atherosclerotic plaque capillarization. (A) H/E staining of the left common carotid artery (LCCA) of ApoE-/- mice at postoperative day 14 (1-3) and 28 (4-6) after partial ligation of the LCCA and HFD. Side-dependent vascular lumen profile of the LCCA near the aortic arch (1, 4) the bifurcation (3, 6) and in between (2, 5). Capillaries filled with red blood cells (dark red) in the atherosclerotic plaque are marked (6). Scale bars represent 100 µm. n=10. (B-F) Visualization of capillarized plaques 28 days after partial ligation. (B-D) Lumen, tunica intima (red dashed line), inner layer of tunica media (yellow dashed line), tunica externa, vasa vasora, plaque and intraplaque capillaries are marked with dots. (B) 2D virtual cross section (UM) of the carotid artery near the bifurcation. Isolectin GS-IB4 A647 is shown in white. Scale bar represents 100 µm. (C) H/E-stained cross section near the bifurcation. (D) CD31 (brown)-stained cross sections near the bifurcation. Scale bar represents 70 µm. (E) Surface rendering of UM angiography. The bifurcation is shown. Endothelial cells are stained with Isolectin GS-IB4 A647 (red), the autofluorescence is colored in white, and intraplaque capillaries (Isolectin GS-IB4 A647 positive) are in green. Scale bar represents 100 μm. (F) Surface rendering of an UM angiography of a carotid artery of a second ApoE-/- mouse. Plaque capillarization is shown near the bifurcation. Endothelial cells are stained with Isolectin GS-IB4 A647 (red) and the autofluorescence is colored in white.
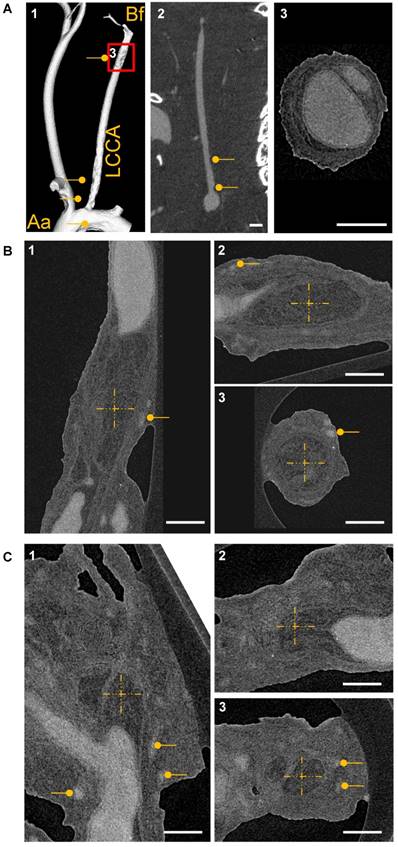
Acknowledging that the diameter of a capillary is beyond the limit of resolution for micro-CT, measurements by nano-CT were carried out with a voxel size of 880 nm. Animals were perfused postmortem with MicroFil and subsequently images were obtained by micro-CT and nano-CT. Micro-CT could only detect the vascular lumen and lumen loss in the carotid artery as a consequence of the lumen obstruction by the atherosclerotic plaque (Fig. 8A1-2). High resolution nano-CT detected the plaques per se, dissections and vasa vasora (Fig. 8A3, B-C). Nevertheless, even with nano-CT it was not possible to visualize intraplaque capillaries. Thus, UM is the only 3D method tested here to visualize capillary networks in atherosclerotic plaques.
CT-based visualization of atherosclerotic plaque capillarization. (A1) Volume rendering of micro‐CT angiography of an ApoE-/- mouse 28 days after partial ligation of the left common carotid artery (LCCA) and MicroFil infusion. The vessel was visualized from aorta (Aa) to bifurcation (Bf). (A2) 2D cross section of the left carotid artery is shown. Atherosclerotic plaques are marked with a dot. Scale bar represents 1 mm. (A3) Magnification of the LCCA shown in A1. Scale bar represents 300 µm. (B) High resolution nano-CT cross section of a big plaque between the aortic arch and the bifurcation and at the bifurcation (C) Vasa vasora are marked with dots. The MicroFil micro-CT contrast agent appears in grey and plaque tissue in dark grey. (B-C) The centers of the dashed crosses represent the same voxel of the dataset shown in subfigures 1-3. Three CT image planes are shown (sagittal, transverse and coronal). Scale bar represents 300 µm. Aa: aortic arch; Bf: bifurcation; LCCA: left common carotid artery.
Discussion
Various imaging techniques have been used to characterize vascular networks [36]. Because all these techniques have their strengths and weaknesses, multiscale/ multiresolution imaging techniques are needed to obtain a comprehensive picture of the vasculature in physiological as well as pathophysiological states. An example of such an approach is the combination of ex vivo micro-CT with in vivo magnetic resonance imaging to visualize the vascular network in breast cancer [37]. In the present study, we compared micro-CT and UM as potential complementary techniques to further advance multimodal imaging. The conclusions of the comparison are summarized in Table 2. Whereas micro-CT was a reliable technique to image vessels down to a size of ~100 µm, UM was particularly well suited to visualize capillary networks. The 100 µm limit is considerably less favorable than the theoretical resolution of the micro-CT, owing to the fairly low signal-to-noise ratio of tissue to contrast agent in the vascular lumen. In fact, it has been shown that by phase contrast-based SRmicro-CT technology, the resolution of the technique can be extended down to capillaries [38]. Unfortunately, such machines are not widely available and are limited to specific applications.
Overview of the advantages and disadvantages of micro-CT (Skyscan 1176), nano-CT (Subµ-CT Lab, Fraunhofer EZRT), UM (Ultramicroscope II) and LSM (LSM 510 meta) employed for multiscale vascular network analysis.
| Imaging modality | Suited applications | Advantages | Disadvantages |
|---|---|---|---|
| micro-CT | ++ Coronary artery | Medium resolution (µm) | Vessel perfusion with contrast agent not always possible |
| + Whole vasculature of the kidney | In and ex vivo technique | Signal to background ratio even with contrast agents not always high enough | |
| ++ Kidney artery/ veins | Several blood pool contrast agents commercially available | Acquisition time 1 h 45 min | |
| ++ Carotid artery | Robust segmentation of vessel filled with contrast agent | Raw data size: 13 GB, reconstructed data size: 0.3 GB-1.1 GB | |
| High sample coverage (2 cm) or more with sub scan | Movement artifacts of biological samples | ||
| nano-CT | + Coronary artery | High resolution (nm-µm) | Vessel perfusion with contrast agent not always possible |
| ++ Kidney artery/ veins | Several blood pool contrast agents commercially available | Acquisition time 1 h 55 min - 4 h | |
| + Carotid artery | Robust segmentation of vessel filled with contrast agent, many contrast agents available | Raw data size: 6.25 GB, reconstructed data size: 17 GB | |
| ++ Atherosclerotic plaque vasa vasora | “Cell type” specific soft tissue contrast to distinguish atherosclerotic plaque tissue, fat and vessel | Medium sample coverage (2 mm), depends on magnification | |
| Movement artifacts of biological samples | |||
| Sample sectioning necessary for high resolution images | |||
| UM | ++ Heart capillaries | High resolution (1 µm-2 µm) | Tissue clearing and bleaching of fluorescent signal |
| ++ Kidney glomeruli | Multi target-, color application, fluorescence proximity analysis | Whole mount staining needs optimization processes | |
| ++ Kidney artery/ veins | Homogenous Isolectin staining | Raw data size 8.5 GB-43 GB, reconstructed data size: 6 GB-28 GB | |
| ++ Kidney capillaries | Acquisition time 20 min-40 min | Tissue shrinkage | |
| ++ Cell based matrigel assay | No movement artifacts due to dehydration | Segmentation of big vessel is time consuming | |
| ++ Matrigel capillaries | Medium sample coverage (0.7 cm), sample sectioning enhance fluorescence signal intensity | ||
| + Atherosclerotic plaque vasa vasora | Decay of fluorescence signal over time | ||
| ++ Atherosclerotic plaque capillaries | |||
| LSM | + Kidney glomeruli | High resolution (nm-µm) | Sectioning is time consuming and destructive to the sample |
| + Kidney artery/ veins | Multi target-, color application, fluorescence proximity analysis | 3D orientation has to be defined before sectioning and has and impact on results | |
| + Kidney capillaries | Homogenous Isolectin staining | Bleaching of fluorescent signal | |
| + Cell based matrigel assay | Acquisition time 3 min-20 min | Low sample coverage (~4 µm-50 µm/slide), observer-dependent as the analyzed region of interest is usually smaller compared to UM or micro-CT | |
| + Matrigel capillaries | Many staining protocols in the literature available | Tissue shrinkage | |
| + Atherosclerotic plaque vasa vasora | Raw data size 0.01 GB-0.1 GB | ||
| + Atherosclerotic plaque capillaries |
+: suited; ++: well suited; CT: computed tomography; GB: gigabyte; LSM: laser scanning confocal microscopy; UM: ultra-microscopy.
Software-based algorithms for time-saving analysis of this type of large data set have also been developed, employing current software tools. Besides the software used in this study, there are many others: Amira (FEI, Munich, Germany), MATLAB (The MathWorks, Inc., Massachusetts, USA), Vaa3D (Howard Hughes Medical Institute, Maryland, USA), AnalyzeDirect (AnalyzeDirect, Inc., Kansas, USA) or Labview (National Instruments, Munich, Germany). Open source software like ImageJ and plugins can be found at http://rsbweb.nih.gov/ij/plugins/.
Micro-CT imaging has been used by several groups to analyze the murine heart's arterial vasculature. Vessel geometry and total vessel length of the murine coronary network [39,40,41,42] have been determined in 2D down to a diameter of 45 µm [39]. Recently, lumen distribution of murine coronary arteries (24-240 µm diameter) have been calculated with the help of several different algorithms [42]. In the present study, we used Imalytics Preclinical Software [43] to quantify and visualize the diameter of the coronary artery network. The distance map visualizes different vessel diameters in different colors and thereby enables a qualitative overview of vessel size. The elastic sphere tool enables fast quantification of vessel diameter at every position.
Whereas the micro-CT technique is limited by X-ray contrast and resolution, UM is mostly limited by the clearing technology and the capacity of an organ to be cleared. Depending on the organ of interest, several optical clearing procedures have been developed [44]. In the present study, 3DISCO, BABB, ECi and iDISCO+ were used to clear Isolectin- and aSMA-stained kidneys (Fig. S1-2). Interestingly, the relative Isolectin signal intensity did not differ significantly between these methods. The absolute Isolectin intensity was significantly higher in 3DISCO-cleared samples compared to iDISCO+. The relative aSMA signal intensity was significantly larger in iDISCO+ samples compared to BABB. The 3DISCO clearing method was used for the kidney, heart and matrigel and was sufficient in terms of clarity of the sample (Fig. S6). To visualize capillaries of the heart or any other organ, UM is the technique of choice as its resolution is high. Furthermore, Isolectin GS-IB4 A647 was homogenously deposited on the endothelium after in vivo administration. In comparison to contrast agents that fill the lumen of vessels, negative segmentation of the lumen of aSMA-positive coronary arteries was feasible but time consuming. Tissue shrinkage occurs as a problem in both techniques. PFA fixation led to tissue shrinkage and the clearing process with dehydration further reduced the tissue size. Nevertheless, due to the shape of the heart, 3D sectioning of coronary arteries and diameter determination is only practical in 3D as axial orientation of the coronary artery changes from the aortic valve to the tip of the heart. Thus, micro-CT is the method of choice to visualize vessels with a diameter of ≥100 µm.
Decreased glomerular number and increased glomerular size are risk factors for chronic kidney and cardiovascular diseases [40,41,45]. Here, we present a technique to determine the size of glomeruli and their number in the mouse kidney. Our experiments also revealed that conventional histology is feasible after UM clearing and fluorescently labeled cells are still visible after the complex preparation. Direct comparison of virtual slices with conventional LSM scans revealed a very good correlation for the diameter of the glomeruli. In our hands, contrast enhanced micro-CT or nano-CT were not able to generate datasets that allow threshold-based segmentation and quantification of glomeruli. Perfusion of glomeruli was proven by microscopy of kidneys perfused with colored MicroFil. Potentially, the contrast between MicroFil and soft tissue was not strong enough to segment capillaries and glomeruli. Therefore, the vascular volume fraction measured with micro-CT only correlated with aSMA-stained vessels (UM data), which represent larger vessels. This has to be taken into account when MicroFil CT datasets of the kidney are interpreted. Nevertheless, we and others were able to visualize 3D vascular networks of preglomerular arteries [46], which also change during progressive renal disease.
The subcutaneous matrigel plug assay is one method of choice to study in vivo angiogenesis. Several quantification methods have been developed, such as determination of endothelial cell markers [26,27], hemoglobin content measurements and histological measurement of vascular density [25]. Along with conventional histology, 3D visualization of vessel networks has been described [47]. Here, we compared 3D datasets of virtual and conventional histology and found significant differences between the average vessel dimeter inside matrigel. This might be a consequence of matrigel shrinkage after the dehydration procedure for paraffin embedding. Moreover, there is a large body of literature on stereology that shows that besides tissue shrinkage, the tissue sectioning angle (angle between the oriented capillaries and sectioning planes) as well the section thickness have a strong impact on the measured vessel diameter [48]. This aspect is obviously of great importance for the analysis of 2D-data obtained by LSM technology. In contrast, the 3D data sets of UM and micro-CT are not subject to sectioning artefacts. The comparison of UM and LSM images, therefore, revealed an expected difference in mean vessel dimeter. It is highly probable that this difference is a consequence of the lack of stereologic correction of our LSM data set. Thus, another advantage of UM over LSM is that values obtained are robust against sectioning artefacts.
Characteristics of human angiogenesis are added to this technique by embedding native HUVECs in the matrigel [28]. We also described a method to stain these endothelial cells and quantify their integration into the vessel network. Quantification on a cellular level has been previously described [49-51]. It allows study of the survival as well as the angiogenic activity of the endothelial cells in a semi-automated approach. It has to be taken into account that the Vybrant Dil labeling of the endothelial cells will be diluted during cell division. This may lead to reduced fluorescence signal intensity of labeled cells and reduced cell count. Further studies using endothelial cells stably expressing protein-based fluorescence probes will be needed to specifically address this aspect [52] .
Neovascularization of atherosclerotic plaques as well as of vasa vasora formation are important parameters determining plaque vulnerability and atherosclerosis progression [29]. Furthermore, there is evidence that plaque angiogenesis, with the formation of microvessels causing microvascular leakage, results in inflammation, intraplaque hemorrhage and plaque rupture [53,54]. Current preclinical studies used conventional histology and quantitative CT imaging to quantify vasa vasora in aortas of ApoE-/-/LDL-/- double knockout mice [55,56]. Atherosclerotic plaques are in fact easily detectable using micro-CT. Nano-CT enables visualization of vasa vasora in carotid arteries but fails to visualize capillaries inside the plaque. Due to differences in tissue density, atherosclerotic plaques are distinguishable from carotid artery soft tissue. Viscosity of the contrast agent as well as generating the needed pressure to perfuse plaque capillaries are technical problems that have to be solved. As plaque perfusion is quite slow, it might be necessary to reduce the viscosity of MicroFil to reduce the amount of curing agent and extend the radiopaque application time. Plaque angiogenesis has been induced by cuff placement around a vessel [57] and was also observed here in the carotid artery partial ligation model. UM was able to detect vasa vasora and capillaries inside the plaques, providing high resolution 3D datasets.
In a clinical setting, micro-CT and UM could be used to evaluate atypical vascular structures. With micro-CT, paraffin-embedded atherosclerotic tissue can be scanned to identify calcified parts [58]. UM of samples derived from paraffin tissue blocks [9] could be used to visualize capillarization of atherosclerotic plaques and thereby determine plaque vulnerability. It has been shown that plaque angiogenesis and plaque vulnerability correlate with cardiovascular event rates [59]. Antiangiogenic therapy, to change plaque vulnerability, is becoming a clinically interesting therapeutic option. New imaging techniques are needed to analyze preclinical and clinical samples. We could demonstrate that UM identifies typical morphologic features of VEGF in vascular network formation and thereby provides a readout for anti-VEGF therapies. UM and micro-CT together may open a new field of clinical pathology diagnosis.
In summary, UM is a fast and accurate method to visualize and analyze remodeling processes of the vasculature in diverse preclinical and clinical settings. Contrast-enhanced micro-CT with lumen-filling contrast agents is superior to UM for analysis of vessel networks larger than capillary networks. UM and micro-CT are complementary techniques that together can provide a complete and defined visualization of various parts of the vasculature.
Abbreviations
3DISCO: three-dimensional imaging of solvent-cleared organs; Aa: aortic arch; ApoE: apolipoprotein E; aSMA: alpha smooth muscle actin; BABB: benzyl alcohol: benzyl benzoate; Bf: bifurcation; CT: computed tomography; EBM: endothelial basal medium; ECi: ethyl cinnamate; H/E: hematoxylin and eosin; EGM: endothelial growth medium; EtOH: Ethanol; GB: gigabyte; HFD: high fat diet; HUVEC: human umbilical vein endothelial cells; iDISCO+: immunostaining 3DISCO; IHC: Immunohistochemistry; LCA: left coronary artery; LCCA: left common carotid artery; LSM: laser scanning confocal microscopy; MRI: magnetic resonance imaging; PBS: phosphate buffered saline; PET: positron electron tomography; SCID: severe combined immunodeficiency; UM: ultramicroscopy; vvf: vascular volume fraction.
Acknowledgements
We are grateful for the excellent technical assistance of Susanne Schütz and Mustapha Khabta. We thank Andrea Vasconez for critical reading of the manuscript.
Source of Funding
The study was supported by the DFG Excellence Cluster “Cardiopulmonary System - ECCPS”, SFB 834 (TPA2 to RPB), the Faculty of Medicine, Goethe-Universität, Frankfurt am Main, Germany and the German Center for Cardiovascular Research (DZHK), Partner site RheinMain, Frankfurt, Germany.
Supplementary Material
Supplementary figures and methods.
Video S1.
Video S2.
Video S3.
Competing Interests
The authors have declared that no competing interest exists.
References
1. Lin JB, Phillips EH, Riggins TE, Sangha GS, Chakraborty S, Lee JY, Lycke RJ, Hernandez CL, Soepriatna AH, Thorne BRH, Yrineo AA, Goergen CJ. Imaging of small animal peripheral artery disease models: recent advancements and translational potential. Int J Mol Sci. 2015;16:11131-11177
2. Horton NG, Wang K, Kobat D, Clark CG, Wise FW, Schaffer CB, Xu C. In vivo three-photon microscopy of subcortical structures within an intact mouse brain. Nat Photonics. 2013;7:205-209
3. Dobosz M, Ntziachristos V, Scheuer W, Strobel S. Multispectral fluorescence ultramicroscopy: three-dimensional visualization and automatic quantification of tumor morphology, drug penetration, and antiangiogenic treatment response. Neoplasia. 2014;16:1-13
4. Erturk A, Becker K, Jahrling N, Mauch CP, Hojer CD, Egen JG, Hellal F, Bradke F, Sheng M, Dodt H-U. Three-dimensional imaging of solvent-cleared organs using 3DISCO. Nat Protoc. 2012;7:1983-1995
5. Renier N, Adams EL, Kirst C, Wu Z, Azevedo R, Kohl J, Autry AE, Kadiri L, Umadevi Venkataraju K, Zhou Y, Wang VX, Tang CY, Olsen O. et al. Mapping of Brain Activity by Automated Volume Analysis of Immediate Early Genes. Cell. 2016;165:1789-1802
6. Pan C, Cai R, Quacquarelli FP, Ghasemigharagoz A, Lourbopoulos A, Matryba P, Plesnila N, Dichgans M, Hellal F, Ertürk A. Shrinkage-mediated imaging of entire organs and organisms using uDISCO. Nat Methods. 2016;13:859-867
7. Schwarz MK, Scherbarth A, Sprengel R, Engelhardt J, Theer P, Giese G. Fluorescent-protein stabilization and high-resolution imaging of cleared, intact mouse brains. PLoS One. 2015;10:e0124650
8. Klingberg A, Hasenberg A, Ludwig-Portugall I, Medyukhina A, Männ L, Brenzel A, Engel DR, Figge MT, Kurts C, Gunzer M. Fully Automated Evaluation of Total Glomerular Number and Capillary Tuft Size in Nephritic Kidneys Using Lightsheet Microscopy. J Am Soc Nephrol. 2017;28:452-459
9. Nojima S, Susaki EA, Yoshida K, Takemoto H, Tsujimura N, Iijima S, Takachi K, Nakahara Y, Tahara S, Ohshima K, Kurashige M, Hori Y, Wada N. et al. CUBIC pathology: three-dimensional imaging for pathological diagnosis. Sci Rep. 2017;7:9269
10. Launay P-S, Godefroy D, Khabou H, Rostene W, Sahel J-A, Baudouin C, Melik Parsadaniantz S, Reaux-Le Goazigo A. Combined 3DISCO clearing method, retrograde tracer and ultramicroscopy to map corneal neurons in a whole adult mouse trigeminal ganglion. Exp Eye Res. 2015;139:136-143
11. Kiessling F, Greschus S, Lichy MP, Bock M, Fink C, Vosseler S, Moll J, Mueller MM, Fusenig NE, Traupe H, Semmler W. Volumetric computed tomography (VCT): a new technology for noninvasive, high-resolution monitoring of tumor angiogenesis. Nat Med. 2004;10:1133-1138
12. Schambach SJ, Bag S, Groden C, Schilling L, Brockmann MA. Vascular imaging in small rodents using micro-CT. Methods. 2010;50:26-35
13. Schurmann C, Gremse F, Jo H, Kiessling F, Brandes RP. Micro-CT Technique Is Well Suited for Documentation of Remodeling Processes in Murine Carotid Arteries. PLoS One. 2015;10:e0130374
14. Utzinger U, Baggett B, Weiss JA, Hoying JB, Edgar LT. Large-scale time series microscopy of neovessel growth during angiogenesis. Angiogenesis. 2015;18:219-232
15. Fei P, Lee J, Packard RRS, Sereti K-I, Xu H, Ma J, Ding Y, Kang H, Chen H, Sung K, Kulkarni R, Ardehali R, Kuo C-CJ. et al. Cardiac Light-Sheet Fluorescent Microscopy for Multi-Scale and Rapid Imaging of Architecture and Function. Sci Rep. 2016;6:22489
16. Park OK, Kwak J, Jung YJ, Kim YH, Hong H-S, Hwang BJ, Kwon S-H, Kee Y. 3D Light-Sheet Fluorescence Microscopy of Cranial Neurons and Vasculature during Zebrafish Embryogenesis. Mol Cells. 2015;38:975-981
17. Lowe KL, Finney BA, Deppermann C, Hagerling R, Gazit SL, Frampton J, Buckley C, Camerer E, Nieswandt B, Kiefer F, Watson SP. Podoplanin and CLEC-2 drive cerebrovascular patterning and integrity during development. Blood. 2015;125:3769-3777
18. Stegner D, vanEeuwijk JMM, Angay O, Gorelashvili MG, Semeniak D, Pinnecker J, Schmithausen P, Meyer I, Friedrich M, Dütting S, Brede C, Beilhack A, Schulze H. et al. Thrombopoiesis is spatially regulated by the bone marrow vasculature. Nat Commun. 2017;8:127
19. Lugo-Hernandez E, Squire A, Hagemann N, Brenzel A, Sardari M, Schlechter J, Sanchez-Mendoza EH, Gunzer M, Faissner A, Hermann DM. 3D visualization and quantification of microvessels in the whole ischemic mouse brain using solvent-based clearing and light sheet microscopy. J Cereb Blood Flow Metab. 2017;37:3355-3367
20. Jährling N, Becker K, Dodt H-U. 3D-reconstruction of blood vessels by ultramicroscopy. Organogenesis. 2009;5:227-230
21. Liebmann T, Renier N, Bettayeb K, Greengard P, Tessier-Lavigne M, Flajolet M. Three-Dimensional Study of Alzheimer's Disease Hallmarks Using the iDISCO Clearing Method. Cell Rep. 2016;16:1138-1152
22. Soderblom C, Luo X, Blumenthal E, Bray E, Lyapichev K, Ramos J, Krishnan V, Lai-Hsu C, Park KK, Tsoulfas P, Lee JK. Perivascular fibroblasts form the fibrotic scar after contusive spinal cord injury. J Neurosci. 2013;33:13882-13887
23. Silvestri L, Allegra Mascaro AL, Costantini I, Sacconi L, Pavone FS. Correlative two-photon and light sheet microscopy. Methods. 2014;66:268-272
24. Laurenzana A, Cencetti F, Serrati S, Bruno G, Japtok L, Bianchini F, Torre E, Fibbi G, Del Rosso M, Bruni P, Donati C. Endothelial sphingosine kinase/SPNS2 axis is critical for vessel-like formation by human mesoangioblasts. J Mol Med (Berl). 2015;93:1145-1157
25. Passaniti A, Taylor RM, Pili R, Guo Y, Long PV, Haney JA, Pauly RR, Grant DS, Martin GR. A simple, quantitative method for assessing angiogenesis and antiangiogenic agents using reconstituted basement membrane, heparin, and fibroblast growth factor. Lab Invest. 1992;67:519-528
26. Coltrini D, Di Salle E, Ronca R, Belleri M, Testini C, Presta M. Matrigel plug assay: evaluation of the angiogenic response by reverse transcription-quantitative PCR. Angiogenesis. 2013;16:469-477
27. Baker JHE, Huxham LA, Kyle AH, Lam KK, Minchinton AI. Vascular-specific quantification in an in vivo Matrigel chamber angiogenesis assay. Microvasc Res. 2006;71:69-75
28. Laib AM, Bartol A, Alajati A, Korff T, Weber H, Augustin HG. Spheroid-based human endothelial cell microvessel formation in vivo. Nat Protoc. 2009;4:1202-1215
29. Wang Y, Qiu J, Luo S, Xie X, Zheng Y, Zhang K, Ye Z, Liu W, Gregersen H, Wang G. High shear stress induces atherosclerotic vulnerable plaque formation through angiogenesis. Regen Biomater. 2016;3:257-267
30. Nam D, Ni C-W, Rezvan A, Suo J, Budzyn K, Llanos A, Harrison D, Giddens D, Jo H. Partial carotid ligation is a model of acutely induced disturbed flow, leading to rapid endothelial dysfunction and atherosclerosis. Am J Physiol Heart Circ Physiol. 2009;297:1535-43
31. Weyers JJ, Carlson DD, Murry CE, Schwartz SM, Mahoney WM JR. Retrograde perfusion and filling of mouse coronary vasculature as preparation for micro computed tomography imaging. J Vis Exp. 2012;60:e3740
32. Ludbrook J. A primer for biomedical scientists on how to execute model II linear regression analysis. Clin Exp Pharmacol Physiol. 2012;39:329-335
33. Yoldas A, Ozmen E, Ozdemir V. Macroscopic description of the coronary arteries in Swiss albino mice (Mus musculus). J S Afr Vet Assoc. 2010;81:247-252
34. Ehling J, Babickova J, Gremse F, Klinkhammer BM, Baetke S, Knuechel R, Kiessling F, Floege J, Lammers T, Boor P. Quantitative Micro-Computed Tomography Imaging of Vascular Dysfunction in Progressive Kidney Diseases. J Am Soc Nephrol. 2016;27:520-532
35. Chade AR, Kelsen S. Reversal of renal dysfunction by targeted administration of VEGF into the stenotic kidney: a novel potential therapeutic approach. Am J Physiol Renal Physiol. 2012;302:1342-50
36. Shami GJ, Cheng D, Braet F. Combined Multidimensional Microscopy as a Histopathology Imaging Tool. J Cell Physiol. 2017;232:249-256
37. Cebulla J, Kim E, Rhie K, Zhang J, Pathak AP. Multiscale and multi-modality visualization of angiogenesis in a human breast cancer model. Angiogenesis. 2014;17:695-709
38. Lang S, Müller B, Dominietto MD, Cattin PC, Zanette I, Weitkamp T, Hieber SE. Three-dimensional quantification of capillary networks in healthy and cancerous tissues of two mice. Microvasc Res. 2012;84:314-322
39. Pai VM, Kozlowski M, Donahue D, Miller E, Xiao X, Chen MY, Yu Z-X, Connelly P, Jeffries K, Wen H. Coronary artery wall imaging in mice using osmium tetroxide and micro-computed tomography (micro-CT). J Anat. 2012;220:514-524
40. Hamaoka-Okamoto A, Suzuki C, Yahata T, Ikeda K, Nagi-Miura N, Ohno N, Arai Y, Tanaka H, Takamatsu T, Hamaoka K. The involvement of the vasa vasorum in the development of vasculitis in animal model of Kawasaki disease. Pediatr Rheumatol Online J. 2014;12:12
41. Vandoorne K, Vandsburger MH, Raz T, Shalev M, Weisinger K, Biton I, Brumfeld V, Raanan C, Nevo N, Eilam R, Hemmings BA, Tzahor E, Harmelin A. et al. Chronic Akt1 deficiency attenuates adverse remodeling and enhances angiogenesis after myocardial infarction. Circ Cardiovasc Imaging. 2013;6:992-1000
42. Kerr BA, West XZ, Kim Y-W, Zhao Y, Tischenko M, Cull RM, Phares TW, Peng X-D, Bernier-Latmani J, Petrova TV, Adams RH, Hay N, Naga Prasad SV. et al. Stability and function of adult vasculature is sustained by Akt/Jagged1 signalling axis in endothelium. Nat Commun. 2016;7:10960
43. Gremse F, Stark M, Ehling J, Menzel JR, Lammers T, Kiessling F. Imalytics Preclinical: Interactive Analysis of Biomedical Volume Data. Theranostics. 2016;6:328-341
44. Richardson DS, Lichtman JW. Clarifying Tissue Clearing. Cell. 2015;162:246-257
45. Heilmann M, Neudecker S, Wolf I, Gubhaju L, Sticht C, Schock-Kusch D, Kriz W, Bertram JF, Schad LR, Gretz N. Quantification of glomerular number and size distribution in normal rat kidneys using magnetic resonance imaging. Nephrol Dial Transplant. 2012;27:100-107
46. Ehling J, Theek B, Gremse F, Baetke S, Mockel D, Maynard J, Ricketts S-A, Grull H, Neeman M, Knuechel R, Lederle W, Kiessling F, Lammers T. Micro-CT imaging of tumor angiogenesis: quantitative measures describing micromorphology and vascularization. Am J Pathol. 2014;184:431-441
47. Swoger J, Pampaloni F, Stelzer EHK. Imaging MDCK cysts with a single (selective) plane illumination microscope. Cold Spring Harb Protoc. 2014;2014:114-118
48. Underwood E. E. Stereology, or the quantitative evaluation of microstructures. J Microsc. 1969:161-180
49. Condeelis J, Segall JE. Intravital imaging of cell movement in tumours. Nat Rev Cancer. 2003;3:921-930
50. Gligorijevic B, Bergman A, Condeelis J. Multiparametric classification links tumor microenvironments with tumor cell phenotype. PLoS Biol. 2014;12:e1001995
51. Kienast Y, Baumgarten L von, Fuhrmann M, Klinkert WEF, Goldbrunner R, Herms J, Winkler F. Real-time imaging reveals the single steps of brain metastasis formation. Nat Med. 2010;16:116-122
52. Doerr J, Schwarz MK, Wiedermann D, Leinhaas A, Jakobs A, Schloen F, Schwarz I, Diedenhofen M, Braun NC, Koch P, Peterson DA, Kubitscheck U, Hoehn M. et al. Whole-brain 3D mapping of human neural transplant innervation. Nat Commun. 2017;8:14162
53. Sluimer JC, Kolodgie FD, Bijnens AP, Maxfield K. et al. Thin-walled microvessels in human coronary atherosclerotic plaques show incomplete endothelial junctions relevance of compromised structural integrity for intraplaque microvascular leakage. J Am Coll Cardiol. 2009;53:1517-1527
54. Le Dall J, Ho-Tin-Noe B, Louedec L, Meilhac O, Roncal C, Carmeliet P, Germain S, Michel J-B, Houard X. Immaturity of microvessels in haemorrhagic plaques is associated with proteolytic degradation of angiogenic factors. Cardiovasc Res. 2010;85:184-193
55. Kampschulte M, Brinkmann A, Stieger P, Sedding DG, Dierkes C, Bohle RM, Krombach G, Ritman EL, Langheinrich AC. Quantitative CT imaging of the spatio-temporal distribution patterns of vasa vasorum in aortas of apoE-/-/LDL-/- double knockout mice. Atherosclerosis. 2010;212:444-450
56. Langheinrich AC, Michniewicz A, Bohle RM, Ritman EL. Vasa vasorum neovascularization and lesion distribution among different vascular beds in ApoE-/-/LDL-/- double knockout mice. Atherosclerosis. 2007;191:73-81
57. Revermann M, Schloss M, Barbosa-Sicard E, Mieth A, Liebner S, Morisseau C, Geisslinger G, Schermuly RT, Fleming I, Hammock BD, Brandes RP. Soluble epoxide hydrolase deficiency attenuates neointima formation in the femoral cuff model of hyperlipidemic mice. Arterioscler Thromb Vasc Biol. 2010;30:909-914
58. Persy V, Postnov A, Neven E, Dams G, Broe M de, D'Haese P, Clerck N de. High-resolution X-ray microtomography is a sensitive method to detect vascular calcification in living rats with chronic renal failure. Arterioscler Thromb Vasc Biol. 2006;26:2110-2116
59. Vries MR de, Quax PHA. Plaque angiogenesis and its relation to inflammation and atherosclerotic plaque destabilization. Curr Opin Lipidol. 2016;27:499-506
Author contact
![]() Corresponding and joined senior authors: Institut für Kardiovaskuläre Physiologie, Fachbereich Medizin der Goethe-Universität, Theodor-Stern Kai 7, 60590 Frankfurt am Main, Germany. Tel.: +49-69-6301-85321; Fax.: +49-69-6301-7668; Email: brandesuni-franfurt.de or schuermannuni-frankfurt.de
Corresponding and joined senior authors: Institut für Kardiovaskuläre Physiologie, Fachbereich Medizin der Goethe-Universität, Theodor-Stern Kai 7, 60590 Frankfurt am Main, Germany. Tel.: +49-69-6301-85321; Fax.: +49-69-6301-7668; Email: brandesuni-franfurt.de or schuermannuni-frankfurt.de