Theranostics
13.3
Impact Factor
- Current Issue
- Advance Articles
- Volume 16; 2026
- Volume 15; 2025
- Volume 14; 2024
- Volume 13; 2023
- Volume 12; 2022
- Archive
- Cover Images
- Cover Suggestion
- Special Issues
Top
Introduction
Materials and Methods
Results
Discussion
Conclusions
Abbreviations
Acknowledgements
Supplementary Material
References
Introduction
Materials and Methods
Results
Discussion
Conclusions
Abbreviations
Acknowledgements
Supplementary Material
References
International Journal of Biological Sciences
International Journal of Medical Sciences
 Global reach, higher impact

Theranostics 2017; 7(19):4894-4908. doi:10.7150/thno.20820 This issue Cite
Research Paper
Cell-cycle-specific Cellular Responses to Sonoporation
Pengfei Fan1*, Yi Zhang1*, Xiasheng Guo1*, Chenliang Cai1, Maochen Wang1, Dongxin Yang1, Yiran Li2, Juan Tu1 ![]() , Lawrence A. Crum3, Junru Wu4, Dong Zhang1,5
, Lawrence A. Crum3, Junru Wu4, Dong Zhang1,5 ![]()
1. Key Laboratory of Modern Acoustics (Nanjing University), Ministry of Education, Nanjing University, Nanjing 210093, China;
2. Collaborative Innovation Center of Advanced Microstructures, National Laboratory of Solid State Microstructure, Department of Physics, Nanjing University, Nanjing 210093, China.
3. Center for Industrial and Medical Ultrasound, University of Washington, Seattle, WA 98105, USA;
4. Department of Physics, University of Vermont, Burlington, VT05405, USA.
5. The State Key Laboratory of Acoustics, Chinese Academy of Science, Beijing 10080, China.
* These authors contributed equally to this work.
Received 2017-5-1; Accepted 2017-10-4; Published 2017-11-3
Citation:
Fan P, Zhang Y, Guo X, Cai C, Wang M, Yang D, Li Y, Tu J, Crum LA, Wu J, Zhang D. Cell-cycle-specific Cellular Responses to Sonoporation. Theranostics 2017; 7(19):4894-4908. doi:10.7150/thno.20820. https://www.thno.org/v07p4894.htm
Other stylesAbstract

Microbubble-mediated sonoporation has shown its great potential in facilitating intracellular uptake of gene/drugs and other therapeutic agents that are otherwise difficult to enter cells. However, the biophysical mechanisms underlying microbubble-cell interactions remain unclear. Particularly, it is still a major challenge to get a comprehensive understanding of the impact of cell cycle phase on the cellular responses simultaneously occurring in cell membrane and cytoskeleton induced by microbubble sonoporation.
Methods: Here, efficient synchronizations were performed to arrest human cervical epithelial carcinoma (HeLa) cells in individual cycle phases. The, topography and stiffness of synchronized cells were examined using atomic force microscopy. The variations in cell membrane permeabilization and cytoskeleton arrangement induced by sonoporation were analyzed simultaneously by a real-time fluorescence imaging system.
Results: The results showed that G1-phase cells typically had the largest height and elastic modulus, while S-phase cells were generally the flattest and softest ones. Consequently, the S-Phase was found to be the preferred cycle for instantaneous sonoporation treatment, due to the greatest enhancement of membrane permeability and the fastest cytoskeleton disassembly at the early stage after sonoporation.
Conclusion: The current findings may benefit ongoing efforts aiming to pursue rational utilization of microbubble-mediated sonoporation in cell cycle-targeted gene/drug delivery for cancer therapy.
Keywords: Microbubble-mediated sonoporation, cell cycle, membrane permeabilization, cytoskeleton disassembly, bubble-cell-interaction
Introduction
Malignant tumor (cancer) is currently one of the leading causes of human mortality. In the past decades, increasing number of research and clinical activities have made substantial progress in gene/drug targeted delivery. It is usually achieved by the introduction of genes, proteins or chemo-/radio-active therapeutic drugs to kill tumor cells. However, successful cancer treatment remains challenging due to the limited efficacy of the current methodology of gene/drug delivery.1-3 To overcome these obstacles, various approaches have been explored to maximize localized gene/drug delivery to tumors while minimizing their systemic toxicity.4-5 Taking its advantages of non-invasiveness, non-ionization, low cost, and accurate targeting of deeply seated organs, microbubble-mediated sonoporation has been widely acknowledged as a promising approach to realize spatiotemporally controlled gene/drug delivery.6,7 Through the bubble-cell interactions, Ultrasound (US)-induced sonoporation may transiently disrupt the cell membrane to induce a temporary increase in the membrane permeability, which can benefit intracellular uptake of membrane-impermeable compounds into cells.8-16 More importantly, without the use of viral vectors, microbubble-mediated sonoporation can effectively facilitate the site-specific transfer of various bioactive agents with lower drug dose, so that desired therapeutic effect can be achieved with lower cytotoxicity.17,18 Therefore, the controlling and optimization of sonoporation have become a key focus in the application of therapeutic ultrasound, and have attracted broad interests in various clinical fields including targeted gene/drug delivery, cancer treatment, blood-brain-barrier opening, neurological diseases treatment, immuneological therapy, and so on.19-24
Previous studies have shown that sonoporation, as a biophysical process, may result in various cellular responses, such as cell membrane disruption,10,25 modulation of intracellular calcium ion signals10,24 and membrane potential,26 and initiation of a sequence of cytomechanical events at both the membrane and nuclear level.13,27. Meanwhile, many efforts have been made to investigate specific aspects that may affect sonoporation outcomes, such as US parameters17,25,28 and physical/chemical properties of microbubbles or therapeutic agents.11,17,29-33 Differing from above-mentioned studies, the current work focused on the impact of the bio-molecular states of targeted cells (viz., cell cycle phases), and underlying mechanism involved in cell cycle-phase-dependence of cellular responses in cell membrane and cytoskeleton induced by microbubble-mediated sonoporation.
The cell cycle, consisting of four phases of G1, S, G2 and M (mitosis), is a sequential event that leads to cell division and DNA replication.34 Normally, immediately after cell division, cells undergo an apparently quiescent stage referred to as G1, during which the cell starts to increase its size, copies organelles and makes the molecular building blocks necessary in later steps. After G1-phase, the cell will enter the S-phase, in which it continues to grow, replicates DNA in the nucleus and duplicates the centrosome organized by microtubule structures. Then, the cell proceeds into the G2-phase to make final preparations (e.g., DNA reorganization and repairs) for the process of mitosis. A cell progressing into the M-phase will divide its copied DNA and cytoplasm to split into two daughter cells, before re-entering the G1-phase.34 A dysregulation of cell cycle components may result in the formation of tumors.35 In previous studies, many efforts have been made to synchronize cells in particular cycle phases, so that tumor growth can be suppressed by elevating the tumor cellular uptake of anticancer drugs, and/or achieving cell-cycle arrest, apoptosis, and senescence.36-41 For instance, it was reported that the cell uptake ability of nanoparticles might be sensitive to the cell cycle phases40, and the G2/M-phase retention effect of docetaxel could improve the nanoparticle delivery into tumors.41 Those results suggested that the interactions between therapeutic nanoparticles and cells might exhibit a cycle-phase-dependent manner, because the cellular structures (e.g. membrane protein expression and cytoskeleton organization) might vary with cell cycle phases, which could not only initiate different cell functionalities but also modify cell mechanical properties, especially cell stiffness.42,43 Since the mechanical bioeffects of microbubble-mediated sonoporation are fundamentally stimulated by the physical perturbation of cellular structures,44,45 it is reasonable to hypothesize that, besides the properties of US waves, microbubbles and therapeutic agents, the cycle-phase-specific properties of cells should also play an important role in cellular responses to the sonoporation process.
In the present work, human cervical epithelial carcinoma (HeLa) cells, whose α-tubulin cytoskeleton was labeled by incorporation of a green fluorescence protein (GFP)-α-tubulin fusion protein (referred as GFP-α-tubulin HeLa cells), were synchronized at different cell cycle phases of G1, S and G2/M. The morphology, size and stiffness of synchronized cells were evaluated based on fluorescence microscopy observations and atomic force microscopy (AFM) assessments. The instantaneous cellular responses (e.g., membrane permeabilization and cytoskeleton disassembly) activated by microbubble-mediated sonoporation were visualized by the integrated US exposure and real-time fluorescent microscopic imaging system. Meanwhile, a finite element model was constructed to simulate the bubble-fluid-cell interaction and provide possible interpretation for the experimental results. The present studies would be beneficial for better understanding the impact of cell cycle phase on the mechanical properties and microbubble sonoporation-induced cellular responses of HeLa cells, as well as the underlying biophysical mechanisms.
Materials and Methods
Chemicals and materials
Gibco's RPMI medium 1640 (Carlsbad, CA, USA) with fetal bovine serum (FBS; Sigma-Aldrich, St. Louis, MO, USA), penicillin/streptomycin (Gibco Inc., Carlsbad, CA, USA), Trypsin-EDTA (Gibco Inc., Carlsbad, CA, USA), phosphate buffer solution (PBS; Gibco Inc., Carlsbad, CA, USA) and dimethyl sulfoxide (DMSO; Amresco Inc., Solon, OH, USA) were used for cell culture. Lovastatin (M2147, Sigma-Aldrich, St. Louis, MO, USA), nocodazole (M1404, Sigma-Aldrich, St. Louis, MO, USA) and L-mimosine (M0253, Sigma-Aldrich, St. Louis, MO, USA) were used to synchronize cells in different cycle phases. Propidium Iodide (PI; P4170, Sigma-Aldrich, St. Louis, MO, USA) was used to indicate the variation in the cell membrane permeability. SonoVue® microbubbles (Bracco diagnostics Inc., Geneva, Switzerland) with a mean radius of ~1.5 μm were used as sonoporation agents. According to the manufacturer's instruction, immediately before the experiments, the vial of SonoVue® was vented with a sterile 18-gauge needle, followed by the addition of 5-ml PBS. Finally, ultrasound contrast agent (UCA) microbubbles with a concentration of 2-5×10⁸ microbubbles/mL were evenly distributed by inversion agitation of the vial.
Cell lines and cell culture
HeLa cell line, one type of human papillomavirus (HPV)-positive cervical cancer cell lines, was one of the most commonly used human cell lines in cancer research.7,39 In the present work, HeLa cells whose microtubules cytoskeleton was labeled by incorporation of a GFP-α-tubulin fusion protein46 were provided by the medical school at Nanjing University, which made it possible to perform real-time visualization on the variation of microtubule cytoskeleton arrangement directly, and the 3rd to 5th passage of GFP-α-tubulin HeLa cells were used in the experiments. Unsynchronized cells were cultured in RPMI medium 1640 containing L-glutamine, supplemented with 10% fetal bovine serum and 1.5% penicillin-streptomycin, at 37 °C and 5% CO2. Cell cultures were passaged by adding trypsin-EDTA (1 mL, 0.25%) after which gentle shaking was applied to detach the cells from the culture dish surface. Trypsin was deactivated by the addition of 10-mL RPMI 1640 and cells were harvested by centrifugation.
HeLa Cell Synchronization in G1 Phase
HeLa cells were firstly cultured in the regular way. Then, cells at 50% confluence were incubated with fresh media, and lovastatin was added with a final concentration of 20 μM. After 24 h, HeLa cells synchronized at the G1 phase were harvested for subsequent analyses.47
HeLa Cell synchronization in the S phase
S-phase synchronization of HeLa cells was performed by blocking G1/S transition with L-mimosine.48 HeLa cells were seeded and cultured in the regular way for 48 h. Then, after harvested by centrifugation, HeLa cells were incubated in the culture medium containing L-mimosine with a final concentration of 200 μM to achieve G1/S transition blocking. After 16 h, the chemical block was released by decanting the culture medium and washing the cells twice with PBS. Finally, HeLa cells were supplemented with fresh culture medium and continuously cultured for another 6 h to realize S-phase synchronization.
HeLa Cell synchronization in the G2/M phase
As the mitotic (M) phase is a relatively short period in the cell cycle, it is difficult to synchronize cells exactly in the G2 or M phase. Therefore, synchronization using nocodazole was performed to arrest HeLa cells in the G2/M phase.49,50 Cells were cultured in regular media for 6 h to achieve cell adherence before fresh culture medium containing 2-uM nocodazole was added, and then cells were further incubated for 18 h. Following three washes with PBS containing DMSO, HeLa cells arrested in G2/M phase could be obtained for subsequent experiments.
Cell cycle analysis
Flow cytometry analysis was adopted to assess the synchronization efficiency of HeLa cells. In brief, synchronized cells were rinsed with 10-ml PBS and fixed in 75% ethanol overnight at -20 °C. Then, cells were resuspended and collected by centrifugation at 900 rpm (viz., 300g) for 5 min. Following incubation for 30 min at 37°C with the staining solution containing 50 μg/mL PI and 0.2 mg/mL RNAse A (R5503, Sigma-Aldrich, St. Louis, MO, USA), the stained cells were then tested by a flow cytometry (FACSCanto II, BD, NJ, USA) afterwards.50 At least 10,000 HeLa cells were analyzed for each sample, and data analysis of cell distributions in different cell cycle phases was performed using the MODFIT LT software (Verity Software House Inc., Augusta, ME, USA).
3-D topography observation of HeLa cells based on AFM technology
AFM technology offers a useful tool for direct measurements of cell 3-D surface topography and elastic property.42,51-53 For the purpose of 3-D topography, several glass coverslips were put into the culture petri dish before adding the synchronization agents, so that the synchronized HeLa cells would grow on these glass coverslips. Immediately prior to imaging, 10 mL of 1% glutaraldehyde was added for 10 minutes to fix HeLa cells on the glass substrate. Then, cells were washed twice with PBS, and imaged by an AFM (Nanowizard II, JPK, Berlin, Germany) in a PBS environment. An optical transmission microscope (IX81, Olympus, Japan) was used with the AFM to conveniently select the cell of interest and accurately position the cantilever tip above the cell surface. The 3-D topography images were acquired in tapping mode using a ScanAsyst-Air cantilever (a spring constant of ~0.4 N/m; Bruker Nano Inc., Camarillo, CA, USA) with a scanning size of 50 × 50 um2 and a scanning rate of 0.5 Hz.51 All measurements were performed at room temperature, and at least 8 images were obtained for HeLa cells synchronized at each phase.
Stiffness assessment of HeLa cells based on AFM technology
Local elastic properties of the HeLa cells were evaluated by AFM according to the force-deformation measurements taken under cantilever tip indent conditions.53 As described above, the synchronized cells were cultured on glass coverslips, and the interrogations of cell stiffness were performed in a pre-warmed (37 ºC) PBS environment following the procedures introduced elsewhere.53,54 In the experiments, the time of force-deformation interrogation on each glass coverslip was limited in 20 min, so that the cell viability could be maintained and the impact of PBS environment on the cell stiffness could be ignored.. Force-deformation measurements were performed using AFM equipped with a silicon nitride tip mounted on a silicon nitride cantilever (MLCT-D; Bruker Nano Inc., Camarillo, CA, USA) with a spring constant of about 0.03 N/m. The cantilever has a pyramid tip with a nominal radius of 20 nm and a half side-angle of about 17.5º. Prior to each force-deformation measurements, a corresponding calibration was performed on the glass substrate to avoid artifacts associated with possible contamination of the tip surface. Since the stiffness measurement based on AFM tip indentation mainly provided the elastic information on the cell membrane that might vary point by point over the entire cell surface, the measured result might be dependent on the position where the cantilever tip was loaded. Therefore, to ensure experimental reproducibility, at least 10 indentation curves were obtained on different sites for each sample cell with a constant velocity of 3 μm/s and a sample rate of 10 kHz, and at least 100 synchronized cells were interrogated for each cycle phase.
After measurements, the elasticity modulus of HeLa cells was calculated based on the Hertz model which describes the elastic deformation of two bodies in contact under load.53 In the Hertz model, by assuming the cantilever tip has a shape of pyramid with a much larger elastic modulus than the sample, the force as a function of indentation can be approximately described by the following equation.53,55
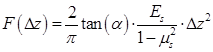
Where μs and Es are the Poisson ratio and elastic modulus of the sample, respectively, F is the measured compression force applied to the tested sample by the cantilever, Δz is indentation depth of the tip,and α is the half open-angle of the tip. The Poisson ratio was set to be 0.5 in this work, according to a previous report.52,53
In situ live microscopy of sonoporation-induced variations in cell membrane and cytoskeleton
As schematically demonstrated in Figure 1A, an integrated experimental system was used to simultaneously observe the cellular responses induced by microbubble-mediated sonoporation. In the experiments, an arbitrary waveform generator (33250A, Agilent, Palo Alto, CA, USA) was used to supply a single-burst 1-MHz sinusoidal signal with a constant pulse length of 20 cycles. Amplified by an RF power amplifier (2200L, Electronics Innovation, Rochester, NY, USA) with a fixed gain of 50 dB, the signal was used to drive a single-element focused transducer (a focal length of 4.826 cm; A314S, Olympus Panametrics-NDT, Waltham, MA, USA). A fluorescence microscope (BX53, Olympus, Shinjuku, Tokyo, Japan) was used to simultaneously observe the changes in the cell membrane and cytoskeleton at a single-cell level. The US waves were transmitted to an OptiCell chamber (Nunc, Rochester, NY, USA) through the coupling provided by a customized cylindrical polyacrylamide gel with a diameter of 35 cm. The height of gel was adjusted to ensure the US wave was exactly focused on the top layer of the OptiCell chamber. Prior to the experiment, the transducer was aligned with the field of view of the microscope objective. The in situ acoustic peak negative pressure at the focus was calibrated to be 300 kPa, by using the NTR needle hydrophone (TNU001A, NTR Systems Inc., Seattle, WA, USA).
GFP-α-tubulin HeLa cells were used in the present work, meaning that cells with an intact microtubule network would stably express green fluorescence. Meanwhile, the intracellular fluorescence intensity of the intercalating agent PI56 was used to indicate the change in cell membrane permeabilization resulting from acoustic sonoporation.9,10,13,57 Therefore, in situ observation and quantitative evaluation of sonoporation-induced cellular responses in the cell membrane and cytoskeleton could be achieved.
In the experiments, HeLa cells were cultured on the top polystyrene membrane of an OptiCell chamber (Nunc, Rochester, NY, USA) to allow microbubbles to rise against the cell membrane. Cell synchronization processes were performed following the methods described above. All the experiments were performed for cell cultures with at least 50% confluence. Before US exposure and fluorescence imaging, diluted SonoVue microbubbles and PI were added into the OptiCell chamber with a final concentration of 6×10⁶ bubbles/mL and 0.25 mg/L, respectively. Then, the OptiCell chamber was placed on the stage of the fluorescence microscope. As shown in Figure 1A, the real-time fluorescence imaging system employed a monochromator (Polychrome V, TILL Photonics, Munich, Germany) to repeatedly filter light from a 150-W xenon lamp at the various excitation wavelengths (476 nm and 551 nm). The excitation light was directed through a 60× oil immersion lens and the light subsequently emitted from the cells was passed through a polychroic filter with passbands in the red and green. MetaFluor software (Molecular Devices, Sunnyvale, CA, USA) was used to acquire a series of 16-bit grayscale photomicrographs with a CCD camera (Zyla sCMOS, Andor Technology, Belfast, Northern Ireland, UK) at a resolution of 2560 × 2160. The imaging protocol is schematically illustrated in Figure 1B. Following this protocol, a total of 50 viable synchronized cells were independently evaluated, each with one adjacent bubble. The cell viability was evaluated with referring to the standards adopted in previous studies (the detailed description can be found in the Supplementary Information I).9 Finally, the fluorescence intensity levels of GFP and PI were analyzed using Image Pro Plus (Media Cybernetics Inc., Bethesda, MD, USA).
Figure 1
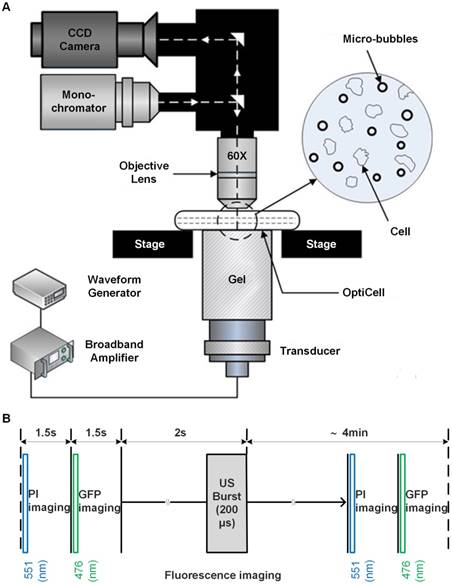
Ultrasound exposure apparatus coupled with real-time in situ fluorescence imaging system. (A) The schematic diagram of the experimental system; and (B) schematic illustration of fluorescence imaging protocol adopted to simultaneously visualize the sonoporation-induced variations in cell membrane permeabilization and cytoskeleton arrangement. The excitation wavelengths of GFP and PI are 476 nm and 551 nm, respectively.
Statistical analysis
Data are presented as means ± standard deviation. One-way analysis of variance (ANOVA) and Tukey's post hoc test were used to compare data among groups using Origin Software (OriginLab Co. Northampton, MA, USA). A p-value less than 0.05 was considered a statistically significant difference.
Results
Cell cycle synchronization
To investigate the cell cycle-phase-dependence of cellular responses to microbubble-mediated sonoporation, GFP-α-tubulin HeLa cells were synchronized in G1-, S- and G2/M-phase by using lovastatin,47 L-mimosine,48 and nocodazole,49,50 respectively. Fluorescence microscopic images were acquired firstly to observe the cytoskeleton arrangements of HeLa cells synchronized in different phases. Then, flow cytometry assessment was applied to evaluate cell synchronization efficiency.
Figure 2A illustrates a typical series of cell cycle sequence. The distribution of the α-tubulin cytoskeleton of HeLa cells synchronized in G1-, S-, and G2/M-phase was visualized by fluorescence microscopy. As shown in Figure 2B, cells in the G1 phase have the smallest area with a densely packed α-tubulin matrix and multiple strain branches extending in different directions. In the S-phase, the cell enlarges and its microtubules cytoskeleton is generally organized into a loose network that is more spread out through the cell cytoplasm. The reorganization of α-tubulin cytoskeleton and nuclear division could be observed for cells in the G2/M-phase, in which the cells tend to form a rounder shape with condensed α-tubulin microtubules in the perinuclear region. Meanwhile, their area may increase to more than twice the initial volume in the G1-phase.
Figure 2
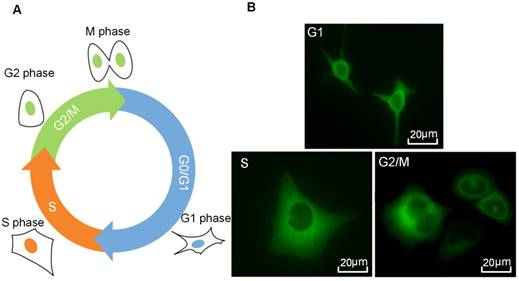
Cell cycle phases of HeLa cells. (A) A series of cell cycle sequence. Cells in different phases are distinguished by blue, orange and green nuclei for the G1, S and G2/M phases, respectively. (B) Fluorescence microscopic observations of α-tubulin cytoskeleton distribution of HeLa cells synchronized in the G1, S, and G2/M phases (green color indicates GFP-α-tubulin cytoskeleton network).
Figure 3 illustrates the results of cell cycle synchronization analyses. Based on the flow cytometry assessment, the proportions of cells in different cell cycle phases can be distinguished by the amount of cellular DNA content, and cells in the G2/M-phase have approximately twice the DNA fluorescence intensity of G1-phase cells (Figure 3A). In Figure 3B, percentages of cells in individual cycle phases are illustrated for the control group, as well as cells synchronized at G1-, S- and G2/M-phase after the treatment of lovastatin, L-mimosine and nocodazole, respectively. It shows that, the control group (viz., unsynchronized cells) contains a mixture of cells in different cycle phases, within which a small part of cells are in the G2/M-phase (about 4.57±3.58%), while the percentages of cells in the G1- and S-phase are comparable to each other (approximately 49.26±6.37% and 46.17±4.46%, respectively). However, 85.93±1.9% cells can be synchronized in the G1-phase by lovastatin blocking. Following L-mimosine treatment, 87.37±3.43% of HeLa cells are arrested in the S-phase, which is a markedly greater proportion than that in the unsynchronized group. The application of nocodazole enhances the percentage of cells in the G2/M-phase from 4.57±3.58% (unsynchronized group) to 71.27±1.36% (synchronized group). Although it seems the yield and purity of G2/M-synchronization are slightly lower than G1- and S-synchronization, the percentage of cells in G2/M-phase is significantly raised by ~15 folds compared with the control group, indicating a successful synchronization.
Topography observation and stiffness assessment of HeLa cells synchronized in different phases
Some typical topography images of HeLa cells synchronized in G1-, S- and G2/M-phase are shown in Figure 4A. Multi-branched cells can be clearly observed in the G1-phase with the smallest size. S-phase Cells are more spread out, and cells become round up gradually in the G2/M-phase. The typical morphologies and areas observed for cells synchronized in different phases (Figure 4A) are similar to those illustrated in Figure 2B. By analyzing the height profiles extracted from the AFM topographic images (Figure 4), it reveals that the maximum height of cells synchronized at G1-phase (6.28±0.22 μm, n = 8) is significantly higher than that of cells in the S-phase (3.91±0.68 μm, n = 8) and G2/M-phase (4.33±0.70 μm, n = 10), respectively. Cells in the S-phase have the lowest height, because their cytoskeleton microstructures are more spreading on the substrate. Meanwhile, by applying MatLab imaging processing analyses to both fluorescence microscopic images and the vertical view of the 3-D AFM topography images, the cross-section areas of cells synchronized in individual phases can be estimated and plotted in Figure 4C, which indicates G1-phase cells have the smallest area. Furthermore, the volumes of synchronized cells were also estimated by integrating the AFM height profiles within the scanned cell regions (Figure 4D), and the results indicate that the G1-phase cells also have the smallest volume.
Local elastic property (viz. the stiffness) of HeLa cells synchronized in different cycle phases was interrogated under AFM contact mode. Typical force-deformation curves measured for HeLa cells synchronized in different phases are illustrated in Figure 5A. The corresponding elastic modulus of cells was calculated by applying Hertz model analyses to the force-deformation curves.53 As shown in Figure 5B, the statistical analysis results reveal that significant differences are observed among groups, with G1-phase cells having the highest average elastic modulus of 1.890±0.173 kPa, while S-phase cells having the lowest value of 0.643±0.221 kPa.
Cellular responses in the membrane permeabilization and cytoskeleton arrangement induced by microbubble-mediated sonoporation
Figure 3
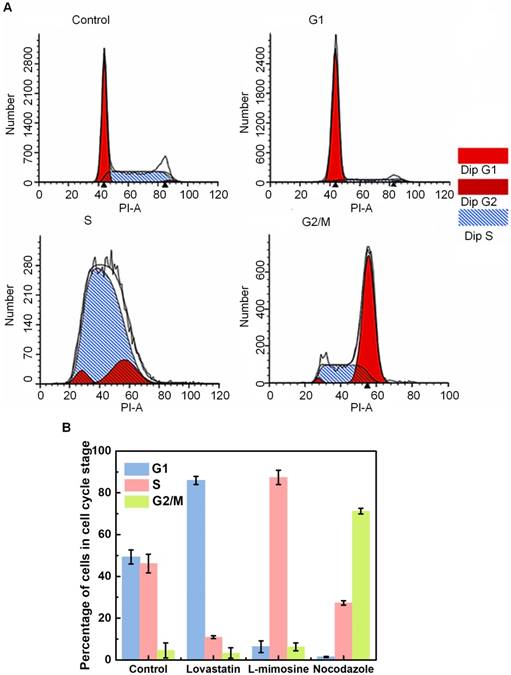
Cell cycle synchronization analysis done by flow cytometry. (A) Flow cytometry histograms indicating the distribution of the DNA content in HeLa cells in the control group (viz., unsynchronized group), and cells synchronized at the G1, S and G2/M phases following the treatment of lovastatin, L-mimosine and nocodazole, respectively. The y-axis represents the number of cells, and the “PI-A” in the x-axis represents the fluorescence intensity of PI that is used to assess the amount of cellular DNA content; and (B) Percentage of cells in individual cycle phases in the control group, and cells synchronized at the G1, S and G2/M phases after lovastatin, L-mimosine and nocodazole treatment, respectively.
Here, an integrated experimental system (Figure 1) was specially designed to perform real-time in situ observation on the dynamic changes in cellular structures (e.g., cell membrane and cytoskeleton) triggered by single bubble-mediated sonoporation. As mentioned above, the microtubules cytoskeleton of HeLa cells investigated in the present work was labeled by GFP-α-tubulin fusion protein, so that viable cell would express green fluorescence, unless the cell was lethally damaged to induce irreversible disassembly in their α-tubulin network. Meanwhile, the intracellular fluorescence intensity of the intercalating agent PI was used to indicate the change in cell membrane permeabilization resulting from acoustic sonoporation.
Figure 6A illustrates a sample of localized spatiotemporal evolution of α-tubulin cytoskeleton disassembly (represented by the decay of green fluorescence) and intracellular uptake of PI (indicated by the enhancement of red fluorescence). Two adjacent cells are shown in Figure 6A, with a microbubble next to cell 2. Prior to US exposure, apparent α-tubulin microtubules cytoskeleton can be observed inside both cells with intact cell membranes. Synchronous with the mechanical action of microbubble-mediated sonoporation triggered by US exposure fired at T=0 s, an immediate disruption of the α-tubulin microtubules was observed right at the position where the bubble was located, accompanied by rapid PI uptake into the cytoplasm through the pre-exposure bubble site. Then, the local loss of α-tubulin microtubules gradually propagated to other parts of the microtubules cytoskeletal network, and the green fluorescence almost vanished in the whole region of cell 2 at T=230 s after the onset of sonoporation. Meanwhile, PI was observed to diffuse into the rest areas of cell 2. For comparison, without an adjacent microbubble, cell 1 was virtually unaffected by US exposure, since no PI uptake and GFP decay was observed.
By analyzing the time-lapse sequence of PI and GFP fluorescence images, the temporal evolution curves of normalized GFP and PI fluorescence intensities are illustrated in Figures 6B and 6C, for sonoporated cells synchronized at the G1-, S- and G2/M-phase, respectively. Meanwhile, the variations of GFP and PI fluorescence in the closet non-sonoporated cells (e.g., cell 1 shown in Figure 6A) were also analyzed as a comparison. No significant fluorescence changes can be observed for non-sonoporated cells (Figures 6B and 6C), which indicates the absence of obvious α-tubulin cytoskeleton disassembly and PI uptake. For the sonoporated cells, at the early state after sonoporation (e.g., t < 20 s), S-phase cells exhibits the fastest GFP decay rate and PI growth rate while the G1-phase cells demonstrate the slowest GFP decay and PI enhancement, which suggests S-phase cells might undergo the fastest α-tubulin microtubule disassembly and the greatest membrane permeability enhancement while the instantaneous cellular responses in G1-phase cells should be the least susceptible to single-site microbubble sonoporation. Then, both the α-tubulin cytoskeleton disassembly and PI uptake rates in sonoporated cells tend to slow down with the time lapse. Particularly, at the late stage after sonoporation (e.g., t > 60 s), the S- and G2/M-phase cells demonstrate comparable α-tubulin cytoskeleton disassembly rate and the PI uptake rates of synchronized cells would be re-ranked as G2/M > S > G1, which are different from the trends exhibited in the early stage after sonoporation. These phenomena will be discussed later in the following section.
The detailed cell-cycle-dependent cellular responses induced by microbubble-mediated sonoporation can be visualized in the real-time recordings provided in Supplementary Videos S1-S3, which are representative samples of temporal variations in the membrane permeabilization and cytoskeleton disassembly of HeLa cells synchronized in G1-, S- and G2/M-phase, respectively.
Numerical simulations of single bubble-cell interactions
A theoretical model was established to simulate single bubble-cell interactions, with referring to the coated-bubble model proposed by de Jong et al.58,59 and the finite element model used for simulating the dynamic interactions between coated-bubble and elastic vessel wall.60,61 The dynamic mechanism of a single microbubble oscillating near an elastic cell membrane in a viscous fluid involves the interaction of a coupled gas-fluid-solid system, which could be modeled by using Comsol Multiphysics 5.0 software. Figure 7A shows the geometry of the bubble-fluid-cell system and the region segmentation. Figure 7B illustrates the relative position of bubble to cell membrane in the coupled system. As the gas-fluid and fluid-solid boundaries may deform during the interaction, an arbitrary Lagrangian-Eulerian approach was applied to deal with the moving meshes. To reduce computation time, the system was treated as a 2D model generated from a 3D axisymmetric geometry structure. The detailed description about this finite element model can be found in the Supplementary Information II.
Since the cell membrane was treated as an elastic wall, the bubble-cell interaction would impose shear stress on the cell membrane through the fluid media, which might cause elastic deformation on the cell membrane, and the maximum shear stress should be obtained at the closest point to the bubble (viz., point C). Figures 8A and 8B illustrate the microstreaming velocity field and the deformation of the cell membrane layer induced by a bubble oscillating near the elastic cell membrane. Figure 8C shows the maximum microstreaming shear stress exerted on the membrane of cells (at point C) with various elastic modulus. It is clear that the maximum shear stress exerted on the cell membrane will quickly decrease with the increasing cell elastic modulus.
Discussion
According to AFM mechanical assessments and real-time fluorescence observations, the results presented here showed that both the cell morphology and mechanical property would change with the cell cycle progression, which could result in cell-cycle-specific instantaneous cellular responses (e.g., membrane permeabilization and cytoskeleton disassembly) to single bubble-mediated sonoporation. Meanwhile, the mechanism involved in cell-cycle-dependence of sonoporation-induced cellular responses was further explored based on dynamic model simulations.
As part of the cytoskeleton network, microtubules are long, hollow cylinders composed up of polymerized α- and β-tubulin dimers, which can be found throughout the cytoplasm in the cell.43,46,62 By taking functions including mechanical support, cytoplasm organization, transport, motility and chromosome segregation, the microtubule cytoskeleton plays a vital role in cell division and is crucial for many cellular events, thus rendering it a highly attractive target for anticancer drug development62 Here, the treatments of lovastatin, L-mimosine and nocodazole were applied to synchronize GFP-α-tubulin HeLa cells in the G1-, S- and G2/M-phase with relatively homogeneous cell populations of 85.93±1.9%, 87.37±3.43% and 71.27±1.36%, respectively, which indicated that successful cell cycle synchronization could be achieved by the application of particular chemicals.
Previous literatures have reported that the progression through the cell cycle involves significant rearrangement of cytoskeleton system, and the changes in cytoskeleton structure may affect intrinsic mechanical properties of cells.42,43 Here, the application of AFM technology provides quantification analyses for the maximum height and stiffness of cells in specific phases (Figures 4B and 5). Typically, the elastic modulus measured for cells synchronized in G1-, S- and G2/M-phase are 1.890±0.173 kPa, 0.643±0.221 kPa and 0.955±0.272 kPa, respectively. The results suggest that G1-phase cells are markedly stiffer than cells in S- and G2/M-phase, which might be associated with the remodeling of cytoskeleton network in different phases. As confirmed by fluorescence microscopy (Figure 2B) and AFM topography imaging (Figure 4A), the cell cycle transition does lead cells into morphology change and cytoskeleton remodeling. In general, a condensed cytoskeleton matrix can be observed to assemble around the nuclei of G1-phase cells, with multiple strain branches extending in different directions. In the S-phase, the cell enlarges and the cytoskeletal structures tend to spread out to make the cell appear flatter. For G2/M-phase cells preparing for division, their cytoskeleton networks tend to round up around the cell nuclei and keep increasing their size. It was reported recently that, for melanoma cells undergoing cisplatin treatment, cytoskeletal rearrangement would be promoted to enlarge the cell size and reduce the cell height, which in turn attenuated cell modulus elasticity.63 This finding may provide a support for the current observation that the G1-phase HeLa cells are much stiffer than cells in S- or G2/M phases, because the changes in the morphology and cytoskeleton make G1-phase cells have the greatest height and the smallest size (Figure 4B).
The spatiotemporal evolution of cellular responses in the cell membrane and cytoskeleton activated by microbubble-mediated sonoporation was simultaneously visualized using an integrated US exposure and real-time fluorescent microscopic imaging system. The simultaneous occurrence of intracellular PI uptake and GFP decay is shown in Figure 6, which suggests that, together with the enhancement of membrane permeability, α-tubulin cytoskeleton disassembly can also be triggered by microbubble-induced sonoporation. It was observed that single-site sonoporation could lead to the rupture of F-actin network adjacent to the perforation site.13 Comparing with the F-actin filaments that usually located close to the cell membrane, α-tubulin microtubules are typically located in deeper portions of the cell cytoplasm. Therefore, our results suggested that sonoporation-induced mechanical effects might get to deeper region of the cell, rather than just exerting on the thin-layer membrane structure.
The fluorescent analyses illustrated in Figures 6B and 6C suggested, for non-sonoporated cells, no significant variations could be observed in their cell cytoskeleton and membrane. However, for cells undergoing single-site sonoporation, cellular responses (e.g., cytoskeleton disassembly and membrane permeability enhancement) could be immediately triggered by even a single-shot US exposure. More important, significant cell-cycle-dependence could be clearly observed for instantaneous cellular responses induced by sonoporation. One can notice that, at the early stage after the onset of sonoporation (e.g., t < 20 s), the rates of cytoskeleton disassembly and PI uptake in synchronized cells could be remarkably ranked by S > G2/M > G1, which suggests S-phase cells are the most sensitive to instantaneous mechanical effects induced by single-site sonoporation while G1-phase cells are the most resistant ones. The cell-cycle-dependence of sonoporation-induced cellular responses might be related to the variation of cell stiffness in different phases, because it has been shown in previous studies that sonoporation can transiently enhance cell membrane permeability by US-stimulated microbubble cavitation activity.8-16 Here, a moderate pressure of 300 kPa was selected to drive focused US transducer, because our previous study suggested that, at this parameter, microbubbles mainly underwent stable cavitation oscillation, rather than violent inertial cavitation collapse.27 During the sonoporation process induced by stable cavitation microbubbles, biophysical effects may be evoked on neighboring cells,19,44,64-66 including (1) the oscillatory motion of the microbubble, resulting in pushing and pulling on the cell membrane, (2) translation of the microbubble, pressing against the cell membrane; and (3) micro-streaming in the fluid surrounding the microbubble, generating shear stresses on the cell membrane. Thus, it is plausible that cells with different stiffness may exhibit different responses to microbubble sonoporation. To verify this hypothesis, a FEM model was established to simulate bubble-cell interactions. By comparing Figure 8A with 8B, one can observe that, when the bubble is sitting in the vicinity of a cell with smaller elasticity, more asymmetric microstreaming velocity field will be generated by the oscillating bubble, which would produce more extensive deformation in the cell membrane. The results shown in Figure 8C suggest the maximum shear stress exerted on the cell membrane will quickly decrease with the raised cell elastic modulus. For example, when cell elasticity increased from 1.0 kPa to 4.0 kPa, the maximum shear stress generated by microbubble microstreaming will drop significantly from about 2500 Pa to 15 Pa. Fong et al. performed numerical simulations to investigate the interaction between a free gas bubble with a bio-materials.67 Their results showed the violent collapse of inertial cavitation gas bubble might induce jet formation near the bio-materials, and the maximum jet velocity would decrease from 980 m/s to 98 m/s when the Young's modulus of the bio-material increases from 5.6 kPa (e.g., adipose tissue) to 47 kPa (e.g., cornea). The current simulation result qualitatively agrees with their observation. It may provide a possible explanation for why S-phase cells with the smallest elasticity exhibited the fastest rates of acute PI uptake and cytoskeleton disassembly right after sonoporation, while the stiffest G1-phase cells were the most resistant to the instantaneous effects of sonoporation.
Figure 4
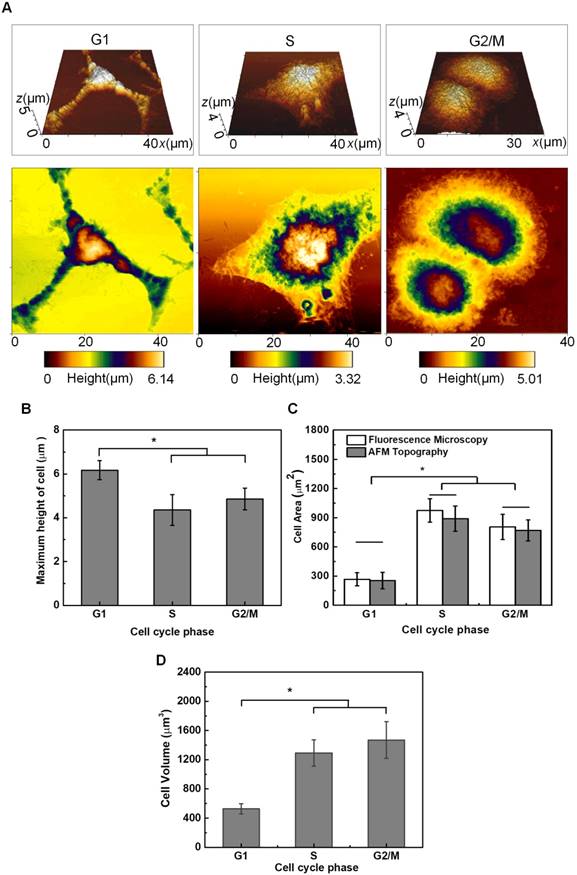
AFM topography observation and height measurements of HeLa cells synchronized in individual cell cycle phases. (A) Typical AFM topographic images of HeLa cells synchronized in the G1, S, and G2/M phases, respectively. The top row is the 3-D topography image and the bottom row is the vertical view of the 3-D image; (B) Height of HeLa cells synchronized in individual cell cycle phases. The average roughness of the glass substrate (~26-63 nm) has been corrected in the height measurements; (C) Estimated cross-section areas of cells synchronized in individual cell cycle phases; and (D) Estimated volumes of cells synchronized in individual cell cycle phases. Significant differences can be observed for the height of cells in different phases for *p<0.05.
Figure 5
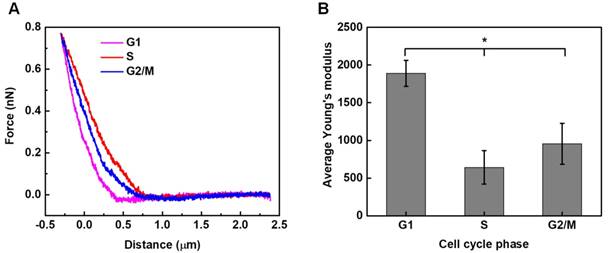
Stiffness assessments of HeLa cells synchronized in the G1, S, G2/M phases. Typical force-deformation curves and average elastic moduli measured for cells in individual cycle phases are shown in (A) and (B). Significant differences can be identified in the average elastic modulus for cells synchronized in different phases (*p<0.05). The numbers of cells examined in individual cycle phases are nG1 = 104, nS = 106, and nG2/M = 100, respectively.
Figure 6
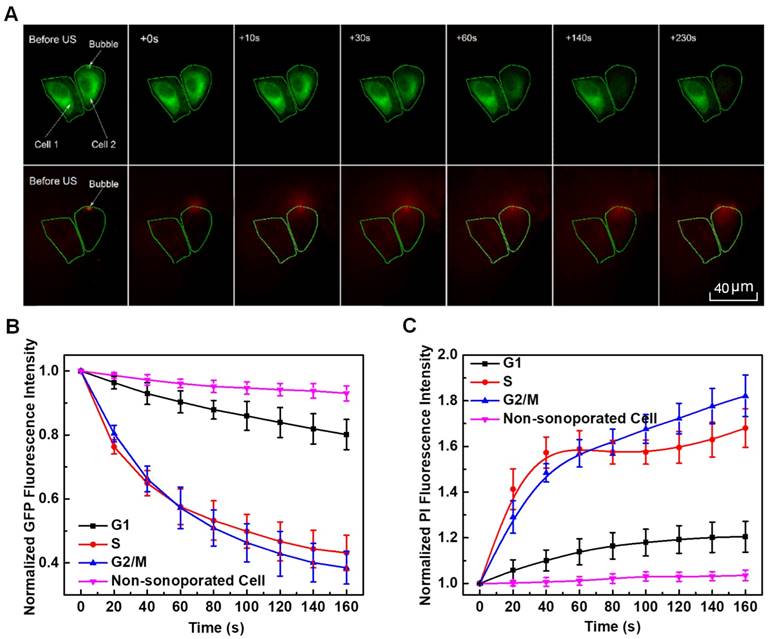
In situ fluorescence imaging of cellular responses in the cell membrane and cytoskeleton triggered by microbubble-mediated sonoporation. (A) Spatiotemporally localized intracellular PI delivery (red in the bottom row) and α-tubulin cytoskeleton disassembly (green in the top row) in a cell triggered by microbubble-mediated sonoporation. Solid green lines demonstrate two regions of interest in two adjacent cells (cells 1 and 2). The arrow indicates a microbubble close to cell 2; (B) Sonoporation-induced GFP intensity changes representing the temporal evolution of the integrity of α-tubulin cytoskeleton structure for cells synchronized in different cycle phases, and GFP intensity of no-sonoporated cells was also evaluated as a comparison; and (C) Sonoporation-induced PI fluorescence intensity changes indicating the variation in the membrane permeability as a function of time for cells synchronized in different cycle phases, and PI intensity of no-sonoporated cells was also evaluated as a comparison. The numbers of sonoporated cells observed in individual cycle phases are nG1 = 17, nS = 18, and nG2/M = 15, respectively. Meanwhile, a total of 45 non-sonoporated cells close to the sonoporated ones are also analyzed.
It is also shows in Figure 6B that, at the late stage after sonoporation (e.g., t > 60 s), the cytoskeleton disassembly tends to slow down and no significant difference can be identified for cells in S- and G2/M-phase. One can also notice in Figure 6C, although generally the uptrend of PI uptake tends to slow down for cells in all three phases, more PI uptake is observed for G2/M-phase cells than S-phase cells synchronized with the time lapse. This phenomenon might be ascribed to sonoporation-triggered endocytosis and G2/M-cycle retention. Previous reports showed that G2/M-phase cells would exhibit the most powerful uptake ability of gene/drug nanoparticles than cells in G1- or S-phase after 24 h of gene/drug delivery,40,41,68 and Gao et al. claimed the uptake of chemotherapeutic nanoparticles in tumor cells could be attributed to effective endocytosis.41 By using a single-burst ultrasound exposure similar to what was used here, Hu et al.69 showed that, for most cells, the sonoporation pores would be resealed within 60 s unless cells were irreversibly damaged by excessively delivery acoustic energy. Fan et al.9 also showed that a quick enhancement of intracellular PI uptake could be observed for cells with the formation of sonoporation pores, while the enhanced PI intensity in the cell would tend to reach a stable plateau due to the resealing of the pores. Thus, we speculated that, for cells studied here, the sonoporation pores in their membranes would also reseal gradually within 60 s, which could be indicated by the slowing down PI uptake rates after 60s. Consequently, the acute mechanical effect induced by microbubble sonoporation might have less influence on the following cellular responses. However, the endocytosis process could also be triggered by sonoporation-induced cytoskeleton rearrangement, which might still act on even after the sonoporation pore resealed and eventually result in more PI uptake in the G2/M-phase cells at the late stage after sonoporation.25,31,32 Unfortunately, limited to current experimental resources, we cannot perform direct and elaborate observation on the processes of pore resealing and sonoporation-triggered endocytosis, which certainly deserves in-depth investigation in our future work.
Figure 7
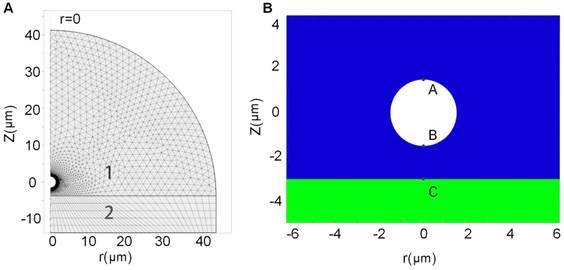
Schematic demonstration of the geometry of the bubble-fluid-cell system and the region segmentation. (A) Geometry of 2D axisymmetric bubble-fluid-cell model, where the semicircle area 1 denotes the fluid region and the rectangle area 2 denotes the solid region in cell membrane; and (B) Relative position of the bubble to the cell membrane. Points A and B are the furthest and closest points on the bubble shell with respect to the cell membrane, and point C is the point on the cell membrane closest to the bubble.
It is acknowledged that there are some limitations of the current work. First of all, it is impossible to achieve 100% cell synchronization in any cell cycle phases, which inevitably brought systemic experimental errors in mechanical property assessments for synchronized cells. Relatively large error bars were observed in the fluorescence intensity analyses for both GFP decay and PI uptake (Figures 6B and 6C), which might be attributed to individual cell difference (e.g., different cell size, sonoporation location, membrane pore size, etc.) or the interference induced by the background fluorescence. Meanwhile, the bioeffects induced by microbubble sonoporation might also be affected by other factors. For example, Lammertink et al. reported that the duration of increased membrane permeability differed between the cell lines and ultrasound pressures.70 Therefore, the dependence of cell-cycle-specific sonoporation on other impact factors (e.g., different cell lines,bubble-to-cell ratio, extracellular calcium concentration) should certainly be taken into account in our future studies. Moreover, it is known that, in a real in vivo biological system, cell status and response will be affected its neighboring cells and surrounding environment. For instance, Fan et al. reported that, in their microbubble-mediated sonoporation studies, delayed calcium transients could be observed in surrounding cells without pores in their membrane due to the presence of calcium waves.9 However, these complicated biological interactions are too complicated to be simulated by using currently available bubble-cell interaction models. Thus, in the present work, both real-time fluorescence observation and dynamic simulation were only performed for cells undergoing single bubble-cell interactions. Moreover, a 2D simplified model was adopted instead of a 3-D model to save the computation time. The assumptions of the model excluded many complicated situations (e.g., irregular contour of cell membrane, multi-bubble-cell interactions, nonlinear changes in bubble shell viscoelasticity, etc.), which might also introduce simulation errors to the results. Nevertheless, the results of our work still should be crucial for providing insights of the mechanism involved in cell-cycle-dependent cellular responses to sonoporation, although it cannot simulate the real in vivo system perfectly. More efforts need to be made in the future work to explore the impact of cell cycle phase on microbubble-mediated sonoporation outcomes under more real biological environments (e.g., more confluent cell layer culture or even in vivo animal model). More comprehensive dynamic models also need to be developed to better simulate multi-bubble-cell interactions under more realistic situations.
Conclusions
In summary, a novel study was performed here to investigate the influence of cell cycle phase on the mechanical properties of HeLa cells and their cellular responses to sonoporation. The results show that the cytoskeleton structure of HeLa cells, such as the α-tubulin microtubules, varies with cell cycle phases. The greatest height and elastic modulus were observed for G1-phase cells and the smallest height and stiffness obtained in S-phase cells. Due to variations in cell mechanical properties, sonoporation-induced acute changes in the cytoskeleton arrangement and membrane permeability were also dependent on the cell cycle phase. Cells synchronized in S phase should be the most susceptible to instantaneous mechanical effect induced by microbubble-mediated sonoporation, which resulted in the greatest enhancement of membrane permeability and the fastest cytoskeleton disassembly at the early stage after sonoporation. Consequently, S-phase might be considered as the preferred cell cycle for instantaneous sonoporation-facilitated gene/drug delivery treatment. The results of the current work would provide more comprehensive understanding of the impact of the cell cycle phase on sonoporation-triggered cellular responses, as well as the underlying mechanisms.
Figure 8
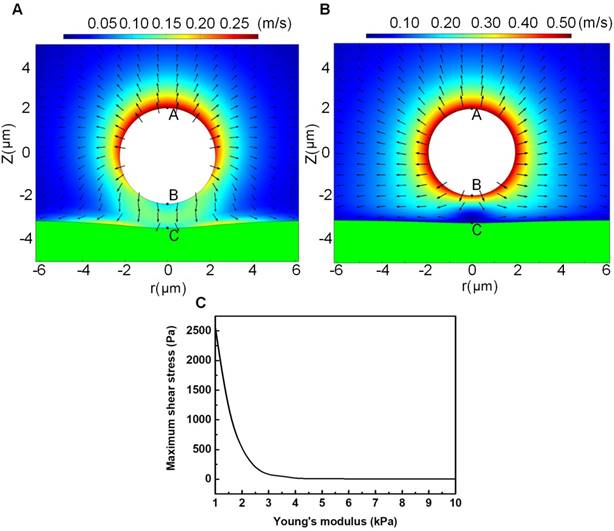
Microstreaming velocity field distribution and geometric deformation of the cell membrane and microbubble in the bubble-fluid-cell system for a cell with relatively small elasticity of 1 kPa (A) or relatively large elasticity of 4 kPa (B); and the maximum microstreaming shear stress exerted on the cell membrane with various elastic modulus (C). The typical initial bubble radius is Rb0=1.5 μm, the US driving pressure amplitude is p=300 kPa, the US frequency is f=1MHz, and the initial distance between the bubble center and the cell membrane is set to be twice the initial bubble radius.
Previous studies have shown that, by using some chemical drugs (e.g., gemcitabine), cell-cycle synchronization (e.g., early S-phase arrest) could be realized both in vitro and in vivo to improve cancer treatment effects in the application of combining radio-/chemo-therapy.71 However, the major obstacles of the radio-/chemo-therapy are limited drug delivery efficiency and great drug toxicity. Therefore, if combining advanced progresses in drugs developed from S-phase arrest with targeted microbubble, the current findings may enable more tailored cell-cycle-targeted therapeutic strategies for malignant tumors and other severe genetic diseases, by providing synergistic gene/drug delivery efficacy and reduced cytotoxicity both in vitro and in vivo.
Abbreviations
HeLa: human cervical epithelial carcinoma; US: Ultrasound; GFP: green fluorescence protein; AFM: atomic force microscopy; FBS: fetal bovine serum; PBS: phosphate buffer solution; DMSO: dimethyl sulfoxide; PI: Propidium Iodide; UCA: ultrasound contrast agent; HPV: human papillomavirus; M phase: mitotic phase; ANOVA: One-way analysis of variance. PI-A: the fluorescence intensity of PI that is used to assess the amount of cellular DNA content.
Acknowledgements
The authors wish to convey their gratitude for GFP-α-tubulin HeLa cell lines offered by Prof. Chaojun Li in the medicine school of Nanjing University, China. This work was partially supported by the National Natural Science Foundation of China (Grant Nos. 81627802, 11374155, 11474001, 11474161, 11674173, 11774166, and 11774168), the Fundamental Research Funds for the Central Universities and QingLan Project.
Supplementary Material
Supplementary information and Figure S1.
Video S1.
Video S2.
Video S3.
Competing Interests
The authors have declared that no competing interest exists.
References
1. Lake RA, Robinson BW. Immunotherapy and chemotherapy-a practical partnership. NAT REV CANCER. 2005;5:397-405
2. Minchinton AI, Tannock IF. Drug penetration in solid tumors. NAT REV CANCER. 2006;6:583-592
3. Cheng CJ, Bahal R, Babar IA. et al. MicroRNA silencing for cancer therapy targeted to the tumour microenvironment. NATURE. 2015;518:107-110
4. Schroeder A, Heller DA, Winslow MM. et al. Treating metastatic cancer with nanotechnology. NAT REV CANCER. 2012;12:39-50
5. Briggers I, Dubemet C, Couvreur P. Nanoparticles in cancer therapy and diagnosis. ADV DRUG DELIVER REV. 2012;54:631-651
6. Sirsi SR, Borden MA. Advances in ultrasound mediated gene therapy using microbubble contrast agents. THERANOSTICS. 2012;2:1208-1222
7. Song KH, Fan AC, Brlansky JT. et al. High efficiency molecular delivery with sequential low-energy sonoporation bursts. THERANOSTICS. 2015;5:1419-1427
8. Ibsen S, Schutt CE, Esener S. Microbubble-mediated ultrasound therapy: a review of its potential in cancer treatment. DRUG DESIGN DEV THER. 2013;7:375-388
9. Fan Z, Kumon R, Park J. et al. Intracellular delivery and calcium transients generated in sonoporation facilitated by microbubbles. J CONTROL RELEASE. 2010;142:31-39
10. Fan Z, Liu H, Mayer M. et al. Spatiotemporally controlled single cell sonoporation. PROC NATL ACAD SCI USA. 2012;109:16486-16491
11. De Cock I, Lajoinie G, Versluis M. et al. Sonoprinting and the important of microbubble loading for ultrasound mediated cellular delivery of nanoparticles. BIOMATERIALS. 2016;83:294-307
12. Mitragotri S. Healing sound: the use of ultrasound in drug delivery and other therapeutic applications. NAT REV DRUG DISCOV. 2005;4:255-260
13. Chen X, Leow RS, Hu Y. et al. Single-site sonoporation disrupts actin cytoskeleton organization. J R SOC INTERFACE. 2014;11:20140071
14. Hu Y, Wan JMF, Yu ACH. Cytomechanical perturbations during low-intensity ultrasound pulsing. ULTRA MED BIOL. 2014;40:1587-1598
15. Mizrahi N, Zhou EH, Lenormand G. et al. Low intensity ultrasound perturbs cytoskeleton dynamics. SOFT MATTER. 2012;8:2438-2443
16. Noriega S, Hasanova G, Subramanian A. The effect of ultrasound simulation on the cytoskeletal organization of chondrocytes seeded in three-dimensional matrices. CELLS TISSUES ORGANS. 2013;197:14-26
17. Zhang CB, Cao HL, Li Q. et al. Enhanced effect ultrasound-induced microbubble cavitation on branched polyethylenimine-mediated VEGF165 transfection with varied N/P ratio. ULTRA MED BIOL. 2013;39:161-171
18. Shapiro G, Wong AW, Bez M. et al. Multiparameter evaluation of in vivo gene delivery using ultrasound-guided microbubble-enhanced sonoporation. J CONTROL RELEASE. 2016;223:157-167
19. Kooiman K, Vos HJ, Versluis M. Acoustic behavior of microbubbles and implications for drug delivery. ADV DRUG DRUG DELIVER REV. 2014;72:28-48
20. Zhang Y, Yu J, Bomba H. et al. Mechanical force-triggered drug delivery. CHEM REV. 2016;116:12536-12563
21. Leinenga G, Langton C, Nisbet R. et al. Ultrasound treatment of neurological diseases-current and emerging applications. NAT REV NEURO. 2016;12:161-174
22. Boissenot T, Bordat A, Fattal E. et al. Ultrasound-triggered drug delivery for cancer treatment using drug delivery systems: from theoretical considerations to practical applications. J CONTROL RELEASE. 2016;241:144-163
23. Unga J, Hashida M. Ultrasound induced cancer immunotherapy. ADV DRUG DELIVER REV. 2014;72:144-153
24. Park J, Fan Z, Kumon RE. et al. Modulation of intracellular Ca2+ concentration in brain microvascular endothelial cells in vitro by acoustic cavitation. ULTRA MED BIOL. 2010;36:1176-1187
25. De Cock I, Zagato E, Braeckmans K. et al. Ultrasound and microbubble mediated drug delivery: Acoustic pressure as determinant for uptake via membrane pores or endocytosis,Ine Lentackera. J CONTROL RELEASE. 2015;197:20-28
26. Tran TA, Le Guennec JY, Bougnoux P. et al. Characterization of cell membrane response to ultrasound activated microbubbles. IEEE TRANS ULTRA FERROELECTR FREQ CONTROL. 2008;55:44-49
27. Qiu YY, Zhang CB, Tu J. et al. Microbubble-induced sonoporation involved in ultrasound-mediated DNA transfection in vitro at low acoustic pressure. J BIOMECHA. 2012;45:1339-1345
28. Qiu Y, Luo Y, Zhang YL. et al. The correlation between acoustic cavitation and sonoporation involved in ultrasound-mediated DNA transfection with polyethylenimine (PEI) in vitro. J CONTROL RELEASE. 2010;145:40-48
29. Geers B, Dewitte H, De Smedt S. et al. Crucial factors and emerging concepts in ultrasound trigged drug delivery. J CONTROL RELEASE. 2012;164:248-255
30. Huang SL. Liposomes in ultrasonic drug and gene delivery. ADV DRUG DELIV REV. 2008;60:1167-1176
31. Meijering BDM, Juffermans LJM, van Wamel A. et al. Ultrasound and microbubble-targeted delivery of macromolecules is regulated by induction of endocytosis and pore formation. CIRC RES. 2009;104:679-687
32. Paula DM, Valero-Lapchik VB, Paredes-Gamero EJ. et al. Therapeutic ultrasound promotes plasmid DNA uptake by calthrin-medicated endocytosis. J GENE MED. 2011;13:392-401
33. Panje CM, Wang DS, Pysz MA. et al. Ultrasound-mediated gene delivery with cationic versus neural microbubbles: effect of DNA and microbubble dose on in vivo transfection efficiency. THERANOSTICS. 2012;2:1078-1091
34. Hartwell L, Weinert T. Checkpoints: Controls that ensure the order of cell cycle events. SCIENCE. 1989;246:629-634
35. Kastan MB, Bartek J. Cell-cycle checkpoints and cancer. NATURE. 2004;432:316-323
36. Li T, Kon N, Jiang L. et al. Tumor suppression in the absence of p53-mediated cell-cycle arrest, apoptosis, and senescence. CELL. 2012;149:1269-1283
37. Patel P, Kansara K, Senapati VA. et al. Cell cycle dependent cellular uptake of zinc oxide nanoparticles in human epidermal cells. MUTAGENESIS. 2016;31:481-490
38. Nakada D, Saunders TL, Morrison SJ. Lkb1 regulates cell cycle and energy metabolism in haematopoietic stem cells. NATURE. 2010;468:653-658
39. Liu Y, Chen W, Zhang P. et al. Dynamically-enhanced retention of gold -nanoclusters in HeLa cells following X-rays exposure: a cell cycle phase-dependent targeting approach. RARIO ONCOLOGY. 2016;119:544-551
40. Kim JA, Aberg C, Salvati A. et al. Role of cell cycle on the cellular uptake and dilution of nanoparticles in a cell population. NAT NANOTECH. 2012;7:62-68
41. Gao H, Hu G, Zhang Q. et al. Pretreatment with chemotherapeutics for enhanced nanoparticles accumulation in tumor: the potential role of G2 cycle retention effect. SCI REP. 2014;4:4492
42. Bhadriraju K, Hansen LK. Extracellular matrix- and cytoskeleton-dependent changes in cell shape and stiffness. EXP CELL RES. 2002;278:92-100
43. Needham D, Ting-Beall HP, Tran-Son-Try R. A physical characterization of GAP A3 hybridoma cells: morphology, geometry, and mechanical properties. BIOTECHNOL BIOENG. 1991;38:838-852
44. Lentacker I, De Cock I, Deckers R. et al. Understanding ultrasound induced sonoporation: Definitions and underlying mechanisms. ADV DRUG DELIVER REV. 2014;72:49-64
45. Liu HL, Fan CH, Ting CY. et al. Combining microbubbles and ultrasound for drug delivery to brain tumors: current progress and overview. THERANOSTICS. 2014;4:432-444
46. Nakamura S, Grigoriev I, Nogi T. et al. Dissecting the nanoscale distributions and functions of microtubule-endbinding proteins EB1 and ch-TOG in interphase HeLa cells. PLOS ONE. 2012;7:e51442
47. Sonia JK, Khandan K. Synchronization of the cell cycle using Lovastatin. CELL CYCLE. 2008;7:2434-2440
48. Hugue CV, Postle AD, Attard GS. et al. Cell cycle dependent changes in membrane stored curvature elastic energy: evidence from lipidomic studies. FARADAY DISCUSS. 2013;161:481-497
49. Belsky JA, Macalpine HK, Lubelsky Y. et al. Genome-wide chromatin footprinting reveals changes in replication origin architecture induced by pre-RC assembly. GENES DEVELOP. 2015;29:212-224
50. Maudet C, Mano M, Sunkavalli U. et al. Functional high-throughput screening identifies the miR-15 microRNA family as cellular restriction factors for Salmonella infection. NAT COMMUN. 2014;5:4718
51. Sullan RMA, Beaussart A, Tripathi P. et al. Single-cell force spectroscopy of pili-mediated adhesion. NANOSCALE. 2014;6:1134-1143
52. Cross SE, Jin YS, Rao JY. et al. Nanomechnical analysis of cells from cancer patients. NAT NANOTECH. 2007;2:780-783
53. Zuk A, Targosz-Korecka M, Szymonski M. Effect of selected drugs used in asthma treatment on morphology and elastic properties of red blood cells. INTERN J NANOMED. 2011;6:249-257
54. Raman R, Trigueros S, Cartagena A. et al. Mapping nanomechanical properties of live cells using multi-harmonic atomic force microscopy. NAT NANOTECH. 2011;6:809-814
55. Ren J, Yu SY, Gao N. et al. Indentation quantification for in-liquid nanomechanical measurement of soft material using an atomic force microscope: Rate-dependent elastic modulus of live cells. PHYS REV E. 2013;88:4666-4678
56. Wilson WD, Krishnamoorthy CR, Wang YH. et al. Mechanism of intercalation: ion effects on the equilibrium and kinetic constants for the interaction of propidium and ethidium with DNA. BIOPOLYMERS. 1985;24:1941-1961
57. Van WA, Kooiman K, Harteveld M. et al. Vibrating microbubbles poking individual cells: drug transfer into cells via sonoporation. J CONTROL RELEASE. 2006;112:149-155
58. Jong ND, Cornet R, Lancee CT. Higher harmonics of vibrating gas-filled microspheres. Part one: simulations. ULTRASONICS. 1994;32:447-453
59. Doinikov AA, Bouakaz A. Review of shell models for contrast agent microbubbles. IEEE TRANS ULTRA FERROELECTR FREQ CONTROL. 2011;58:981-993
60. Doinikov AA, Haac JF, Dayton PA. Modeling of nonlinear viscous stress in encapsulating shells of lipid-coated contrast agent microbubbles. ULTRASONICS. 2009;49:269-275
61. Chen CY, Gu YY, Tu J. et al. Microbubble oscillating in a microvessel filled with viscous fluid: A finite element modeling study. ULTRASONICS. 2016;66:54-64
62. Nogales E. Structural insights into microtubule function. ANNU REV BIOCHEM. 2000;69:277-302
63. Kung ML, Hsieh CW, Tai MH. Nanoscale characterization illustrates the cisplatin-mediated biomechanical changes of B16-F10 melanoma cells. PHYS CHEM CHEM PHYS. 2016;18:7124-7131
64. Collis J, Manasseh R, Liovic P. et al. Cavitation microstreaming and shear stress fields created by microbubbles. ULTRASONICS. 2010;50:273-279
65. Doinikov AA, Bouakaz A. Theoretical investigation of shear stress generated by a contrast microbubbles on the cell membrane as a mechanism for sonoporation. J ACOUST SOC AM. 2010;128:11-19
66. Marmottant P, Hilgenfeldt S. Controlled vesicle deformation and lysis by single oscillating bubbles. Nature. 2003;423:153-156
67. Fong SW, Klaseboer E, Turangan CK. et al. Numerical analysis of a gas bubble near bio-materials in an ultrasound field. ULTRA MED BIOL. 2006;32:925-942
68. Pichardo S, Togtema M, Jackson R. et al. Influence of cell line and cell cycle phase on sonoporation transfection efficiency in cervical carcinoma cells under the same physical conditions. IEEE TRANS ULTRA FERROELECTR FREQ CONTROL. 2013;60:432-435
69. Hu Y, Wan JMF, Yu ACH. Membrane perforation and recovery dynamics in microbubble-mediated sonoporation. ULTRA MED BIOL. 2013;39:2393-2405
70. Lammertink B, Deckers R, Storm G. et al. Duration of ultrasound-mediated enhanced plasma membrane permeability. INT J PHARM. 2015;482:92-98
71. Otani K, Naito Y, Sakaguchi Y. et al. Cell-cycle-controlled radiation therapy was effective for treating a murine malignant melanoma cell line in vitro and in vivo. SCI REP. 2016;6:30689
Author contact
![]() Corresponding authors: juantuedu.cn (J. T.), dzhangedu.cn (D.Z.).
Corresponding authors: juantuedu.cn (J. T.), dzhangedu.cn (D.Z.).
Citation styles
APA
Fan, P., Zhang, Y., Guo, X., Cai, C., Wang, M., Yang, D., Li, Y., Tu, J., Crum, L.A., Wu, J., Zhang, D. (2017). Cell-cycle-specific Cellular Responses to Sonoporation. Theranostics, 7(19), 4894-4908. https://doi.org/10.7150/thno.20820.
ACS
Fan, P.; Zhang, Y.; Guo, X.; Cai, C.; Wang, M.; Yang, D.; Li, Y.; Tu, J.; Crum, L.A.; Wu, J.; Zhang, D. Cell-cycle-specific Cellular Responses to Sonoporation. Theranostics 2017, 7 (19), 4894-4908. DOI: 10.7150/thno.20820.
NLM
Fan P, Zhang Y, Guo X, Cai C, Wang M, Yang D, Li Y, Tu J, Crum LA, Wu J, Zhang D. Cell-cycle-specific Cellular Responses to Sonoporation. Theranostics 2017; 7(19):4894-4908. doi:10.7150/thno.20820. https://www.thno.org/v07p4894.htm
CSE
Fan P, Zhang Y, Guo X, Cai C, Wang M, Yang D, Li Y, Tu J, Crum LA, Wu J, Zhang D. 2017. Cell-cycle-specific Cellular Responses to Sonoporation. Theranostics. 7(19):4894-4908.
This is an open access article distributed under the terms of the Creative Commons Attribution (CC BY-NC) license (https://creativecommons.org/licenses/by-nc/4.0/). See http://ivyspring.com/terms for full terms and conditions.