Theranostics
13.3
Impact Factor
- Issue 9; 2026
- Issue 8; 2026
- Issue 7; 2026
- Issue 6; 2026
- Issue 5; 2026
- Volume 16; 2026
- Advance Articles
- Past Issues
- Cover Images
- Cover Suggestion
- Special Issues
Top
Introduction
Materials and Methods
Results
Discussion
Supplementary Material
Acknowledgements
References
Introduction
Materials and Methods
Results
Discussion
Supplementary Material
Acknowledgements
References
International Journal of Biological Sciences
International Journal of Medical Sciences
 Global reach, higher impact

Theranostics 2017; 7(11):2888-2899. doi:10.7150/thno.19425 This issue Cite
Research Paper
A Normalization-Free and Nonparametric Method Sharpens Large-Scale Transcriptome Analysis and Reveals Common Gene Alteration Patterns in Cancers
Qi-Gang Li1, 3*, Yong-Han He1, 3*, Huan Wu1, 3, 9*, Cui-Ping Yang2*, Shao-Yan Pu1, 3, Song-Qing Fan4, Li-Ping Jiang2, 9, Qiu-Shuo Shen2, 9, Xiao-Xiong Wang1, 3, 9, Xiao-Qiong Chen1, 3, Qin Yu1, 3, 9, Ying Li5, Chang Sun6, Xiangting Wang7, Jumin Zhou2, Hai-Peng Li8, Yong-Bin Chen2 ![]() , Qing-Peng Kong1, 3
, Qing-Peng Kong1, 3 ![]()
1. State Key Laboratory of Genetic Resources and Evolution, Kunming Institute of Zoology, Chinese Academy of Sciences, Kunming 650223, China;
2. Key Laboratory of Animal Models and Human Disease Mechanisms, Kunming Institute of Zoology, Chinese Academy of Sciences, Kunming 650223, China;
3. KIZ/CUHK Joint Laboratory of Bioresources and Molecular Research in Common Diseases, Kunming 650223, China;
4. Department of Pathology, the Second Xiangya Hospital, Central South University, Changsha 410013, China;
5. Farm Animal Genetic Resources Exploration and Innovation Key Laboratory of Sichuan Province, Sichuan Agricultural University, Chengdu 611130, China;
6. Laboratory for Conservation and Utilization of Bio-Resources, Yunnan University, Kunming 650091, China;
7. School of Life Sciences, University of Science and Technology of China, Hefei 230027, China;
8. Key Laboratory of Computational Biology, CAS-MPG Partner Institute for Computational Biology, Shanghai Institutes for Biological Sciences, Chinese Academy of Sciences, Shanghai 200031, China;
9. Kunming College of Life Science, University of Chinese Academy of Sciences, Beijing 100049, China.
* These authors contributed equally to this work.
Received 2017-1-31; Accepted 2017-4-28; Published 2017-7-8
Citation:
Li QG, He YH, Wu H, Yang CP, Pu SY, Fan SQ, Jiang LP, Shen QS, Wang XX, Chen XQ, Yu Q, Li Y, Sun C, Wang X, Zhou J, Li HP, Chen YB, Kong QP. A Normalization-Free and Nonparametric Method Sharpens Large-Scale Transcriptome Analysis and Reveals Common Gene Alteration Patterns in Cancers. Theranostics 2017; 7(11):2888-2899. doi:10.7150/thno.19425. https://www.thno.org/v07p2888.htm
Other stylesAbstract

Heterogeneity in transcriptional data hampers the identification of differentially expressed genes (DEGs) and understanding of cancer, essentially because current methods rely on cross-sample normalization and/or distribution assumption—both sensitive to heterogeneous values. Here, we developed a new method, Cross-Value Association Analysis (CVAA), which overcomes the limitation and is more robust to heterogeneous data than the other methods. Applying CVAA to a more complex pan-cancer dataset containing 5,540 transcriptomes discovered numerous new DEGs and many previously rarely explored pathways/processes; some of them were validated, both in vitro and in vivo, to be crucial in tumorigenesis, e.g., alcohol metabolism (ADH1B), chromosome remodeling (NCAPH) and complement system (Adipsin). Together, we present a sharper tool to navigate large-scale expression data and gain new mechanistic insights into tumorigenesis.
Keywords: Cross-Value Association Analysis, normalization-free, pan-cancer, transcriptome, heterogeneity.
Introduction
Identifying the molecular alterations associated with cancer is the prerequisite for understanding the mechanism of tumorigenesis [1-4]. Alterations in gene expression level play a crucial role in oncogenesis, and thus deciphering the pattern of dysregulated gene expression across different cancer types could not only provide mechanistic insights into disease pathogenesis but also aid in developing strategies for cancer diagnosis, prognosis and therapy [5-12]. However, the high dimension and complex heterogeneity of RNA-Sequencing (RNA-Seq) data from diverse cancer types poses an enormous challenge to cross-tumor analysis [10], resulting in biased or even false results under current quantification or normalization methods [13,14] and distribution assumptions [15-17].
During the identification of differentially expressed genes (DEGs), normalization and distribution assumption of gene expression levels across samples are two essential steps in the widely adopted parametric methods such as edgeR [18], DESeq [19], EBSeq [20] and baySeq [21]. Although the current non-parametric methods such as SAMSeq [15], LFCseq [16] and NOISeq [17] show less dependence on the distribution assumption, cross-sample normalization is still a common step in current non-parametric and parametric methods. For example, SAMSeq, LFCseq and NOISeq use Upper Quartile, TMM (The trimmed mean of M-values), and quantile, respectively, for normalization, which are commonly used in parametric methods [15-21]. However, accurately normalizing large-scale datasets remains difficult [13,14], especially for the highly heterogeneous cancer genomic datasets, where the complex heterogeneity in cancers can strongly influence the efficiency of the parametric methods due to their sensitivity to frequently occurring outliers (genes or samples with extreme values). Indeed, even removing a single sample with outlier values can strikingly influence the results yielded by current DEG methods (see our analysis below). Recently, a Spike-in method shows potential to control the problems of normalization and is able to evaluate the expression levels of genes under study [13,22,23]. This method however works only when it is incorporated into experimental design. Therefore, how to properly analyze and utilize the massive amount of existing genomic data, such as those generated by The Cancer Genome Atlas (TCGA) project, remains challenging. A new method that can overcome these problems is urgently needed to take full advantage of the valuable genomic data [5,7,11,12].
Materials and Methods
Gene expression data sets
Gene expression data of The Cancer Genome Atlas (TCGA; http://cancergenome.nih.gov, RNASeq Version 2) was downloaded from the Firehose of Broad Institute's Genome Data Analysis Center (https://confluence.broadinstitute.org/display/GDAC/Home, version 20140316, with the substring "Level_3_RSEM_genes_normalized" in file names). After excluding the cancer type with less than 10 normal tissue samples, we got 5,540 samples in total, comprising 4,909 primary solid tumor samples and 631 normal samples from 13 cancer types (Table S1). Clinical data and raw reads counts of RNA sequencing (RNA-seq) data sets were also downloaded from the Firehose. It should be mentioned that the level 3 gene expression data sets have already been processed by a slight normalization method in TCGA (for each individual sample, the values were divided by the 75-percentile (after removing zeros) and multiplied by 1,000) in order to compare gene expression levels among samples. Such kind of normalization does not influence the efficacy of our algorithm, because it does not disturb the order of gene expression values within each sample.
Cross-Value Association Analysis (CVAA)
In pan-cancer analysis, we aim to identify differentially expressed genes (DEGs) between tumor and normal samples across cancer types while accounting for other effects. The downloaded RNA-Seq data sets are denoted as the matrix E with m rows (samples) and n columns (genes). The method can be sketched as below:
Step 1: Comparison
For the i-th gene in a sample, we compare its expression level to all other genes within the same sample. Then the comparison is performed for all the samples and the results are formed in a frequency table according to the four categorical variables: R (relationships including less, equal and greater), C (cohorts of compared samples, 13 cancer types), S (sample_types, normal and tumor), G (genes that are compared to gene i, all genes except gene i).
Step 2: Scoring
We apply the log-linear model on the frequency table of gene i to compute the likelihood ratio test (LRT) statistic using this model:
(S + R) * C * G.
According to the log-linear model theory, this LRT statistic represents the significance score of gene i which is differently expressed between tumor and normal samples across cancer types. In this model, “+” represents the additive effect between two factors; “:” represents the interaction effect between two factors (A : B), and “*” is for all effects of the two factors (A + B + A : B). The model (S + R) * C * G measures all the effects including the interaction effect between S and R (S : R : C : G, S : R : C, S : R : G and S : R), and removes all other effects without this interaction effect (e.g., C : R). Also, this model can be specified as:
S * R * C * G - S : R : C : G - S : R : C - S : R : G - S : R.
To obtain the overall expression difference strength of gene i across cancer types, we compute the logarithm 2 of the odds ratio (LOD) values of the margin table of the sample_type (S) factor and relationship (R) factor after removing the “equal” level of relationship factor (up-regulation in tumors: LOD > 0, down-regulation: LOD < 0).
Step 3: Ranking
After looping step 1 and step 2 for each gene, we get scores for all genes and rank them in descending order. Top genes are the most significant cancer-associated genes. These scores are comparable due to that: 1) the frequency tables of each gene have the same factor structure; 2) scores are mutually dependent because comparisons are dependent, that is, if gene A is greater than gene B, gene B must be less than gene A in the same sample.
The CVAA was developed as an R package, which is available upon request.
Interpretation of method comparison
To compare and properly evaluate the power and efficacy between CVAA and the other methods, here we focus on accounting for the complex heterogeneity in the same transcriptome data. Since the heterogeneity in cancer data is too complex to do simulation, we use a more intuitional method to show the robustness of a method by removing one sample, and then compare the changes in results before and after the “leaving-one-out”, analogous to the “cross-validation” adopted in machine learning study. Our assumption is that the impact of a single sample is very limited in the context of large-scale samples, so any significant change(s) in the obtained results after the removal of one sample should be false negative(s) or false positive(s). To further compare the robustness of CVAA to other methods, we randomly shuffled the gene labels by inducing “noise” into a proportion (1%, 5% or 10%) of samples, and then evaluated their ability of resisting noise by comparing the gene ranks before and after the introduction of noisy samples.
Large-value effect in CVAA
Different from the existing DEG methods, CVAA depends only on comparisons within a sample, making CVAA more robust and suitable for large sample analysis, which, however, also introduces a potential caveat: if a gene has the highest or lowest expression levels in all samples, CVAA cannot identify it even if this gene is truly differentially expressed between the case and control groups. However, our results also suggest this caveat might have minor influence because CVAA shows high agreement with other methods (Fig. 1) and can filter false positives caused by heterogeneous samples.
Comparison with the other pan-cancer transcriptome studies
Although several studies performing cross-tumor expression analysis have been presented using either microarray [5-7,11,12,24] or RNA-Seq [25] data, these studies all conducted current DEG methods to identify dysregulated genes for every cancer type separately and then combined the results from all the cancers. In contrast, our work has the following significant differences or improvements: 1) In this merging strategy, the pan-cancer results depend on individual cancer analysis, thus any bias in one cancer type will influence the pan-caner results. 2) The thresholds for each cancer type are mandatorily specified, however, CVAA puts all cross-tumor transcriptome data sets into one model framework that is just a simple extension of the model for one cancer type. 3) By introducing LOD, we can simultaneously describe the extent to which a gene is significantly (LRT or rank) and commonly (LOD) differentially expressed across cancer types. As a result, despite the common DEGs (genes with greater absolute LODs, such as ADH1B and NCAPH) focused by the previous studies, our result also identified DEGs showing different change patterns across cancer types (genes with LODs around 0, such as MS4A15 and SUSD4), which greatly extends the category of DEGs list.
Percentile rank
Because genes are expressed at different levels among tissues or cancer types, to avoid the tissue effect and capture the change pattern from normal tissues to tumors across cancer types, we scale gene expression levels to 1-100 using percentile rank. Given a vector of values, percent rank is defined as: (Count_Less_i + 0.5 ×Frequency_i) / N, where Count_Less_i is the count of all values less than the value i of interest, and Frequency_i is the frequency of value i, N is the size of the vector. We use percentile rank to visualize alteration patterns across cancer types and define the 90% normal intervals for each gene in each cancer type. It should be noted that cross-sample normalization (percentile rank) was not used in the CVAA.
90% normal intervals and dysregulation frequency (DF)
Although the CVAA does not require normalization, we have to describe the frequency of differential expression events occurred in tumor samples for each gene. Briefly, we first calculate 90% normal intervals of a gene in each cancer type, and use these intervals to calculate DFs. For a given gene and a cancer type, we use percentile rank to normalize gene expression values in the normal tissue of this cancer type, and obtain the expression value (downloaded value) corresponding to the minimum percentile rank which is not less than 0.05, and the expression value corresponding to the maximum percentile rank which is not greater than 0.95. The normalized expression levels between 0.05 and 0.95 are defined as the 90% normal interval of gene expression in the cancer type. If a gene expression value in this cancer type lies outside the 90% normal interval, we say that this gene is dysregulated in the sample. The proportion of dysregulated tumor samples to all tumor samples is the dysregulation frequency of a gene.
Multidimensional scaling
To cluster samples based on change patterns and avoid the interference of tissue effects, we use percentile rank values to perform multidimensional scaling using R function cmdscale.
Figure 1
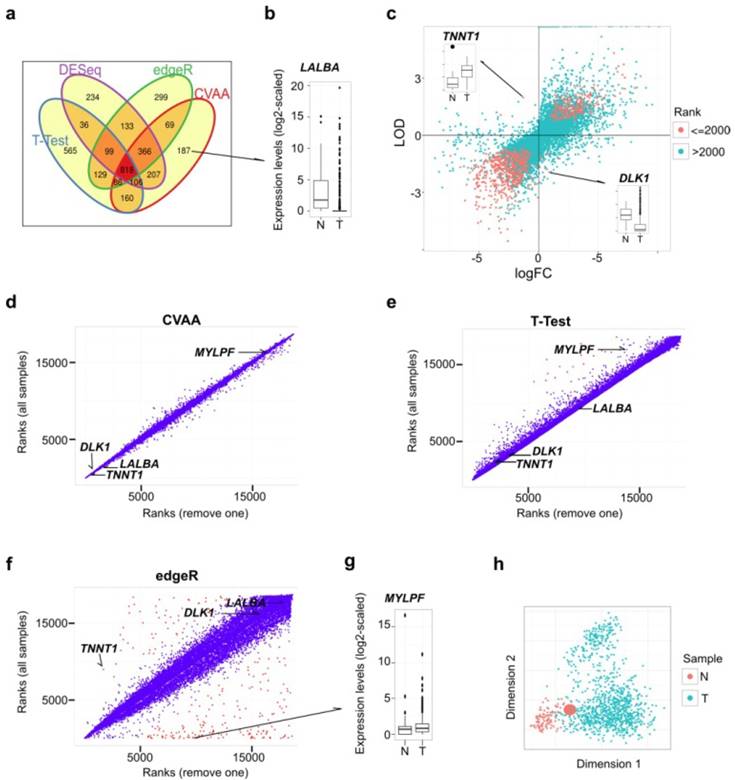
Comparisons among CVAA, T-Test, edgeR and DESeq in analyzing the same breast cancer data comprising 110 normal/noncancerous tissue (N) and 1,037 tumor samples (T). (a) Venn diagram of the top 2,000 DEGs generated by CVAA, T-Test, DESeq and edgeR, respectively. (b) Expression levels of LALBA gene in normal and tumor samples. LALBA severs as an example of the genes showing higher ranks in CVAA but lower in others (cf. Table S2). (c) Gene expression changes estimated by LODs (CVAA) and logFC (T-Test, edgeR and DESeq). LOD or logFC > 0 indicates up-regulation; LOD or logFC < 0 indicates down-regulation. The top 2,000 genes identified by CVAA are indicated by red dots. (d-f) Gene ranks before (Y-axis) and after (X-axis) removing the sample with the extreme value of TNNT1 in Figure 1c (Barcode: TCGA-GI-A2C8-11A-22R-A16F-07) by CVAA, T-Test and edgeR. Genes with ranking changes for more than 5,000 are indicated by red dots, indicating that these genes are very sensitive to the sample removal. (g) Expression levels of MYLPF gene between normal and tumor samples. MYLPF serves as an example of the genes showing a higher rank in CVAA but smaller in other above-mentioned methods. (h) Multidimensional scaling analysis of all samples considered here, the enlarged red dot indicates the removed sample.
Gene Ontology enrichment analysis
This is performed using the online tool (http://david.abcc.ncifcrf.gov/).
Cross-cancer-type survival analysis
Because gene expression levels vary greatly among cancer types, it is impossible to use a fixed expression threshold to discriminate expression status. In order to perform cross-cancer survival analysis, we define a gene to be dysregulated in the samples when its expression value is outside its corresponding 90% normal intervals. Then we apply the R package 'survival' (http://cran.r-project.org/web/packages/survival/) to perform cross-cancer survival analysis using the standard Cox proportional hazards model. Hazard ratios exceeding 1 suggest gene dysregulation events to be associated with an overall detrimental effect across cancers, whereas those below 1 indicate better outcomes. We examined survival associations with dysregulation events of single gene, gene pairs, and the numbers of dysregulated genes in individual samples, respectively. Age and gender are used as covariates in these analyses. Survival association with gene pairs suggests the effects of joint dysregulation events, and the association with the number of dysregulated genes indicates the global dysregulation effects.
Constructs, cell culture, shRNA-lenti-viral infection and cell proliferation assay
Independent shRNAs against different genes targeting to different regions were constructed using pLKO.1 vector, and the 3XFlag C-terminal tagged forms of different over-expression genes were synthesized and cloned into pCDH-MSCV-E2F-eGFP lenti-viral vector, and all the constructs were verified via sequencing, the detail cloning information will be provided upon request. The lenti-viruses were generated according to the manufacture protocol, in brief, supernatants containing different lenti-viruses generated from HEK-293T cells were collected 48 and 72 hours post-transfection respectively, cells were infected twice by 48 hour- and 72 hour- viruses respectively in the presence of 4 μg/mL polybrene. 21bp targeting sequences are indicated in Table S12, constructs were sequencing verified. Stable cells were selected by puromycin treatment. Cells were trypsinized and plated into 24-well plates and the cell numbers were subsequently counted on each day. HEK-293T cells were cultured in DMEM medium, A549 was cultured in HAM'S/F12 medium, SW480 and SW620 were cultured in DMEM/F-12 medium, MDA-MB-231 was cultured in RPMI 1640 medium, MCF7 was cultured in MEM plus NEAA medium, all the cells were supplemented with 10% fetal bovine serum (FBS) and 1% penicillin/streptomycin and all cells were incubated in a humidified atmosphere with 5% CO2 at 37°C.
IHC and scores
The IHC staining for samples on the TMAs was carried out using ready-to-use Envision TM+ Dual Link System-HRP methods (Dako; Carpintrria, CA). The staining condition for each antibody was adjusted according to our laboratory experience. Briefly, each TMA section was deparaffinized and rehydrated, and high-temperature antigen retrieval was achieved by heating the samples in 0.01 mol/L citrate buffer in a domestic microwave oven at full power (750 Watts) for 30 minutes, then the samples were immersed into methanol containing 0.3% H2O2 to inactivate endogenous peroxidase at 37°C for 30 minutes. To eliminate nonspecific staining, the slides were incubated with appropriate preimmune serum for 30 minutes at room temperature. After incubation with a 1:300 dilution of primary antibody to ADH1B and NCAPH at 4°C overnight, slides were rinsed with phosphate-buffered saline (PBS) and incubated with a labeled polymer-HRP according to the manufacturer's instructions and incubated for 30 minutes. Color reaction was developed by using 3, 3'-diaminobenzidine tetrachloride (DAB) chromogen solution. All slides were counterstained with hematoxylin. Positive control slides were included in every experiment in addition to the internal positive controls. The specificity of the antibody was determined with a matched IgG isotype antibody as a negative control.
Immunohistochemical staining of TMA sections were scored independently by SZ and SF who were blinded to the clinicopathological data, at 200X magnification evaluation was based on the staining intensity and extent of staining. Staining intensity for ADH1B and NCAPH was scored as 0 (negative), 1 (weak), 2 (moderate), and 3 (strong). Staining extent was scored as 0 (0%), 1 (1-25%), 2 (26-50%), 3 (51-75%), and 4 (76-100%), depending on the percentage of positive-stained cells. The sum of the staining intensity and the staining extent scores ranged from 0 to 7, with negative staining (0-1) and positive staining (2-7). Agreement between the two evaluators was 95%, and all scoring discrepancies were resolved through discussion between the two evaluators.
These statistical analyses were performed using SPSS 19.0. The chi-square test was used to analyze the relationship between the expression of ADH1B and NCAPH proteins and clinically pathological characteristics and prognostic factors of NSCLC. All P values were based on the two-sided statistical analysis and P-value less than 0.05 was considered to be statistically significant.
Results
CVAA shows better performance in dealing with heterogeneous data
Here, we developed Cross-Value Association Analysis (CVAA), a new strategy that: 1) performs mutual comparisons among genes, 2) scores association with effects of interest using the log-linear model, and 3) obtains the most significant DEGs by ranking the scores of all genes. This strategy identifies DEGs based on comparisons within samples and thus eliminates the need of normalization and assumption for expression levels (see Methods). To evaluate the power and efficiency of CVAA, we first analyzed the same tumor transcriptome dataset (comprising 1,037 breast tumors and 110 non-cancerous breast tissues (hereafter referred to as normal tissues)) (Table S1) and found that, CVAA has better performance and generates much more stable outputs in dealing with extreme values (see Methods for more details), compared to the commonly adopted parametric methods, such as T-Test, edgeR [18] and DESeq [19]. Raw reads counts were used in CVAA and all the compared methods except for T-Test in which log2-transformed raw counts were used.
As shown in Venn diagram (Fig. 1a), CVAA has a minimum number of genes whose ranks are not higher than 2,000 for one method but higher for others (hereafter referred to as singleton genes). Of the 187 singleton genes in the top 2,000 of CVAA, 19, 60 and 54 genes are ranked behind 8,000th in T-Test, edgeR and DESeq, respectively. For instance, gene LALBA is ranked 1,206th in our CVAA, but shows very low rankings in other methods: 9,026th, 18,497th and 17,746th in T-Test, edgeR and DESeq, respectively (Table S2). Boxplot shows that LALBA is an apparently down-regulated gene (Fig. 1b), and its expression level is even close to zero in 81% of tumor samples. This discrepancy is attributable to the fact that LALBA shows discontinued expression levels and has many extreme values, which deviates the assumptions of either normality (T-Test) or negative binominal distribution (DESeq and edgeR). Of note, CVAA uses the Log of Odds (LOD; up-regulation: > 0, down-regulation: < 0; Methods) to estimate expression change directions. Of the top 2,000 genes identified by CVAA, 16 genes show different estimates for direction changes between the LODs and the commonly used log Fold Change (logFC) (Fig. 1c). Taking TNNT1 (LOD = 1.99, logFC = -1.29) and DLK1 (LOD = -1.94, logFC = 0.9) for examples, boxplots show logFC estimates are easily influenced by some extreme values (Fig. 1c).
The capability of dealing with outliers (with extreme values) is the key to produce a stable output in the analysis of the heterogeneous data such as cancer transcriptomes. While removing a single sample with extreme values (Fig. 1c) from over 1,000 breast cancer samples can lead to substantial changes in ranking DEGs by either T-test or edgeR, the ranks of CVAA are almost unchanged (Fig. 1d-f; Tables S2 and S3). There are several notable issues with the existing methods. After removing one sample, DESeq fails to converge (data not shown), suggesting possible computational problems in DESeq for heterogeneous samples. Ranks of some genes in edgeR increase (e.g., TNNT1, from 8,938th to 1,689th) or decrease dramatically, for example, 8 of the top 10 genes in the original edgeR list are ranked behind the 8,000th after the sample removal (Fig. 1f; Tables S2 and S3). We also noticed that the two genes (LALBA and DLK1) with significantly differential expressions between cancer and the normal tissues but still stay at the tail of the new edgeR list, likely due to both genes containing more than one outlier (Fig. 1b, c and f), suggesting both genes are influenced by more complex heterogeneity than TNNT1. Thus, the parametric methods are sensitive to the outliers and tend to produce false negatives (e.g., TNNT1, LALBA and DLK1) or false positives (e.g., MYLPF, with its rank changed from the 1st to 8,914th in edgeR; Fig. 1g). Seriously, multidimensional scaling shows that the removed tumor sample completely mixes with the others (Fig. 1h) and is unlikely to be detected and removed prior to differential expression analysis.
We then introduced noises by randomly permuting the gene labels in a proportion of samples (1%, 5% or 10%). We assume that, in the context of large samples, the overall or real result should not be affected by a small fraction of “noisy” samples, if the method can handle heterogeneity well. Besides the above-mentioned methods, another new-developed method, Voom [26], was included into analysis. As expected, CVAA works the best with the smallest gene rank difference among these methods, followed by Voom and edgeR, T-Test shows the worst performance (Fig. S1).
CVAA can be applied to pan-cancer expression analysis
The limited ability of the currently adopted methods in dealing with data containing extreme values suggests that a larger sample size unlikely assures a stable result. This problem becomes more serious in handling large-scale pan-cancer transcriptome data, which are highly heterogeneous with more outliers. In contrast, CVAA can be extended to pan-cancer analysis because it accounts for both cancer type effect (diverse expression levels of a gene across cancer types) and change pattern effect (a gene being up-regulated in one cancer type but down-regulated in some others or vice versa) using log-linear model (Methods). We then applied CVAA to the RNA-Seq datasets of 5,540 samples (comprising 4,909 tumors from 13 primary solid tumor types and 631 non-cancerous tissues retrieved from TCGA (Table S1)), in order to determine the common gene dysregulation pattern across diverse cancer types and to obtain more insights into the underlying mechanism of the disease.
To interpret the gene rank of CVAA and numerically describe the extent to which a gene is abnormally expressed across cancer types, we presented dysregulation frequency (DF) (Methods). For instance, ADH1B (ranked 1st) is suppressed in nearly all cancer types (Fig. 2a), and its DF in all tumor samples is 83.8%, much higher than the 10.0% in normal tissues. With the increase in ranking number, the tumor DF of a certain gene tends to decrease, for example, 78.0%, 61.6%, 64.0%, 48.2% and 37.6% for MMP11 (2nd), ZBTTB16 (301th), PLAU1 (501th), ESPN (1,001th) and PTOV1 (15,001th), respectively. This tendency supports the predictive power of CVAA. Indeed, comparing the average DFs of the top 500 genes (60.5%) with the 18,690 coding genes (38.0%), shows that these top 500 are much more frequently dysregulated across the 13 cancer types (Student's t-test, P = 2.40e-174).
Figure 2
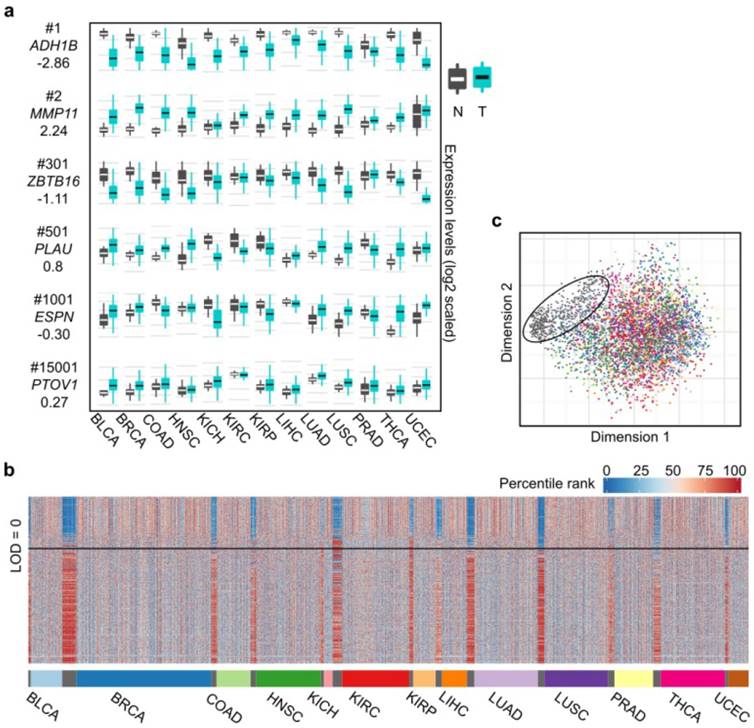
Differential expression spectra between tumors and normal tissues across the 13 cancer types. (a) Expression boxplot of selected genes ranked by the CVAA. Each row in the first column indicates gene symbol, rank number and LOD value, respectively. Y axis of mRNA levels is log2 scaled. (b) Expression profile of the top 500 genes across the 13 cancer types. As tissue-varied gene expression, original expression values of each gene are percentile ranked (Methods) within each cancer type (color bar on the left top). (c) Multidimensional scaling shows relative similarity among all samples, with the circled dots indicating the normal tissues.
We also adopted LOD value to indicate the overall change direction of a certain gene (up-regulation: LOD > 0, down-regulation: LOD < 0) in pan-cancer analysis, with the absolute value of LOD suggesting the consistency degree of expression change. The higher the absolute value, the greater the consistency is across cancer types. For example, as shown in Fig. 2a, MMP11 (2nd, LOD = 2.24) is up-regulated in virtually all 13 cancer types, ZBTB16 (301th, LOD = -1.11) is down-regulated in 8 cancer types, whereas ESPN (1,001th, LOD = 0.30) is up-regulated in some cancer types (e.g., BLCA) but down-regulated in some others (e.g., KIRP). We notice that the top ranked genes tend to have greater absolute LOD values (Table S4). For example, 63% of the top 500 genes have absolute LOD values greater than 1, whereas this ratio decreases to 7% when all genes are considered, suggesting that most of the top 500 genes are more consistently up- or down-regulated across cancer types.
Common dysregulation changes in gene expression exist across diverse cancer types
To further validate these results, we examined each of the 500 genes using Student's t-test within each cancer type. 398 genes are differentially expressed in at least 8 cancer types (P < 1e-6). At this significance level, 345 genes show consistent dysregulation directions in at least 8 cancer types, with 112 being up-regulated and 233 down-regulated (Table S5). Among these 500 genes, 91.7% (143/156) of the up-regulated genes and 47.1% (162/344) of the down-regulated genes have been reported to influence cancer cell proliferation, apoptosis, invasion or metastasis; and most are considered as oncogenes (OGs) or tumor suppressor genes (TSGs) (Tables S6 and S7). Therefore, we chose these top 500 genes for subsequent analyses to examine the common transcriptional changes and their potential functional roles in cancers.
Examining the expression levels of these 500 genes in the 13 cancer types and the normal tissues revealed that the tumor expression profiles are evidently disturbed compared to the normal tissues (Fig. 2b), which is further supported by multidimensional scaling analysis (Fig. 2c). This pattern shows that the 13 cancer types share abundant similarities at the level of transcriptional alterations, despite their different organ origins.
Gene Ontology (GO) terms revealed that these 500 genes are of high relevance to the identified cancer hallmarks [9], such as cell cycle, cell proliferation, cell adhesion, angiogenesis and extracellular matrix (Table S8). We discovered many genes involved in other processes likely to be crucial for cancers, including metabolism (e.g., GLTU1, PDK4, HILPDA and GPD1) [27], epigenetic regulation (e.g., NCAPG, NCAPH and INMT) [28], and ubiquitination (e.g., UBE2, UHRF1 and DTL) [29]. GO analysis also identified many enriched terms related to tumor microenvironment, such as chemical homeostasis, glucose homeostasis, response to steroid hormone stimulus, and transport process (Table S8). Surprisingly, genes in these terms tend to be down-regulated. For example, the average LOD of 33 genes enriched in chemical homeostasis is -1.16 (Table S4), suggesting that the imbalance of chemical homeostasis in cancers triggers mostly via suppressing the expression of relevant genes. Specifically, PPARG (ranked 443th, LOD = -0.78), a nuclear receptor gene, mediates glucose metabolism and influences tumor growth and metastasis [30]; its coactivator, PPARGC1A, is also identified here (ranked 452th, LOD = -1.26). Likewise, transporter genes involved in maintaining homeostasis are dysregulated as well, such as solute carrier family members (e.g., SLC12A1 and SLC6A4), water channel (e.g., AQP2, AQP4, AQP6 and AQP7), and sodium channel (e.g., SCNN1B and SCNN1G) (Table S4). We also identified many genes involved in immune responses, including immunoglobulin (e.g., SEMA3G [31], IGSF10, IGSF9 and VSIG2), chemokines and their receptors (e.g., CCL14, ACKR1, CCL21, CXCL12 [32], CXCL14 and CXCL2 [33]), and the complement system (e.g., C7 and Adipsin), suggesting a close link between native immunity and tumor development, thus providing potential new targets for anticancer immune therapy.
Functional experiments validate crucial roles of the new DEGs in tumorigenesis
To verify these findings, we further chose and study 3 frequently up-regulated genes (FAM111B, NCAPH and MFAP2; all LOD > 1), 2 cancer-specifically dysregulated genes (MS4A15 and SUSD4; both LOD ~ 0; indicating both genes are up-regulated in some cancer types but down-regulated in some others) and 5 frequently down-regulated genes (ADH1B, Adipsin, AQP7, EMCN and CLIC5; all LOD < -1.1) (Fig. S2; Table S4). All the above 10 genes are rarely studied in cancers before. We then examined the effects of their gain- or loss-of-function on cell proliferation using lung (A549), colon (SW480 and SW620) and breast (MDA-MB-231 and MCF7) cancer cell lines. Our data show that manipulating the above 10 genes in directions opposite to their dysregulation patterns significantly restrains cell proliferation unanimously in all the examined cancer cell lines (Fig. 3a-f; Fig. S3a-S3d; Fig. S4a). Survival analysis over the 13 cancer types suggests that low-expression of ADH1B (ranked 1st and down-regulated) or high-expression of NCAPH (ranked 293th and up-regulated) is associated with poor survival (Fig. 3g). We then picked ADH1B and NCAPH for further functional study, and observed that knockdown of NCAPH or over-expression of ADH1B largely inhibits the growth of xenograft tumors (Fig. 3h) and significantly inhibits cell migration as shown by wound healing and trans-well assays (Fig. 3i-n; Fig. S3e-S3h; Fig. S5).
To examine whether the protein expression levels of these genes are consistent with the mRNA levels in cancers, we next surveyed the protein expression and cellular location of ADH1B and NCAPH in NSCLC (including lung SCC and ADC) and the non-cancerous lung control tissue (NCLT) by immunohistochemical staining (IHC) (Table S10). The percentages of positive ADH1B expression in NSCLC and NCLT were 42.1% (99/235) and 82.4% (42/51), respectively. The expression of ADH1B protein in NCLT was significantly higher compared with NSCLC (P < 0.001) (Fig. 3q-r' and s; Fig. S6). By contrast, the percentage of positive expression of NCAPH in lung cancer (47.2%, 111/235) was significantly higher than that in NCLT (31.4%, 16/51) (P < 0.05) (Fig. 3o-p' and s; Fig. S6). Interestingly, we also observed that ADH1B shows higher expression levels in NSCLC without lymph node metastasis (LNM) than in NSCLC patients with LNM (P < 0.05; Table S9), which is in good agreement with our experimental finding that over-expression of ADH1B inhibits cancer cell migration (Fig. 3i-n; Fig. S3e-S3h; Fig. S5).
Discussion
In this study, we developed a new method—CVAA, which works without normalization and distribution assumption, and applied it to large-scale pan-cancer transcriptome data. Besides the well-documented tumor genes and pathways, we also identified and validated several crucial but rarely explored cancer-associated genes and processes. For example, ADH1B (ranked 1st and down-regulated in approximately 80% of tumor samples) encodes an alcohol dehydrogenase, and other members of the alcohol dehydrogenase family are also down-regulated, such as ADH1A (ranked 343th, LOD = -1.50) and ADH1C (ranked 110th, LOD = -1.36). Our experiments verified the ability of ADH1B to restrain cancer cells, indicating that inactivation of alcohol dehydrogenase plays a crucial role in tumorigenesis. We also found that most transporter genes are down-regulated, and that over-expressing a chloride channel (CLIC5) or a water channel gene (AQP7) significantly suppressed cancer cell proliferation, suggesting that altering the chemical transport process in tissues may be crucial for carcinogenesis. Interestingly, we identified that several genes (i.e., MASP1, C7 and Adipsin), involved in the complement system, are frequently down-regulated (all LOD < -0.93). Albeit the role of complement system in tumor growth remaining disputable [34], over-expressing Adipsin can significantly inhibit proliferation of multiple cancer cell lines (Fig. 3a-f and Fig. S3a-S3d), suggesting that targeting this process might be an effective way to restrain cancer cells.
Thus we have uncovered a number of common gene expression alterations, including the hidden ones, across diverse cancer types, which likely constitute a molecular basis for the hallmarks of solid cancers [9]. Although the mechanisms triggering or driving these alterations remain to be elucidated, their clinical implications are profound. By examining the association between clinical features and dysregulation events of the top 500 genes across all tumor samples, we identified 457 genes to be significantly associated with tumor stage (all P < 1e-4, Chi-squared test) and 223 genes with vital status (deceased or living) (all P < 1e-4, Fisher's exact test) (Table S11). Survival analysis revealed that 136 genes show significant association with poor survival (all P < 1e-4, hazard ratio (HR) > 1) and 12 genes with better survival (all P < 1e-4, HR < 1) (Table S10). Next, we examined whether associations exist between clinical features and numbers of dysregulated genes in individuals. As shown in Fig. 4a, tumors, regardless of their stages (stages I - IV), have more dysregulated genes than the normal tissues (Student's t-test, P < 1.1e-16). Specifically, 96.3% of the tumors carry more than 100 dysregulated genes, in sharp contrast with the value (9.5%) of the normal samples. As expected, patients with more dysregulated genes show poorer survival (P = 0.0007, HR: 1.26, 95% CI: 1.10 - 1.45) (Fig. 4b), and deceased patients carry more dysregulated genes than the living ones (Student's t-test, P = 1.14e-15; Fig. 4c).
Taken together, here we provided evidence showing that CVAA can overcome the potential problems raised by normalization or distribution assumption and thus allows us to identify the hidden common changes of transcription and biological processes in various solid tumors, despite the existence of intra- and inter-tumor heterogeneity. Since CVAA depends only on comparisons among variables within individual samples, its success in the large-scale analysis of cancer transcriptomes suggests that this method could be applicable for other diseases as well as other types of high throughput datasets.
Figure 3
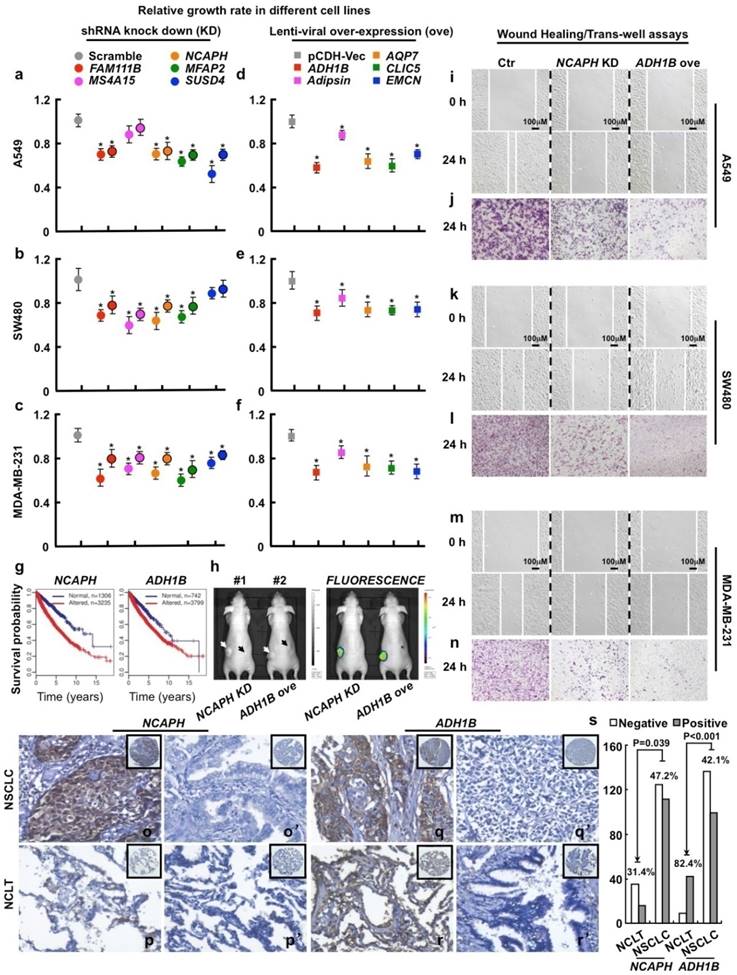
Functional study of 10 picked genes from the top 500 dysregulated ones in different tumor cell lines. (a-c) 3 up-regulated genes (FAM111B, NCAPH and MFAP2) and 2 cancer-specifically dysregulated genes (MS4A15 and SUSD4) were inhibited by 2 independent shRNAs targeting to different mRNA regions (indicated by different colors with or without black circle), respectively. Here, representative day 4 cell numbers normalized to scramble shRNA cells (considered as 1) were shown, *P < 0.05. (d-f) 5 down-regulated genes (ADH1B, Adipsin, AQP7, CLIC5 and EMCN) were over-expressed, respectively. The cell numbers were counted and normalized to pCDH-Vec control cells (considered as 1), *P < 0.05. (g) Survival curves of ADH1B and NCAPH across cancer types (NCAPH, P = 2.22e-16; ADH1B, P = 6.75e-06). Normal/altered: a gene is expressed in the normal/altered levels in a sample (see Methods). (h, left) Representative photographs captured with visible light of the animals corresponding to each treatment group at day 28th after A549-luc cell injection. White arrow (#1 mouse) indicates scramble shRNA control, dark arrow (#1 mouse) indicates NCAPH KD; white arrow (#2 mouse) indicates pCDH-Vec control, dark arrow (#2 mouse) indicates ADH1B ove; total 2×10⁶ cells for each line were injected. (h, right) Representative whole body fluorescence imaging showing a significant reduction in tumor size when NCAPH was depleted or ADH1B was over-expressed. (i, k, m) Representative wound healing assay using indicated cancer cell lines at 0 or 24 hours, respectively. (j, l, n) Representative trans-well cell migration assay using indicated cell lines at 24 hours. (o-r') IHC, DAB staining, 200X. (o-o', q-q') The positive and negative expression patterns of NCAPH or ADH1B protein, respectively, were shown in the NSCLC (p-p', r-r') The positive and negative expression patterns of NCAPH or ADH1B protein, respectively, were shown in the NCLT. (s) Quantification data for IHC. All the experiments were repeated at least 3 times, representative images were shown.
Figure 4
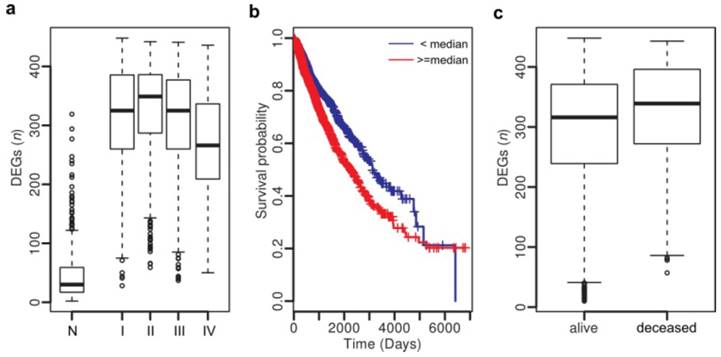
Clinical association analysis across cancer types. (a) Number of DEGs in normal tissues and tumors at stages I - IV. (b) Patients with more DEGs (> 320) show poor survival. (c) Deceased patients have more DEGs than the livings.
Supplementary Material
Additional File 1Supplementary figures (S1-S6).
Supplementary table (S1-S5, S8-S12).
Supplementary table (S6-S7).
Acknowledgements
This work was supported by the Key Research Program of the Chinese Academy of Sciences (Grant NO. KJZD-EW-L14), grants from the Chinese Academy of Sciences (QYZDB-SSW-SMC020), the National Natural Science Foundation of China (81272309, 81322030, U1502224, 81672764, 31271579, 81602346, 81671404, 81500670), Yunnan Applied Basic Research Projects (2014FA038), and grant from the Youth Innovation Promotion Association of Chinese Academy of Sciences (to Y.H. He). We thank Dr. Nelson Tang and Dr. Dangsheng Li for their kind and valuable comments on the manuscript.
Competing Interests
The authors have declared that no competing interest exists.
References
1. Davoli T, Xu AW, Mengwasser KE, Sack LM, Yoon JC, Park PJ. et al. Cumulative haploinsufficiency and triplosensitivity drive aneuploidy patterns and shape the cancer genome. Cell. 2013;155:948-62
2. Kandoth C, McLellan MD, Vandin F, Ye K, Niu B, Lu C. et al. Mutational landscape and significance across 12 major cancer types. Nature. 2013;502:333-9
3. Zack TI, Schumacher SE, Carter SL, Cherniack AD, Saksena G, Tabak B. et al. Pan-cancer patterns of somatic copy number alteration. Nat Genet. 2013;45:1134-40
4. Vogelstein B, Papadopoulos N, Velculescu VE, Zhou S, Diaz LA, Kinzler KW. Cancer Genome Landscapes. Science. 2013;339:1546-58
5. Ramaswamy S, Ross KN, Lander ES, Golub TR. A molecular signature of metastasis in primary solid tumors. Nat Genet. 2003;33:49-54
6. Carter SL, Eklund AC, Kohane IS, Harris LN, Szallasi Z. A signature of chromosomal instability inferred from gene expression profiles predicts clinical outcome in multiple human cancers. Nat Genet. 2006;38:1043-8
7. Ramaswamy S, Tamayo P, Rifkin R, Mukherjee S, Yeang C-H, Angelo M. et al. Multiclass cancer diagnosis using tumor gene expression signatures. Proc Natl Acad Sci. 2001;98:15149-54
8. van 't Veer LJ, Dai H, van de Vijver MJ, He YD, Hart AAM, Mao M. et al. Gene expression profiling predicts clinical outcome of breast cancer. Nature. 2002;415:530-6
9. Hanahan D, Weinberg RA. Hallmarks of Cancer: The Next Generation. Cell. 2011;144:646-74
10. The Cancer Genome Atlas Research Network, Weinstein JN, Collisson EA, Mills GB, Shaw KRM, Ozenberger BA. et al. The Cancer Genome Atlas Pan-Cancer analysis project. Nat Genet. 2013;45:1113-20
11. Rhodes DR, Yu J, Shanker K, Deshpande N, Varambally R, Ghosh D. et al. Large-scale meta-analysis of cancer microarray data identifies common transcriptional profiles of neoplastic transformation and progression. Proc Natl Acad Sci U S A. 2004;101:9309-14
12. Rhodes DR, Chinnaiyan AM. Integrative analysis of the cancer transcriptome. Nat Genet. 2005;37:S31-7
13. Lovén J, Orlando DA, Sigova AA, Lin CY, Rahl PB, Burge CB. et al. Revisiting global gene expression analysis. Cell. 2012;151:476-82
14. Risso D, Ngai J, Speed TP, Dudoit S. Normalization of RNA-seq data using factor analysis of control genes or samples. Nat Biotechnol. 2014;32:896-902
15. Li J, Tibshirani R. Finding consistent patterns: A nonparametric approach for identifying differential expression in RNA-Seq data. Stat Methods Med Res. 2013;22:519-36
16. Lin B, Zhang L-F, Chen X. LFCseq: a nonparametric approach for differential expression analysis of RNA-seq data. BMC Genomics. 2014;15:S7
17. Tarazona S, García-Alcalde F, Dopazo J, Ferrer A, Conesa A. Differential expression in RNA-seq: A matter of depth. Genome Res. 2011;21:2213-23
18. Robinson MD, McCarthy DJ, Smyth GK. edgeR: a Bioconductor package for differential expression analysis of digital gene expression data. Bioinforma Oxf Engl. 2010;26:139-40
19. Anders S, Huber W. Differential expression analysis for sequence count data. Genome Biol. 2010;11:R106
20. Leng N, Dawson JA, Thomson JA, Ruotti V, Rissman AI, Smits BMG. et al. EBSeq: an empirical Bayes hierarchical model for inference in RNA-seq experiments. Bioinforma Oxf Engl. 2013;29:1035-43
21. Hardcastle TJ, Kelly KA. baySeq: empirical Bayesian methods for identifying differential expression in sequence count data. BMC Bioinformatics. 2010;11:422
22. Baker SC, Bauer SR, Beyer RP, Brenton JD, Bromley B, Burrill J. et al. The External RNA Controls Consortium: a progress report. Nat Methods. 2005;2:731-4
23. Jiang L, Schlesinger F, Davis CA, Zhang Y, Li R, Salit M. et al. Synthetic spike-in standards for RNA-seq experiments. Genome Res. 2011;21:1543-51
24. Chen H, He X. The convergent cancer evolution toward a single cellular destination. Mol Biol Evol. 2015 msv212
25. Kaczkowski B, Tanaka Y, Kawaji H, Sandelin A, Andersson R, Itoh M. et al. Transcriptome Analysis of Recurrently Deregulated Genes across Multiple Cancers Identifies New Pan-Cancer Biomarkers. Cancer Res. 2015
26. Law CW, Chen Y, Shi W, Smyth GK. voom: precision weights unlock linear model analysis tools for RNA-seq read counts. Genome Biol. 2014;15:R29
27. Kroemer G, Pouyssegur J. Tumor cell metabolism: cancer's Achilles' heel. Cancer Cell. 2008;13:472-82
28. Lund AH, van Lohuizen M. Epigenetics and cancer. Genes Dev. 2004;18:2315-35
29. Mani A, Gelmann EP. The ubiquitin-proteasome pathway and its role in cancer. J Clin Oncol Off J Am Soc Clin Oncol. 2005;23:4776-89
30. Panigrahy D, Singer S, Shen LQ, Butterfield CE, Freedman DA, Chen EJ. et al. PPARgamma ligands inhibit primary tumor growth and metastasis by inhibiting angiogenesis. J Clin Invest. 2002;110:923-32
31. Zhou X, Ma L, Li J, Gu J, Shi Q, Yu R. Effects of SEMA3G on migration and invasion of glioma cells. Oncol Rep. 2012;28:269-75
32. Gil M, Seshadri M, Komorowski MP, Abrams SI, Kozbor D. Targeting CXCL12/CXCR4 signaling with oncolytic virotherapy disrupts tumor vasculature and inhibits breast cancer metastases. Proc Natl Acad Sci U S A. 2013;110:E1291-1300
33. Acharyya S, Oskarsson T, Vanharanta S, Malladi S, Kim J, Morris PG. et al. A CXCL1 paracrine network links cancer chemoresistance and metastasis. Cell. 2012;150:165-78
34. Markiewski MM, Lambris JD. Is complement good or bad for cancer patients? A new perspective on an old dilemma. Trends Immunol. 2009;30:286-92
Author contact
![]() Corresponding authors: Dr. Qing-Peng Kong, State Key Laboratory of Genetic Resources and Evolution, Kunming Institute of Zoology, Chinese Academy of Sciences, Kunming 650223, China. Tel/Fax: +86-871-68125403; Email: kongqpkiz.ac.cn Dr. Yong-Bin Chen, Key Laboratory of Animal Models and Human Disease Mechanisms, Kunming Institute of Zoology, Chinese Academy of Sciences, Kunming 650223, China. Tel/Fax: +86-871-65176312; Email: ybchenkiz.ac.cn
Corresponding authors: Dr. Qing-Peng Kong, State Key Laboratory of Genetic Resources and Evolution, Kunming Institute of Zoology, Chinese Academy of Sciences, Kunming 650223, China. Tel/Fax: +86-871-68125403; Email: kongqpkiz.ac.cn Dr. Yong-Bin Chen, Key Laboratory of Animal Models and Human Disease Mechanisms, Kunming Institute of Zoology, Chinese Academy of Sciences, Kunming 650223, China. Tel/Fax: +86-871-65176312; Email: ybchenkiz.ac.cn
Citation styles
APA
Li, Q.G., He, Y.H., Wu, H., Yang, C.P., Pu, S.Y., Fan, S.Q., Jiang, L.P., Shen, Q.S., Wang, X.X., Chen, X.Q., Yu, Q., Li, Y., Sun, C., Wang, X., Zhou, J., Li, H.P., Chen, Y.B., Kong, Q.P. (2017). A Normalization-Free and Nonparametric Method Sharpens Large-Scale Transcriptome Analysis and Reveals Common Gene Alteration Patterns in Cancers. Theranostics, 7(11), 2888-2899. https://doi.org/10.7150/thno.19425.
ACS
Li, Q.G.; He, Y.H.; Wu, H.; Yang, C.P.; Pu, S.Y.; Fan, S.Q.; Jiang, L.P.; Shen, Q.S.; Wang, X.X.; Chen, X.Q.; Yu, Q.; Li, Y.; Sun, C.; Wang, X.; Zhou, J.; Li, H.P.; Chen, Y.B.; Kong, Q.P. A Normalization-Free and Nonparametric Method Sharpens Large-Scale Transcriptome Analysis and Reveals Common Gene Alteration Patterns in Cancers. Theranostics 2017, 7 (11), 2888-2899. DOI: 10.7150/thno.19425.
NLM
Li QG, He YH, Wu H, Yang CP, Pu SY, Fan SQ, Jiang LP, Shen QS, Wang XX, Chen XQ, Yu Q, Li Y, Sun C, Wang X, Zhou J, Li HP, Chen YB, Kong QP. A Normalization-Free and Nonparametric Method Sharpens Large-Scale Transcriptome Analysis and Reveals Common Gene Alteration Patterns in Cancers. Theranostics 2017; 7(11):2888-2899. doi:10.7150/thno.19425. https://www.thno.org/v07p2888.htm
CSE
Li QG, He YH, Wu H, Yang CP, Pu SY, Fan SQ, Jiang LP, Shen QS, Wang XX, Chen XQ, Yu Q, Li Y, Sun C, Wang X, Zhou J, Li HP, Chen YB, Kong QP. 2017. A Normalization-Free and Nonparametric Method Sharpens Large-Scale Transcriptome Analysis and Reveals Common Gene Alteration Patterns in Cancers. Theranostics. 7(11):2888-2899.
This is an open access article distributed under the terms of the Creative Commons Attribution (CC BY-NC) license (https://creativecommons.org/licenses/by-nc/4.0/). See http://ivyspring.com/terms for full terms and conditions.