Theranostics
13.3
Impact Factor
- Current Issue
- Advance Articles
- Volume 16; 2026
- Volume 15; 2025
- Volume 14; 2024
- Volume 13; 2023
- Volume 12; 2022
- Archive
- Cover Images
- Cover Suggestion
- Special Issues
Top
Introduction
Materials and Methods
Results and Discussion
Conclusion
Supplementary Material
Acknowledgements
References
Introduction
Materials and Methods
Results and Discussion
Conclusion
Supplementary Material
Acknowledgements
References
International Journal of Biological Sciences
International Journal of Medical Sciences
 Global reach, higher impact

Theranostics 2017; 7(5):1257-1265. doi:10.7150/thno.18238 This issue Cite
Research Paper
Design and Development of Fluorescent Vemurafenib Analogs for In Vivo Imaging
Hannes Mikula1*, Shawn Stapleton1*, Rainer H. Kohler1, Claudio Vinegoni1, Ralph Weissleder1, 2 ![]()
1. Center for Systems Biology, Massachusetts General Hospital, 185 Cambridge Street, CPZN 5206, Boston, MA, 02114, USA;
2. Department of Systems Biology, Harvard Medical School, 200 Longwood Ave, Boston, MA, 02115, USA.
* These authors contributed equally
Received 2016-11-7; Accepted 2016-12-17; Published 2017-3-6
Citation:
Mikula H, Stapleton S, Kohler RH, Vinegoni C, Weissleder R. Design and Development of Fluorescent Vemurafenib Analogs for In Vivo Imaging. Theranostics 2017; 7(5):1257-1265. doi:10.7150/thno.18238. https://www.thno.org/v07p1257.htm
Other stylesAbstract

Herein we describe fluorescent derivatives of vemurafenib to probe therapeutic BRAF inhibition in live cells and in vivo. The compounds were evaluated and compared by determining target binding, inhibition of mutant BRAF melanoma cell lines and live cell imaging. We show that vemurafenib-BODIPY is a superior imaging drug to visualize the targets of vemurafenib in live cells and in vivo in non-resistant and resistant melanoma tumors.
Keywords: fluorescence microscopy, imaging agents, kinase inhibitor, BRAF
Introduction
The discovery of genetic alterations that are principally responsible for the formation of cancer has provided the basis for advancing targeted therapies for patients with metastatic disease [1, 2]. The BRAF gene was identified as a driver oncogene in 2002 and shown to be the most commonly mutated oncogene in melanoma (50% of all cases) [3]. Furthermore, BRAF gene mutations are present in 30-50% of thyroid cancer, 30% of low-grade ovarian cancers and 15% of colon cancers as well as in a number of other malignancies (totaling 7% of all human cancer diseases) [4], but additional BRAF-mutated forms are still being identified [5]. The BRAF protein is a member of the Raf family of serine threonine kinases, which are part of the Ras/RAF/MEK/ERK mitogen activated protein kinase (MAPK) signal transduction cascade that controls cell proliferation and survival (Fig. 1) [6]. The most common and best studied mutation of the BRAF gene is the glutamic acid substitution of valine at position 600 (V600E) within the kinase domain. This mutation results in a protein that remains in the active confirmation with an 800-fold increased kinase activity compared with its wild-type counterpart, leading to uncontrolled proliferation and growth of cells expressing BRAFV600E [7].
Vemurafenib (Vem, PLX4032, Plexxikon/Roche) is a small molecule, non-covalent tyrosine kinase inhibitor primarily directed towards the BRAFV600E mutation. It acts in a competitive manner to limit ATP binding, thereby reducing activation of the MAPK pathway and cell proliferation. Vemurafenib is clinically approved for the treatment of metastatic and non-resectable melanoma that harbor the BRAFV600E mutation. As a monotherapy, it substantially increases efficacy with an overall response rate of 48%, compared to 5% with chemotherapy using dacarbazine [8]. However, a durable response requires near-complete inhibition of the BRAF pathway, requiring the administration of relatively large doses of the drug (960 mg twice a day) and prolonged systemic drug exposure (area under the curve: AUC0-24 >300 μM h) [9]. Furthermore, roughly half of patients do not respond suggesting the predisposition to drug resistance, and those who initially respond eventually develop resistance after only a few months.
Figure 1
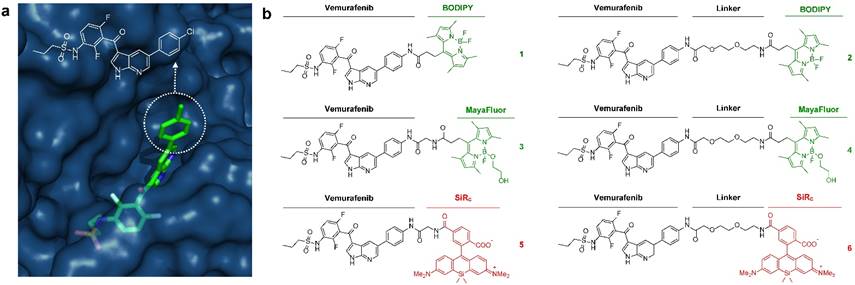
Development of fluorescently labeled vemurafenib imaging agents. (a) Folded structure of mutant BRAFV600E protein with vemurafenib inside the ATP binding site (PDB: 3OG7); (b) Synthesized fluorescent derivatives 1-6 of vemurafenib.
The mechanisms driving the inadequate duration of response have yet to be fully appreciated, and several studies indicate that intrinsic and acquired resistance are the leading culprits [10-14]. However, other factors include: complex poly-pharmacodynamics [15], high cell-to-cell variability in both epigenetic and genetic properties of melanoma [16, 17], and influences of the tumor microenvironment to limit effective drug distribution [18].
Pharmacokinetic imaging of fluorescent drug derivatives at the cellular and sub-cellular level can reveal novel insight into drug action in vivo, including target selectivity, kinetics, drug exposure, the presence of resistance mechanisms, and pharmacodynamic effects [19-22].
Here we present the development and validation of fluorescent imaging agents based on the structure of vemurafenib, a non-covalent inhibitor that is known to display similar potency for several cytoplasmic targets, e.g. SRMS (18nM), ACK1 (19nM), BRAFV600E (31nM), c-RAF-1 (48nM) and even wild-type BRAF with only 3-fold less potency (100 nM) compared to the mutant form [9]. Given its polypharmacological nature, we focused on the visualization of all targets of vemurafenib. To the best of our knowledge, besides immunofluorescence using commercially available BRAF antibodies (e.g. abcam, LSBio) no imaging agent for BRAF or any BRAF inhibitor has been reported so far.
Materials and Methods
Chemical Synthesis and Compound Characterization
A detailed description of the synthesis of all fluorescent vemurafenib derivatives and copies of NMR spectra can be found in the Supplementary Materials.
Cell Lines
The vemurafenib-resistant and non-resistant A375 and SK-MEL-28 cell lines were generously provided by Ji Zhenyu and Hensin Tsao (Massachusetts General Hospital, Boston, MA, USA). A375 and SK-MEL-28 cells (both resistant and non-resistant) were grown in Dublecos Minimum Essential Media (DMEM) or Minimum Essential Media (MEM) respectively. The media was supplemented with 10% fetal bovine serum, 100 I.U. penicillin, 100 μg/mL streptomycin, and 2 mM L-glutamine. The following quality controls have been performed in all cell culture experiments: mycoplasma testing (negative), monitoring of cell growth, cell size and morphology. We have not observed any effects on the morphology of all used melanoma cells after treatment with vemurafenib, vemurafenib-dye conjugates or both as described in this study.
Cell Viability and BRAFV600E Binding Affinity
For cell proliferation/viability assays, cells were plated at 5000 cells per well in 96-well plates (Corning assay well plates, Corning, NY, USA) and grown for 24 hrs. Cells were then treated with increasing concentrations of vemurafenib derivatives (0 nM, 0.001 nM, 0.01 nM, 0.1 nM, 1 nM, 10 nM, 100 nM, 1 µM, 10 µM, 50 µM) for 72 hrs. PrestoBlue® Cell Viability Reagent (ThermoFisher Scientific) was added as a 10X solution and plates were read out on a Tecan Safire 2 Platereader (Tecan Trading AG, Switzerland) after 10-30 min. The binding affinity of vemurafenib derivatives to BRAFV600E was assayed using the LanthaScreen® Eu Kinase Binding Assay (ThermoFisher Scientific) following the manufacturer's protocol. All reagents and BRAF recombinant human protein (sold as BRAF[V599E], which is equivalent to BRAFV600E) were purchased from ThermoFisher Scientific/Life technologies. Low volume 384-well plates (Corning, NY, USA) were used and read out using a Perkin Elmer EnVision Multilabel Reader (Waltham, MA, USA).
BFP and Apple expressing A375 cell lines
For in vivo experiments H2B-BFP A375 and H2B-Apple A375R cells lines were constructed through transduction with a pTag-H2B-BFP or pTag-H2B-Apple construct, respectively, using X-tremeGENE HP transfection reagent (Roches). Single clones were selected using fluorescent activated cell sorting, choosing the top 10% brightest cells. Fluorescent cells were maintained in the previously described DMEM media with the addition of 1.5 μg/mL of puromycin.
Live cell fluorescence microscopic imaging
SK-MEL-28 and A375 cells were plated at 30000 cells per well in 96-well plates (µ-Plate 96 Well ibiTreat: #1.5 polymer coverslip, tissue culture treated, sterilized; ibidi, Madison, WI, USA) and grown for 24 hrs. On the day of imaging, cells were incubated with a final concentration of 1 μM (0.1% dimethyl sulfoxide (DMSO) in growth media) of vemurafenib derivatives for 60 min at 37°C. Cells were washed three times with media (15 min each) and live cells were imaged in a humidified environmental chamber of a DeltaVision microscope (Applied Precision, Issaquah, WA). High-resolution imaging in melanoma cells was carried out as described above using a customized Olympus FV1000 system based on a BX61-WI confocal microscope (Olympus America).
Competition imaging experiment
A375, A375R, SK-MEL-28, and SK-MEL-28R cells were plated at 30000 cells per well in 96-well plates (µ-Plate 96 Well ibiTreat: #1.5 polymer coverslip, tissue culture treated, sterilized; ibidi, Madison, WI, USA) and were grown for 24 hrs. On the day of imaging, cells were incubated with 0, 1, 5, 10, 50, and 100 μM concentrations of vemurafenib (0.1% DMSO in growth media) for 30 min at 37°C. Without washing, cells were co-incubated with fluorescent vemurafenib derivatives (1 μM final concentration in growth media) and vemurafenib for 120 min at 37°C. Cells were washed three times with media (15 min each) and live cells were imaged in a humidified environmental chamber of a DeltaVision microscope (Applied Precision, Issaquah, WA).
Intravital imaging
All animal experiments were carried out in accordance with guidelines from the Institutional Subcommittee on Research Animal Care. Nude mice (Cox7, Massachusetts General Hospital) were surgically implanted with a dorsal skin window chamber. Approximately 5×10⁶ A375 cells co-mixed with 1×10⁶ A375R cells (5:1 ratio), suspended in phosphate buffered saline (PBS), were implanted under the fascia and allowed to grow for ∼10 to 12 days. As A375R cells showed faster proliferation rates we empirically found that using a 5:1 ratio (A375:A375R) at time of implantation yields similar cell counts at time of imaging several days later. This facilitates a balanced analysis in both cell types. As soon as the tumors became vascularized and had reached 1-2 mm in size, mice were anesthetized with 2% isoflurane in 2 L/minute oxygen on a heated microscope stage. They were then injected via a lateral tail vein catheter with 50 µL of Angiospark-680 (Perkin Elmer, Waltham, MA) or 2 MDa amino-dextran labeled with FITC N-hydroxysuccinimide (NHS) ester (Invitrogen, Grand Island, NY). Vascularized regions of interest in the tumor were identified by the vessel probe and by the H2B-BFP and H2B-Apple tumor signals; regions with minimal out-of-plane vessels and a substantial mixture of vemurafenib-resistant and non-resistant A375 cells were chosen for imaging. Imaging was initiated prior to injection of fluorescently labeled drug, which was formulated by dissolving 4 µL of a 50 mM solution in DMSO followed by adding an additional 11 µL of DMSO and 15 µL of solutol. 120 µL of PBS was then slowly added and vortexed for 1 minute to obtain a final injection volume of 150 µL. Hence, 200 nmol of vemurafenib-dye derivative have been injected resulting in an approximate dose of 10 µmol/kg. Measurements were repeated in five tumor bearing mice.
Images were collected as a function of depth (z-stack, 4 µm step size) using a customized Olympus FV1000 system based on a BX61-WI confocal microscope (Olympus America). A XLUMPLFLN 20× water immersion objective (NA 1.0, Olympus America) was used for data collection. BODIPY (boron dipyrromethene), H2B-Apple, and vascular probes were scanned and excited sequentially using a 405 nm, a 473-nm, a 559-nm and/or a 633 nm diode laser, respectively, in combination with a DM405 488/559/635-nm dichroic beam splitter. Emitted light was then separated and collected using appropriate combinations of beam splitters (SDM473, SDM560, and/or SDM 640) and emission filters BA430-455, BA490-540, BA575-620, BA575-675, and/or BA655-755 (all Olympus America). A separate cohort of tumors was used to determine appropriate voltage and laser power settings to minimize saturation and to ensure that no photobleaching or phototoxicity occurred. The z-stacks were acquired at 0 h, 1 h, 3 h, 7 h, and 24 h post-injection of the fluorescent derivative.
Analysis of Single-Cell Pharmacokinetics
Quantification of the single-cell intensity of the fluorescent derivative was performed using CellProfiler [23]. The zStacks were imported into CellProfiler and the nuclei were segmented using an automatic thresholding algorithm to identify non-resistant (H2B-BFP) and resistant (H2B-Apple) A375 cells. A region growing algorithm was used to extend the previously identified nuclear region, followed by taking the difference between the extended and nuclei regions to isolate the cytoplasm. CellProfiler automatically ensured non-overlapping cytoplasmic regions between cells. The analysis was performed on each slice in the zStack and the mean cytoplasm intensity was record for cell. The data was imported into MATLAB, plotted for each mouse and time point as a function of depth. The data was then filtered to exclude cells with saturation signal and slices at a depth whereby substantial attenuation of light limited the ability for accurate quantification. The final single-cell data was conglomerated for each mouse and plotted as a function of time. The single-cell intensities were normalized to the median pre-injection intensity.
Results and Discussion
We sought to identify a derivative with optimal pharmacokinetics and imaging characteristics. Structural analysis of binding between vemurafenib and the folded BRAFV600E protein suggests that the p-chlorophenyl substituent on vemurafenib could be labeled with minimal perturbation to drug binding (Fig. 1a). This assumption is supported by the similar binding affinities and properties of vemurafenib and the related BRAFV600E inhibitor PLX4720 [5, 15], which does not contain the p-chlorophenyl group (Fig. S1).
Aiming for an imaging agent it would have been possible to select PLX4720 as core structure, but considering the folded structure of mutant BRAF with the drug inside the binding site (Fig. 1a) and the required distance between the pocket and a sterically demanding fluorescent dye we preferred to use the core structure of vemurafenib.
Starting from a vemurafenib precursor a modifiable derivative was synthesized by replacing p-chlorophenyl with p-aminophenyl generating a free NH2 group for further modification. This intermediate was conjugated to different fluorophores with or without a short linker in-between (Fig. S2). We focused on three known fluorescent moieties with different physical properties to obtain a library of six vemurafenib-fluorescent dye conjugates (Fig. 1b). In general, the amounts of fluorophore used in molecular imaging probes are typically much lower than the toxic doses described in the literature [24].
BODIPY (boron dipyrromethene) has frequently been used as fluorescent dye for the preparation of imaging drugs [21, 25-31]. In this study a slightly modified BODIPY (substituted BODIPY® 505/515) was used for the preparation of conjugates 1 and 2. Recently, Courtis et al. reported a method to modify the core structure of BODIPY by replacing a fluorine with ethylene glycol leading to the development of MayaFluor dyes that exhibit increased hydrophilicity and improved properties for imaging applications [32]. The BODIPY derivative previously used for the preparation of 1 and 2 was modified to obtain a carboxyl-modified MayaFluor, which was then used for the synthesis of 3 and 4. Furthermore, silicon rhodamines (SiR) have emerged as highly promising fluorescent dyes for the synthesis of imaging probes [20, 33-38] and it was shown that carboxylated silicon rhodamine (SiRC, SiR-COOH) is advantageous over other SiR derivatives [39]. Hence, SiRC was used in this study for the preparation of 5 and 6. Selected physical properties of all synthesized vemurafenib derivatives (1-6) are summarized in Table S1, for synthetic details see Supporting Information and Fig. S2.
We next set out to determine whether 1-6 (i) bind to BRAFV600E with similar pharmacological activity (EC50), (ii) are cell membrane permeable and localize to the cytoplasm, the main site of BRAFV600E expression, and (iii) can be competitively blocked by the parent compound in vitro. Due to the poly-pharmacological nature of vemurafenib, the competitive imaging assay provided a test of the drug-dye conjugates' ability to mimic the target specificity of vemurafenib. Two melanoma cell lines were chosen for in vitro characterization: A375 and SK-MEL-28. Of the six drug-dye conjugates, 1 (Vemurafenib-BODIPY), 3 (Vemurafenib-MayaFluor), and 6 (Vemurafenib-Linker-SiRC) have EC50 values for inhibition of proliferation and binding affinities comparable to the parent drug (Fig. 2a). Live cell imaging showed that 1 efficiently penetrates into the cytoplasm of melanoma cells and has prolonged retention (Fig. 2b). In comparison, the efficiency of cytoplasmic penetration and retention of 3 is poor. 6 showed efficient penetration, but rapid efflux suggested limited target engagement and/or rapid dissociation kinetics. We hypothesize that attaching a hydrophilic moiety (e.g. MayaFluor, SiRC or short polyethyleneglycol (PEG)- linkers) leads to faster dissociation from the target, whereas lipophilic BODIPY might serve as a 'hydrophobic lid' preventing rapid exchange of bound 1 by water. Moreover, these findings and our hypothesis could also explain the improved properties of vemurafenib compared to PLX4720 despite similar target affinity [5, 15] due to increased hydrophobicity caused by the additional p-chlorophenyl substituent (Fig. S1).
Live cell imaging using laser scanning microscopy showed that 1 distributes predominantly within the cytosol of both melanoma cell lines (Fig. 2c). Previous studies have reported sub-cellular localization of BRAFV600E primarily within the cytosol [40], in agreement with our observations. Other reports have suggested BRAFV600E may also localize to the mitochondria and Golgi apparatus, but this was not directly observed in our study [41, 42].
Competitive imaging revealed that apriori exposure of live cells to vemurafenib efficiently blocked the binding of 1 in a dose dependent manner (reasonable for a non-covalent inhibitor) demonstrating a similar target specificity compared to vemurafenib (Fig. 3 and Fig. S3). The sub-cellular localization, target specificity, and slow dissociation kinetics further demonstrate that 1 is an exemplary imaging agent to visualize the targets of vemurafenib.
Figure 2
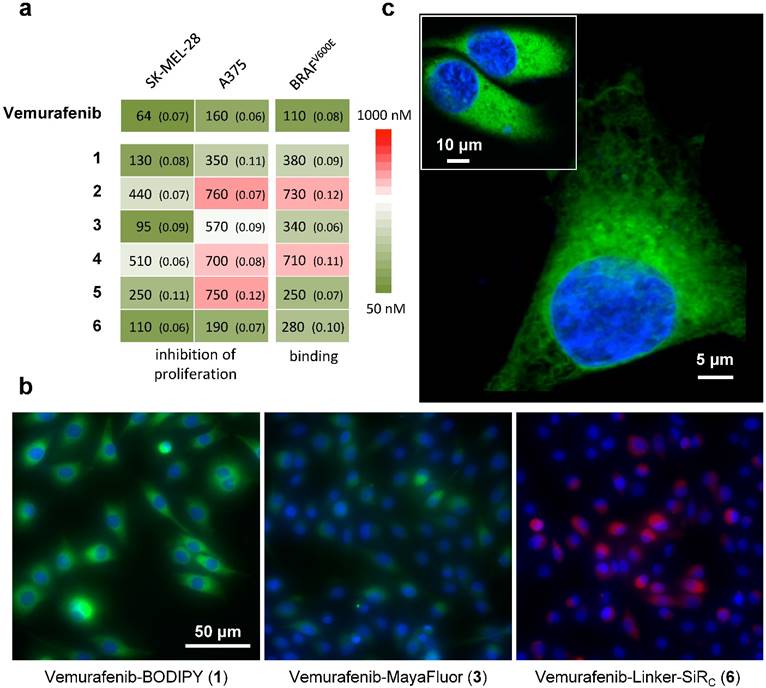
In vitro assays identify vemurafenib-BODIPY (1) as a superior imaging agent. (a) Inhibition of proliferation and binding affinity (EC50, nM; standard error of logEC50 in parentheses) of 1, 3 and 6 were closely associated with the parent compound. All compounds showed EC50 values >5000 nM for inhibition of the proliferation of resistant cells. (b) In vitro imaging of 1 demonstrates prolonged cytoplasmic retention with minimal background fluorescence, in contrast to 3 and 6, in SK-MEL-28 cells. [blue: HOECHST 33342, green: BODIPY, red: SiRC] (c) High-resolution microscopy of 1in an A375 cell and SK-MEL-28 cells (inset).
Figure 3
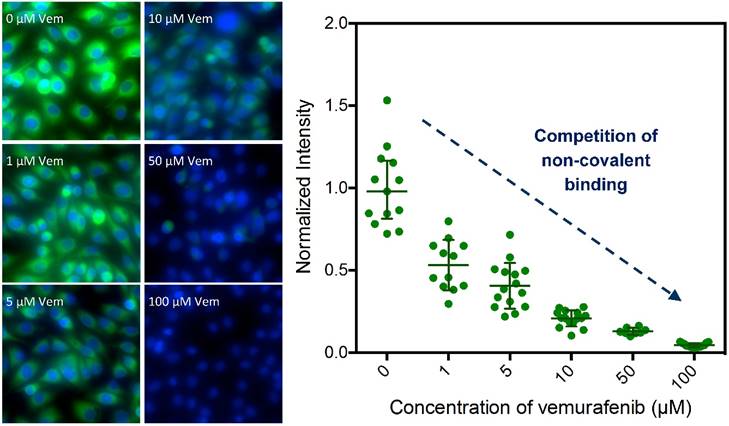
Competitive imaging demonstrates the target specificity of 1. Imaging of 1 (Vemurafenib-BODIPY, 1 μM) in SK-MEL-28 cells in competition with increasing concentrations (0- to 100-fold excess) of parent drug vemurafenib (Vem); data presented as mean ± SD normalized to the 0-fold measurements [blue: HOECHST 33342, green: BODIPY].
We next explored the single-cell pharmacokinetics (PK) in vivo of the leading compound 1, vemurafenib-BODIPY (Fig. 4a). In vivo experiments were performed in a dorsal skin fold window chamber model inoculated with a mixed population of vemurafenib-resistant A375 H2B-Apple cells (A375R; EC50 > 5000 nM for inhibition of proliferation) and non-resistant A375 H2B-BFP (A375; EC50 = 160 nM for inhibition of proliferation). Subcellular color-coded in vivo imaging was performed based on previously reported methods [43-45]. Single-cell analysis of in vivo PK imaging was performed using CellProfiler (see Materials and Methods, and Fig. S4). 1 was administered through the tail vein at a dose of 8 mg/kg (equivalent to 5 mg/kg of the parent drug vemurafenib). The agent rapidly diffused across the tumor and penetrated into A375/A375R cells over the course of 1 h. Clearance from the vasculature and interstitial compartment was observed at 3-7 h post-injection, while the agent remained inside the A375/A375R cells. Minimal residual agent was detected in the tumor at 24 h. In comparison, in vivo PK imaging of 3 and 6 showed non-specific binding to collagen fibers at 1 h, and negligible tumor cell uptake after 5 h (Fig. S5).
Quantification of the single-cell kinetics of 1 made in five separate tumors revealed remarkable spatio-temporal heterogeneity in tumor cell uptake and retention (Fig. 4b), which has also been compared to the heterogeneous uptake of vemurafenib-BODIPY in vitro as observed by live cell fluorescence microscopy showing a significantly wider range in vivo (Fig. S6). Peak intensity was observed at 1 h post injection, and also had the largest intercellular heterogeneity in uptake. The single-cell heterogeneity was driven primarily by the proximity of cells to blood vessels, with high-local concentrations of the agent found in cells closest to vasculature. At 3 h, the single-cell heterogeneity more closely reflects variations in the intrinsic cell properties, such as target expression. The heterogeneous delivery of 1 reflects substantial variability in target engagement and may help explain the initial explosive response but limited duration following vemurafenib treatment [9, 46, 47] due to the intercellular heterogeneity of the drug concentration in the tumor.
Several mechanisms of acquired resistance have been explored for vemurafenib, including: BRAFV600E over-expression (amplification) [12, 48], bypass of BRAFV600E inhibition through activation of complimentary pathways [49], and target modification for example through the emergence of spliced BRAFV600E that retains the ability to dimerize and activate the MAPK signaling pathway [11]. It is anticipated that the latter two mechanisms do not significantly alter the single-cell PK of vemurafenib. We observed only negligible differences in single-cell PK between vemurafenib-resistant and non-resistant A375 melanoma cells. These results are congruent with the hypothesis that A375R cells expressing a spliced variant of BRAFV600E will have similar binding kinetics for vemurafenib [50].
Figure 4
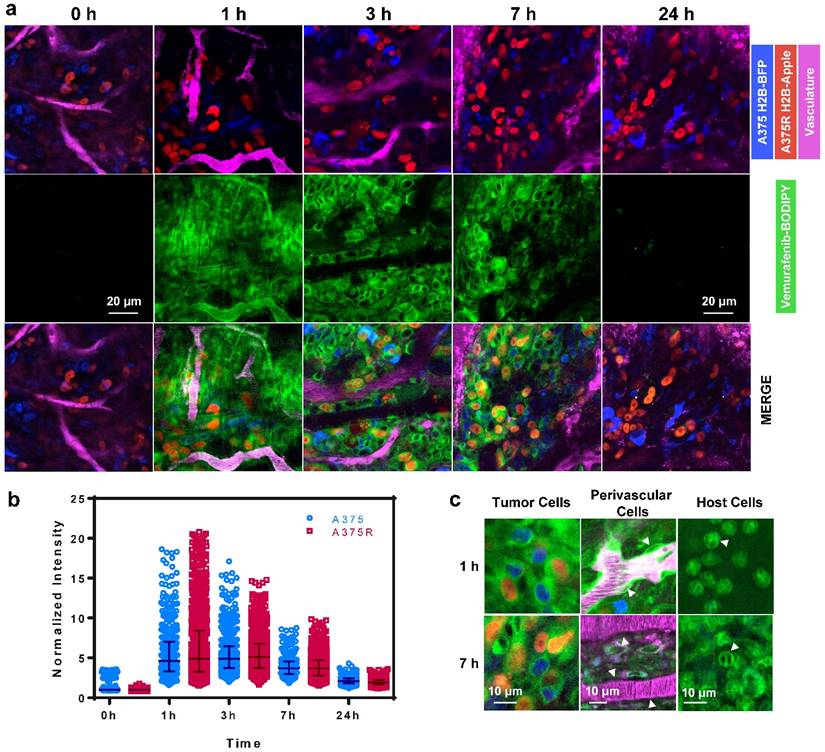
In vivo imaging reveals the pharmacokinetics of 1 in melanoma. (a) 1 rapidly transports across blood vessels, through the interstitium and accumulates in all cells. (b) PK imaging and quantification of single-cell kinetics reveals specific retention in vemurafenib-resistant (A375R) and non-resistant (A375) melanoma cells. Each point represents the cytoplasmic intensity of vemurafenib-BOPIDY (1) in tumor cells (n=5 tumors). Data is normalized to the median of the 0 h measurements. Bars represent the median and interquartile range of the aggregated single-cell measurements. (c) Within 1 h the agent localizes to the cytoplasm of resistant and non-resistant A375 cells, perivascular cells (arrows), and other host cells (neutrophil-like cells; arrows). After 7 h 1 is retained in melanoma and neutrophil-like cells, but cleared from perivascular cells.
Consistent with in vitro data, 1 was uniformly distributed in the cytoplasm of A375 and A375R tumor cells in vivo (Fig. 4c). We also observed the cytoplasmic uptake of the agent in non-tumor cells including perivascular, pericyte-like, cells in tumor and healthy tissue, and in host, neutrophil-like, cells. Vemurafenib-BODIPY (1) was not retained in perivascular cells, but was persistent in neutrophil-like cells at 7 h post-injection, which we hypothesize can be explained by the polypharmacological nature of vemurafenib. Binding to various targets with different affinities might be the reason for different PK properties in different cell types. These results may help further elucidate potential off-target effects of vemurafenib that may have enhancing or antagonistic ramifications towards tumor response, as well as contribute to toxicity.
Conclusion
In summary, we have synthesized and characterized several fluorescently labeled derivatives of the approved BRAF inhibitor vemurafenib. All compounds were evaluated focusing on binding properties, inhibition of proliferation of resistant and non-resistant melanoma cells, and by fluorescence microscopy. We finally identified vemurafenib-BODIPY as a superior imaging agent to visualize the intracellular targets of vemurafenib and showed its application in live cell and in vivo imaging. We observed heterogeneous delivery to xenografted melanoma tumors, similar accumulation in resistant and non-resistant A375 melanoma cells, and retention in host cells.
We aim to use our probe to study the polypharmacological properties of vemurafenib in other types of melanoma focusing on various mechanisms of resistance, and to investigate target distribution and drug uptake of tumors during treatment. In combination with a recently reported mouse model vemurafenib-BODIPY can further be used to study patient derived orthotopic xenografts with emphasis on intrinsic and acquired resistance [51]. In case of resistance through amplification of BRAFV600E vemurafenib-BODIPY might even be applied to distinguish sensitive and resistant cancer cells. Overall, we are convinced that our new imaging agent and the reported findings will lead to several applications and help achieving a better understanding of the underlying mechanisms of BRAF inhibition and vemurafenib treatment.
Supplementary Material
Additional File 1Supplementary tables and figures.
Chemical synthesis and NMR spectra.
Acknowledgements
We thank Katy Yang for providing the construct used to transduce the melanoma cell lines, David Pirovich for assistance with the window chamber surgery, and Zhenyu Ji and Hensin Tsao for kindly providing resistant A375 and SK-MEL-28 cells. This work was supported in parts by P50GM107618, R01EB010011, R01HL122208, and 1R01CA164448. H.M. was supported by a Schrödinger Fellowship of the Austrian Science Fund (FWF, J 3586) and S.S. was supported by the National Science and Engineering Research Council of Canada (NSERC) Post-Doctoral Fellowship.
Competing Interests
The authors have declared that no competing interest exists.
References
1. Druker BJ, Talpaz M, Resta DJ, Peng B, Buchdunger E, Ford JM. et al. Efficacy and Safety of a Specific Inhibitor of the BCR-ABL Tyrosine Kinase in Chronic Myeloid Leukemia. New England Journal of Medicine. 2001;344:1031-7
2. Lynch TJ, Bell DW, Sordella R, Gurubhagavatula S, Okimoto RA, Brannigan BW. et al. Activating Mutations in the Epidermal Growth Factor Receptor Underlying Responsiveness of Non-Small-Cell Lung Cancer to Gefitinib. New England Journal of Medicine. 2004;350:2129-39
3. Davies H, Bignell GR, Cox C, Stephens P, Edkins S, Clegg S. et al. Mutations of the BRAF gene in human cancer. Nature. 2002;417:949-54
4. Zambon A, Niculescu-Duvaz D, Niculescu-Duvaz I, Marais R, Springer CJ. BRAF as a therapeutic target: a patent review (2006 - 2012). Expert Opinion on Therapeutic Patents. 2013;23:155-64
5. Bollag G, Tsai J, Zhang J, Zhang C, Ibrahim P, Nolop K. et al. Vemurafenib: the first drug approved for BRAF-mutant cancer. Nature Revies Drug Discovery. 2012;11:873-86
6. Wellbrock C, Karasarides M, Marais R. The RAF proteins take centre stage. Nature Revies Molecular Cell Biology. 2004;5:875-85
7. Garnett MJ, Marais R. Guilty as charged: B-RAF is a human oncogene. Cancer Cell. 2004;6:313-9
8. Chapman PB, Hauschild A, Robert C, Haanen JB, Ascierto P, Larkin J. et al. Improved survival with vemurafenib in melanoma with BRAF V600E mutation. New England Journal of Medicine. 2011;364:2507-16
9. Bollag G, Hirth P, Tsai J, Zhang J, Ibrahim PN, Cho H. et al. Clinical efficacy of a RAF inhibitor needs broad target blockade in BRAF-mutant melanoma. Nature. 2010;467:596-9
10. Miao B, Ji Z, Tan L, Taylor M, Zhang J, Choi HG. et al. EPHA2 Is a Mediator of Vemurafenib Resistance and a Novel Therapeutic Target in Melanoma. Cancer Discovery. 2015;5:274-87
11. Poulikakos PI, Persaud Y, Janakiraman M, Kong X, Ng C, Moriceau G. et al. RAF inhibitor resistance is mediated by dimerization of aberrantly spliced BRAFV600E. Nature. 2011;480:387-90
12. Thakur MD, Salangsang F, Landman AS, Sellers WR, Pryer NK, Levesque MP. et al. Modelling vemurafenib resistance in melanoma reveals a strategy to forestall drug resistance. Nature. 2013;494:251-5
13. Wu C-P, Sim H-M, Huang Y-H, Liu Y-C, Hsiao S-H, Cheng H-W. et al. Overexpression of ATP-binding cassette transporter ABCG2 as a potential mechanism of acquired resistance to vemurafenib in BRAFV600E mutant cancer cells. Biochemical pharmacology. 2013;85:325-34
14. Lovly CM, Shaw AT. Molecular Pathways: Resistance to Kinase Inhibitors and Implications for Therapeutic Strategies. Clinical Cancer Research. 2014;20:2249-56
15. Tsai J, Lee JT, Wang W, Zhang J, Cho H, Mamo S. et al. Discovery of a selective inhibitor of oncogenic B-Raf kinase with potent antimelanoma activity. Proceedings of the National Academy of Sciences. 2008;105:3041-3046
16. McGranahan N, Swanton C. Biological and therapeutic impact of intratumor heterogeneity in cancer evolution. Cancer cell. 2015;27:15-26
17. Yancovitz M, Litterman A, Yoon J, Ng E, Shapiro RL, Berman RS. et al. Intra-and inter-tumor heterogeneity of BRAF V600E mutations in primary and metastatic melanoma. PloS one. 2012;7:e29336
18. Straussman R, Morikawa T, Shee K, Barzily-Rokni M, Qian ZR, Du J. et al. Tumour micro-environment elicits innate resistance to RAF inhibitors through HGF secretion. Nature. 2012;487:500-4
19. Laughney AM, Kim E, Sprachman MM, Miller MA, Kohler RH, Yang KS. et al. Single-cell pharmacokinetic imaging reveals a therapeutic strategy to overcome drug resistance to the microtubule inhibitor eribulin. Science translational medicine. 2014;6:261ra152-261ra152
20. Kim E, Yang KS, Kohler RH, Dubach JM, Mikula H, Weissleder R. Optimized Near-IR Fluorescent Agents for in Vivo Imaging of Btk Expression. Bioconjugate Chemistry. 2015;26:1513-8
21. Yang KS, Kohler RH, Landon M, Giedt R, Weissleder R. Single cell resolution in vivo imaging of DNA damage following PARP inhibition. Scientific Reports. 2015;5:10129
22. Thurber GM, Yang KS, Reiner T, Kohler RH, Sorger P, Mitchison T. et al. Single-cell and subcellular pharmacokinetic imaging allows insight into drug action in vivo. Nature communications. 2013;4:1504
23. Carpenter AE, Jones TR, Lamprecht MR, Clarke C, Kang IH, Friman O. et al. CellProfiler: image analysis software for identifying and quantifying cell phenotypes. Genome Biology. 2006;7:R100
24. Alford R, Simpson HM, Duberman J, Hill GC, Ogawa M, Regino C. et al. Toxicity of Organic Fluorophores Used in Molecular Imaging: Literature Review. Molecular Imaging. 2009;8:341-54
25. Dubach JM, Vinegoni C, Mazitschek R, Fumene Feruglio P, Cameron LA, Weissleder R. In vivo imaging of specific drug-target binding at subcellular resolution. Nature Communications. 2014;5:3946
26. Fishkin N. Maytansinoid-BODIPY Conjugates: Application to Microscale Determination of Drug Extinction Coefficients and for Quantification of Maytansinoid Analytes. Molecular Pharmaceutics. 2015;12:1745-51
27. Harrison C. Pharmacokinetics: Single-cell imaging adds insight into drug action. Nature Reviews Drug Discovery. 2013;12:264
28. Irwin CP, Portorreal Y, Brand C, Zhang Y, Desai P, Salinas B. et al. PARPi-FL - a Fluorescent PARP1 Inhibitor for Glioblastoma Imaging. Neoplasia. 2014;16:432-40
29. Loudet A, Burgess K. BODIPY Dyes and Their Derivatives: Syntheses and Spectroscopic Properties. Chemical Reviews. 2007;107:4891-932
30. Shukla S, Skoumbourdis AP, Walsh MJ, Hartz AMS, Fung KL, Wu C-P. et al. Synthesis and Characterization of a BODIPY Conjugate of the BCR-ABL Kinase Inhibitor Tasigna (Nilotinib): Evidence for Transport of Tasigna and Its Fluorescent Derivative by ABC Drug Transporters. Molecular Pharmaceutics. 2011;8:1292-302
31. Turetsky A, Kim E, Kohler RH, Miller MA, Weissleder R. Single cell imaging of Bruton's Tyrosine Kinase using an irreversible inhibitor. Scientific Reports. 2014;4:4782
32. Courtis AM, Santos SA, Guan Y, Hendricks JA, Ghosh B, Szantai-Kis DM. et al. Monoalkoxy BODIPYs—A Fluorophore Class for Bioimaging. Bioconjugate Chemistry. 2014;25:1043-51
33. Huang Y-L, Walker AS, Miller EW. A Photostable Silicon Rhodamine Platform for Optical Voltage Sensing. Journal of the American Chemical Society. 2015;137:10767-76
34. Koide Y, Urano Y, Hanaoka K, Piao W, Kusakabe M, Saito N. et al. Development of NIR Fluorescent Dyes Based on Si-rhodamine for in Vivo Imaging. Journal of the American Chemical Society. 2012;134:5029-31
35. Lukinavičius G, Umezawa K, Olivier N, Honigmann A, Yang G, Plass T. et al. A near-infrared fluorophore for live-cell super-resolution microscopy of cellular proteins. Nature Chemistry. 2013;5:132-9
36. Lukinavicius G, Johnsson K. Fluorescence microscopy: Strategic blinking. Nature Chemistry. 2014;6:663-4
37. Lukinavicius G, Reymond L, D'Este E, Masharina A, Gottfert F, Ta H. et al. Fluorogenic probes for live-cell imaging of the cytoskeleton. Nature Methods. 2014;11:731-3
38. Lukinavičius G, Blaukopf C, Pershagen E, Schena A, Reymond L, Derivery E. et al. SiR-Hoechst is a far-red DNA stain for live-cell nanoscopy. Nature Communications. 2015;6:8497
39. Kim E, Yang KS, Giedt RJ, Weissleder R. Red Si-rhodamine drug conjugates enable imaging in GFP cells. Chemical Communications. 2014;50:4504-7
40. Garnett MJ, Rana S, Paterson H, Barford D, Marais R. Wild-type and mutant B-RAF activate C-RAF through distinct mechanisms involving heterodimerization. Molecular Cell. 2005;20:963-9
41. Fan F, Feng L, He J, Wang X, Jiang X, Zhang Y. et al. RKTG sequesters B-Raf to the Golgi apparatus and inhibits the proliferation and tumorigenicity of human malignant melanoma cells. Carcinogenesis. 2008;29:1157-63
42. Lee MH, Lee SE, Kim DW, Ryu MJ, Kim SJ, Kim SJ. et al. Mitochondrial localization and regulation of BRAFV600E in thyroid cancer: a clinically used RAF inhibitor is unable to block the mitochondrial activities of BRAFV600E. The Journal of Clinical Endocrinology & Metabolism. 2011;96:E19-E30
43. Hoffman RM, Yang M. Subcellular imaging in the live mouse. Nature Protocols. 2006;1:775-82
44. Hoffman RM, Yang M. Color-coded fluorescence imaging of tumor-host interactions. Nature Protocols. 2006;1:928-35
45. Yang M, Jiang P, Hoffman RM. Whole-Body Subcellular Multicolor Imaging of Tumor-Host Interaction and Drug Response in Real Time. Cancer Research. 2007;67:5195-200
46. Flaherty KT, Puzanov I, Kim KB, Ribas A, McArthur GA, Sosman JA. et al. Inhibition of Mutated, Activated BRAF in Metastatic Melanoma. New England Journal of Medicine. 2010;363:809-19
47. Sosman JA, Kim KB, Schuchter L, Gonzalez R, Pavlick AC, Weber JS. et al. Survival in BRAF V600-Mutant Advanced Melanoma Treated with Vemurafenib. New England Journal of Medicine. 2012;366:707-14
48. Shi H, Moriceau G, Kong X, Lee M-K, Lee H, Koya RC. et al. Melanoma whole-exome sequencing identifies V600EB-RAF amplification-mediated acquired B-RAF inhibitor resistance. Nature Communications. 2012;3:724
49. Kaplan F, Shao Y, Mayberry M, Aplin A. Hyperactivation of MEK-ERK1/2 signaling and resistance to apoptosis induced by the oncogenic b-RAF inhibitor, PLX4720, in mutant n-RAS melanoma cells. Oncogene. 2011;30:366-71
50. Ji Z, Chen YE, Kumar R, Taylor M, Njauw C-NJ, Miao B. et al. Mitf modulates therapeutic resistance through EGFR signaling. Journal of Investigative Dermatology. 2015;135:1863-72
51. Kawaguchi K, Murakami T, Chmielowski B, Igarashi K, Kiyuna T, Unno M. et al. Vemurafenib-resistant BRAF-V600E-mutated melanoma is regressed by MEK-targeting drug trametinib, but not cobimetinib in a patient-derived orthotopic xenograft (PDOX) mouse model. Oncotarget. 2016 in press
Author contact
![]() Corresponding author: Prof. Ralph Weissleder, E-mail: rweisslederharvard.edu
Corresponding author: Prof. Ralph Weissleder, E-mail: rweisslederharvard.edu
Citation styles
APA
Mikula, H., Stapleton, S., Kohler, R.H., Vinegoni, C., Weissleder, R. (2017). Design and Development of Fluorescent Vemurafenib Analogs for In Vivo Imaging. Theranostics, 7(5), 1257-1265. https://doi.org/10.7150/thno.18238.
ACS
Mikula, H.; Stapleton, S.; Kohler, R.H.; Vinegoni, C.; Weissleder, R. Design and Development of Fluorescent Vemurafenib Analogs for In Vivo Imaging. Theranostics 2017, 7 (5), 1257-1265. DOI: 10.7150/thno.18238.
NLM
Mikula H, Stapleton S, Kohler RH, Vinegoni C, Weissleder R. Design and Development of Fluorescent Vemurafenib Analogs for In Vivo Imaging. Theranostics 2017; 7(5):1257-1265. doi:10.7150/thno.18238. https://www.thno.org/v07p1257.htm
CSE
Mikula H, Stapleton S, Kohler RH, Vinegoni C, Weissleder R. 2017. Design and Development of Fluorescent Vemurafenib Analogs for In Vivo Imaging. Theranostics. 7(5):1257-1265.
This is an open access article distributed under the terms of the Creative Commons Attribution (CC BY-NC) license (https://creativecommons.org/licenses/by-nc/4.0/). See http://ivyspring.com/terms for full terms and conditions.