Impact Factor
- Issue 14; 2026
- Issue 13; 2026
- Issue 12; 2026
- Issue 11; 2026
- Issue 10; 2026
- Volume 16; 2026
- Advance Articles
- Past Issues
- Cover Images
- Cover Suggestion
- Index & Coverage
- Special Issues
Introduction
Materials and Methods
Results
Discussion
Supplementary Material
Acknowledgements
References
International Journal of Biological Sciences
International Journal of Medical Sciences
 Global reach, higher impact

Theranostics 2017; 7(5):1164-1176. doi:10.7150/thno.17711 This issue Cite
Research Paper
Physiological Effects of Ac4ManNAz and Optimization of Metabolic Labeling for Cell Tracking
Sang-Soo Han1*, Dong-Eun Lee2*, Hye-Eun Shim1, Sangmin Lee3, Taekhee Jung4, Jung-Hwa Oh5, Hyang-Ae Lee1, Sung-Hwan Moon4, Jongho Jeon2,6, Seokjoo Yoon5, Kwangmeyung Kim3 ![]() , Sun-Woong Kang1,7
, Sun-Woong Kang1,7 ![]()
1. Predictive Model Research Center, Korea Institute of Toxicology, Daejeon, Korea,
2. Advanced Radiation Technology Institute, Korea Atomic Energy Research Institute, Jeonbuk, Korea,
3. Center for Theragnosis, Biomedical Research Institute, Korea Institute of Science and Technology, Seoul, Republic of Korea,
4. Department of Medicine, School of Medicine, Konkuk University, Seoul, Korea,
5. System Toxicology Research Center, Korea Institute of Toxicology, Daejeon, Korea,
6. Department of Radiation Biotechnology and Applied Radioiostope Science, University of Science and Technology, Daejeon, Korea,
7. Department of Human and Environmental Toxicology, University of Science and Technology, Daejeon, Korea.
* These authors contributed equally to this work.
Received 2016-9-26; Accepted 2016-12-8; Published 2017-3-1
Abstract

Metabolic labeling techniques are powerful tools for cell labeling, tracking and proteomic analysis. However, at present, the effects of the metabolic labeling agents on cell metabolism and physiology are not known. To address this question, in this study, we analyzed the effects of cells treated with Ac4ManNAz through microarray analysis and analyses of membrane channel activity, individual bio-physiological properties, and glycolytic flux. According to the results, treatment with 50 μM Ac4ManNAz led to the reduction of major cellular functions, including energy generation capacity, cellular infiltration ability and channel activity. Interestingly, 10 μM Ac4ManNAz showed the least effect on cellular systems and had a sufficient labeling efficiency for cell labeling, tracking and proteomic analysis. Based on our results, we suggest 10 μM as the optimum concentration of Ac4ManNAz for in vivo cell labeling and tracking. Additionally, we expect that our approach could be used for cell-based therapy for monitoring the efficacy of molecule delivery and the fate of recipient cells.
Keywords: Metabolic labeling, Azido-sugar, Modified glycosylation, Azido group, Physiology
Introduction
Metabolic labeling techniques are powerful tools for visualizing live cells [1-4]. These techniques offer many advantages, such as low background and simple steps for biomolecule labeling, compared with modern direct and indirect methods [4-6]. For these reasons, metabolic labeling techniques are widely used for site-specific modification of antibodies, drug delivery systems, and imaging and tracking of live cells [7-9]. The synthetic azido-sugars, one group of metabolic labeling compounds, are abiotic azide-derivatives of naturally occurring monosaccharides, which require a two-step reaction for labeling of cells [3, 10, 11]. First, the azido-sugars are installed within cellular proteins by post-translational modification pathways, which are mainly displayed on the cell surface. Second, the azido group is covalently linked to fluorescent probes through a click reaction, which allows for imaging and detection of the target cells. The click reaction between the azido group and the fluorescent probe, which has been demonstrated in many studies, has a high reaction specificity and yield in mild conditions at a biocompatible pH and temperature. In addition, the reaction produces very few and non-toxic byproducts [11-13]. Therefore, it has many advantages that apply to in vivo studies. Additionally, to enhance the labeling efficiency and safety, many studies have developed advanced click reactions, such as the 'Diels-Alder' [14, 15] and 'Photo-click' [16, 17] reactions, and bio-orthogonal MRI probes [18]. However, these studies only focused on the labeling step of the process; safety and the bio-physiological effects and biochemical modulation by modified glycosylation in the first step have been overlooked.
Incorporation of an azido group on natural proteins offers many advantages in cell tracking and cell-based therapy. For example, color changes can easily be implemented by using different probes for cell tracking and imaging [15]. In addition, the efficacy of cell-based therapy can be improved by installing specific target molecules, such as antibodies or peptides, on the cell surface, which enhances the targeting moiety [19]. Additionally, a quick quantitative analysis of cell tracking efficiency can be used by azide-tagged total proteins with the click-reaction [20, 21]. However, many hurdles remain to the widespread acceptance of this method of analog tagging of natural proteins for in vivo cell tracking and labeling for cell based-therapy because the functional changes of abiotic azide-containing proteins in cells are not fully understood. Although the azido group has desirable characteristics, such as a small size that causes less interference to glycol-structures and non-reactivity with endogenous molecules in cells [22], many previous studies have shown that the modified glycosylation of natural proteins specifically led to changes in bio-physiological function, cellular signaling pathways and interference with cell-cell communication [23, 24]. Thus, if azido-sugar is to be used for in vivo studies, its effects on physiological properties, biochemical properties of modified cells and cellular function should be clearly defined.
In this study, we analyze the gene expression pattern, membrane channel activity, individual bio-physiological properties, and glycolytic flux of azido-sugar-treated cells. To optimize the concentration of treated azido-sugar to reduce the effects on cell physiology, physiological events were observed. First, we conducted a microarray analysis using total RNA of cells treated with azido-sugars to analyze the cellular signaling pathway. Then, we observed the change of physiological and biochemical events including cell growth, migration, permeability, channel activation and mitochondrial function. In addition, to validate the quantitative analysis of the optimum concentration of azido-sugar to use for cell tracking, comparative analysis was conducted with quantitative PCR and total protein analysis of cells treated with azido-sugar.
Materials and Methods
Cell culture
Human lung adenocarcinoma cells (A549) were purchased from the American Type Culture Collection (ATCC, Manassas, VA, USA) and maintained in RPMI 1640 (Welgene, Daegu, Korea) containing 10% fetal bovine serum (FBS; Welgene, Daegu, Korea) and 100 µg/mL streptomycin and 100 U/mL penicillin (Welgene, Daegu, Korea) in a humidified 5% CO2 atmosphere at 37 °C.
Microarray analysis
The A549 cells were cultured with 0, 10 and 50 μM Ac4ManNAz (Invitrogen, Carlsbad, CA, USA) and harvested. Total RNA was extracted with TRIzol reagent (Invitrogen, Carlsbad, CA, USA), and the quantity and quality of total RNA was evaluated using a NanoDrop spectrophotometer (NanoDrop Technologies, Montchanin, DE, USA) and a 2100 Bioanalyzer (Agilent Technologies, Palo Alto, CA, USA). An Affymetrix GeneChip Human Genome U133 plus 2.0 was used for the microarray experiments according to the manufacturer's instructions (Affymetrix, Santa Clara, CA, USA). For the gene expression array, the data were pre-processed, the cell intensity files (CEL) were generated, and the data were analyzed using GeneSpring GX (v11.0; Agilent Technologies). The data were normalized using a global scale normalization, and differentially expressed genes were selected based on a > 7-fold change. The selected genes were annotated based on NetAffx (http://www.affymetrix.com). Functional enrichment and network analysis was performed using Ingenuity Pathways Analysis software (IPA; Ingenuity Systems, Redwood, CA, USA).
Electrophysiological recording
The currents for TRPM7, VSOR-Cl-, and Kv were measured and analyzed in A549 cells cultured with 0, 10, 20 and 50 μM Ac4ManNAz for 3 days. The cells were placed in a recording chamber on the stage of a Nikon inverted microscope and continuously perfused approximately 5 mL/min with 36 ± 1 °C bath solution. Currents were recorded with an Axopatch 200B amplifier (Molecular Devices, USA) controlled by a Digidata 1440 interface and pCLAMP software (version 9.2, Molecular Devices, USA). The current signals were filtered at a sampling rate of 5 kHz, and they were low-pass filtered at 1 kHz and stored on a computer.
To record the TRPM7 currents, the cells were held at 0 mV and stimulated with voltage ramps from -120 to +120 mV for 250 ms repeatedly at 1 s intervals. The internal pipette solution for TRPM7 current recordings contained 145 mM cesium methanesulfonate, 4.1 or 0 mM CaCl2, 8 mM NaCl, 10 mM ethylene glycol-bis-n,n,n′,N′-tetraacetic acid (EGTA), and 10 mM HEPES with pH adjusted to 7.2 with CsOH. The extracellular solution for the whole cell recordings contained 145 mM NaCl, 5 mM KCl, 1 or 0 mM CaCl2, 10 mM HEPES and 10 mM glucose with pH adjusted to 7.4 with NaOH. For VSOR-Cl- recording, the step pulses were applied to test potentials between -100 mV and +100 mV (500 ms duration) in 20 mV increments. The isotonic bath solution (330 mOsmol/L) consisted of 110 mM CsCl, 10 mM HEPES, 2 mM MgSO4, and 80 mM mannitol (pH 7.4). The hypotonic (250 mOsmol/L) solution was made by omitting mannitol. Osmolality of the solutions was measured using the freezing point depression using Fiske micro-osmometer (FISKE Associate Inc., Norwood, MA, USA). The pipette (intracellular) solution consisted of 110 mM CsCl, 2 mM Na2ATP, 10 mM HEPES, 2 mM MgSO4, 1 mM EGTA and 50 mM mannitol (295 mOsmol/L, pH 7.3). To generate the Kv currents, the cells were held at -70 mV, at which Kv channels are not inactivated, and stimulated with voltage steps that ranged from -30 to +110 mV for 500 ms duration with a 10 mV increment. Current-voltage curves were constructed using the sustained current amplitude at the end of 500 ms test pulses. The pipette solution was composed of 129 mM KCl, 1 mM CaCl2, 2 mM MgCl2, 11 mM EGTA, 10 mM HEPES (pH adjusted to 7.3). The bath solution contained 150 mM NaCl, 2.8 mM KCl, 2 mM MgCl2, 1 mM CaCl2, 10 mM HEPES, and 10 mM glucose (pH adjusted to 7.4).
Ionic current amplitudes normalized to membrane capacitance have been represented as pA/pF to simulate current density values and to compensate for differences in cell size. Origin 8 (OriginLab Corp, Northampton, MA, USA), GraphPad InStat (GraphPad Software Inc., San Diego, CA) and Excel (Microsoft, Redmond, WA, USA) software were used for data analysis. Dunnett's multiple comparison test was performed, and data were considered statistically significant when p < 0.05, or p <0.01 compared to the untreated control group.
Cell viability assay
To measure cell viability, A549 cells were seeded on 96-well plates (5×10³ cells/well) and incubated for 1 day. Cells were incubated with various concentrations of Ac4MAnNAz (0 to 50 µM) for 3 days at 37 °C. Cell Counting Kit-8 solution (10 µL) (Dojindo Molecular Technologies Inc., Kumamoto, Japan) was then added to each well. After further incubation for 2 h at 37 °C, the absorbance of each well was measured at 450 nm using a microplate reader (VERSAmaxTM, Molecular Devices Corp., Sunnyvale, CA, USA).
Invasion and wound healing
Matrigel (100 μL; 7-8 mg/mL) in serum-free medium was added to each well of a Transwell Corning Costar plate (Costar, Acton, MA, USA) and dried overnight in a culture hood. The following day, 2.5 × 10⁴ cells in serum-free medium were pipetted onto the Matrigel, and complete medium was added to the bottom chamber. Following incubation, the transmembrane filter was stained with crystal violet and the number of cells counted. For wound healing, a small area was cleared along the diameter of the 10 cm dishes through confluent monolayers of A549 and Az4MAnNAz-treated A549 cells using a sterile pipette tip. Cell migration was measured and photographed from the wound/scratch edge every 8 h.
Mitochondrial membrane potential
Mitochondrial membrane potential was measured using JC-1 dye (5′,6,6′-tetrachloro-1,1′,3,3′-tetraethylbenzimidazolylcarbocyanine iodide; Life Technologies) according to the manufacturer's instructions. Briefly, Ac4MAnNAz-treated or untreated cells were incubated with 10 µg/mL JC-1 dye for 15 min, and fluorescence images were taken using a 20x objective. The ratio of red fluorescence JC-1 aggregates and green JC-1 monomers was measured using image J following image background correction.
Mitochondrial oxygen consumption and glycolysis-derived lactate flux
Glycolysis and oxidative phosphorylation flux analysis was performed using kits from Seahorse Biosciences, in accordance with the manufacturer's recommendations. For these assays, cells were seeded on XF96 cell culture microplates (Seahorse Biosciences Cat# 101085-004) and grown to 70% confluency prior to analysis. On the day of assay, culture media were changed to XF Assay medium (Seahorse Biosciences Cat# 102365-100), supplemented with 5 g/L glucose, 2 mM glutamine, and 2 mM pyruvate for the oxidative phosphorylation assay and supplemented with only 2 mM pyruvate to assay glycolysis rates. Prior to the assay, plates were transferred into a non-CO2 incubator at 37 °C and maintained for 1 h. To quantify the oxidative phosphorylation rates, we first measured initial (basal) oxygen consumption rates, followed by a series of changes in oxygen consumption when cells were sequentially treated with 1 μM oligomycin, 2 μM FCCP, and finally a combination of 1 μM rotenone and antimycin A. Following each addition, oxygen levels in the culture medium were monitored at 20 s intervals, and the overall oxygen consumption rate (OCR) was calculated. For the glycolysis stress test, after collecting baseline acidification rate (lactate release) data, cells were sequentially treated with 10 mM glucose, 2 μM oligomycin, and 100 mM 2-deoxy-glucose and evoked changes in acidification rate were quantified after each addition. For this purpose, changes in culture medium pH were monitored every 20 s and used to calculate the overall extracellular acidification rate (ECAR).
Western blot analysis
A549 cells were seeded onto 100×20 mm cell culture plates at a density of 2×10⁶ cells per plate in 10 mL of media with no sugar or Ac4ManNAz (10, 20 and 50 μM). After incubation for 3 days, the cells were washed twice with DPBS (pH 7.4) and harvested from the plates with a cell scraper. They were pelleted by centrifugation at 3,000×g for 5 min, and the cell pellets were resuspended in 500 μL of lysis buffer (1% SDS, 100 mM Tris-HCl, pH 7.4) containing protease inhibitor cocktail (Complete, EDTA-free, Roche, NSW, Australia) and lysed with a probe-type sonifier at 4 °C. Sonicated lysates were incubated at 4 °C for 30 min to further solubilize the proteins. The insoluble debris was removed by centrifugation for 10 min at 3,000×g. Final soluble protein concentrations were determined by bicinchoninic acid protein assay (Pierce, Rockford, IL, USA) to be 5 mg/mL. Then, 20 μL of the lysate (5 mg/mL protein) was incubated with phosphine-PEG3-biotin (2 μL, 5 mM in DPBS) (Pierce) for 6 h at 37 °C. Loading buffer was added to each sample, and samples were loaded onto 10% SDS-PAGE gel after heating at 95 °C. Proteins were transferred to a Hybond P membrane (Amersham, St. Albans, UK), and the membrane was blocked with 5% bovine serum albumin in TBST (50 mM Tris-HCl, 150 mM NaCl, 0.1% Tween 20, pH 7.4) for 2 h. The membrane was then incubated with streptavidin-horseradish peroxidase (diluted 1:2,000 in TBST) (Pierce) overnight at 4 °C. The membrane was rinsed three times with TBST and developed using ECL Western Blotting Substrate (Pierce).
Cellular imaging
A549 cells were seeded onto 35-mm glass-bottom dishes at a density of 3×10⁴ cells in 2 mL of growth media with Ac4ManNAz (0, 10, 20 and 50 μM). After incubation for 3 days, the cells were washed twice with DPBS (pH 7.4) and incubated with DBCO-Cy5 (20 μM, final concentration) (Click Chemistry Tools, Scottsdale, AZ, USA) for 1 h at 37 °C. Cells were then rinsed with DPBS (pH 7.4) and fixed with formaldehyde-glutaraldehyde combined fixative for 15 min at room temperature. After fixation, the cells were washed twice with DPBS (pH 7.4) and stained with DAPI (Invitrogen, Carlsbad, CA, USA) to label nuclei. All cell images were obtained using a FluoView FV1000 confocal laser scanning microscope (Olympus, Tokyo, Japan) equipped with a 405 diode (405 nm) and HeNe-Red (633 nm) lasers.
Real-time quantitative PCR
For the RT-qPCR, A549 cells were transfected with 100 ng of pcDNA3-EGFP using Lipofectamine 2000 (Thermo Fisher Scientific, Waltham, MA USA) according to the manufacturer's instructions. After 24 h, transfection medium was replaced with fresh RPMI and incubated at 37 °C for a further 24 h before harvesting cells for mixing into specific ratios of transfected and un-transfected cells and for RNA isolation. Before the RNA isolation, the cells were mixed and the ratio gradually increased to 100% transfected cells. Each sample consisted of a total of 5×10⁵ cells in 1 mL. Total RNA was isolated in a single-step method using TRIZOL reagent. cDNA synthesis was performed with 1 μg of total RNA per sample using random primers and the PrimeScript 1st strand cDNA Synthesis Kit (Takara Biotech, Kusatsu, Shiga, Japan). Real-time PCR was performed on an ABI PRISM 7000 sequence detection system (Applied Biosystems, Foster City, CA). The primer pairs for detecting the expression of EGFP gene were EGFP forward 5'-CTGCTGCCCGACAACCAC-3', and EGFP Reverse 5'-TGTGATCGCGCTTCTCGTT-3', and for GAPDH were forward 5′-TGAAGGTCGGAGTCAACGGATTTGGT-3′ and reverse 5′-CATGTGGGCCATGAGGTCCACCAC-3′. The data shown are the average of three separate experiments, each performed in triplicate.
Measurement of labeled protein using 10 μM Ac4ManNAz
The A549 cells were grown with 0 and 10 μM Ac4ManNAz in a 6-well plate. Before analysis, cells were washed with PBS and harvested. Before the protein isolation, the cells were mixed so that the ratio gradually increased to 100% of 10 μM Ac4ManNAz-treated cells. Samples each had a total of 5×10⁵ cells in 1 mL. Mixed samples were lysed in whole-cell lysis buffer (10% glycerol, 0.5 mM EDTA, 1 mM DTT, 2 mM sodium fluoride, 0.2% Triton X-100 in PBS pH 7.4) supplemented with protease and phosphatase inhibitors (Calbiochem). The total proteins were incubated with DBCO-Cy5 (20 μM, final concentration) for 1 h at 37 °C and precipitated using ethanol. The precipitated proteins were resuspended in PBS and analyzed using a fluorescence microplate reader (Tecan Infinite 200 Pro, Milan, Italy) at 588 nm. The data shown are the average of three separate experiments, each performed in triplicate.
Statistical analysis
Quantitative data were expressed as the means ± standard deviations. Statistical comparisons were carried out using Student's t-test (SAS software, SAS Institute, Inc., Cary, NC). A probability level of less than 0.05 was considered statistically significant.
Results
Regulation of gene expression by treatment of azido-sugars in A549 cells
Protein glycosylation using N- or O-glycans adjusts the biophysical properties and regulates the function of native proteins [24, 25]. Many studies have shown that post-translational modification of proteins was able to change the kinetic and structural features of the proteins [26]. In addition, the large hydrophilic carbohydrates incorporated into proteins have been implicated in myriad biological processes including modification of protein folding, modulation of protein stability, host cell-surface interactions, modulation of signaling, and gene expression [27]. The chemically reactive abiotic azido group from azido-sugar, which is a small chemical group, is known to have a minimal effect on protein structure. However, this group is an anion, used as the conjugate base of hydrazoic acid, and has the potential to modulate biological processes.
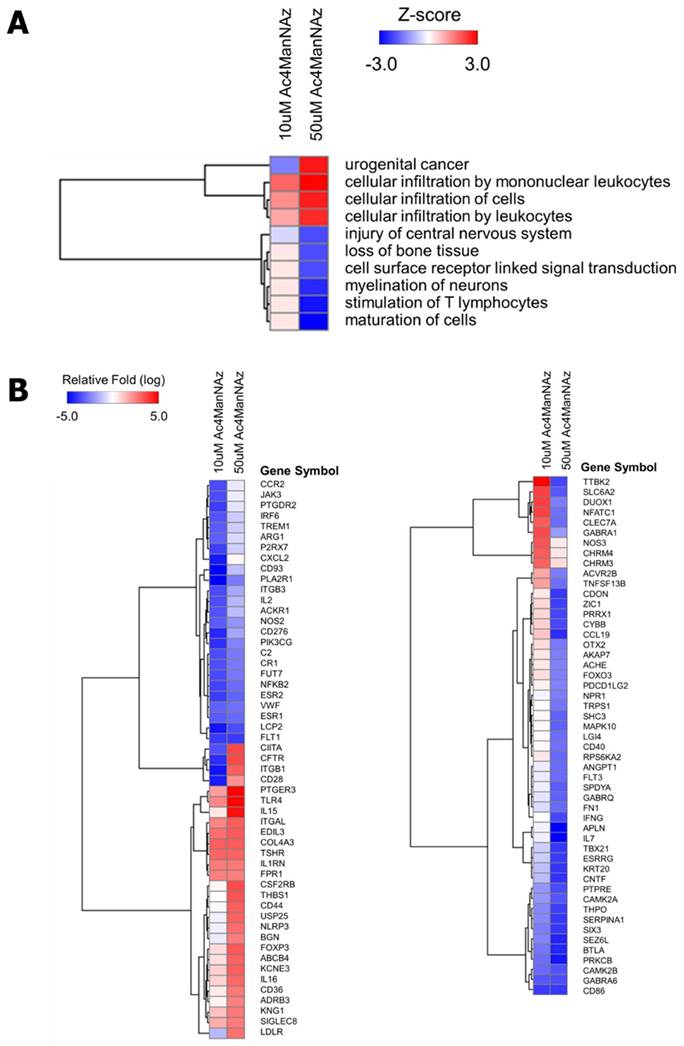
To clearly address these possibilities, we first conducted a microarray analysis. The mRNA from A549 cells treated with 10 μM or 50 μM of N-azidoacetylmannosamine (Ac4ManNAz) was extracted and analyzed using Affymetrix GeneChip Human Genome U133 plus 2.0. We selected 2,014 genes of 10 μM Ac4ManNAz-treated cells and 2,093 genes of 50 μM Ac4ManNAz-treated cells for which the mRNA expression level was changed over 7-fold compared with non-treated A549 cells. Using the selected genes, functional enrichment and network analyses were performed. Ac4ManNAz regulated many mRNA expression levels, and it activated or inhibited various biofunctions in the cells. Interestingly, in the A549 cells treated with 50 μM Ac4ManNAz, the biofunctional pathways related to urogenital cancer and cellular infiltration were significantly activated, while cell maturation and surface receptor-linked signal transduction were inhibited (Fig. 1A). In detail, we analyzed the genes related to activated and inhibited biofunctional pathways in cells treated with 50 μM Ac4ManNAz (Fig. 1B). The genes related to activation of MAPK activity (TLR4, THBS1, FPR1), apoptotic process (NLRP3), fever generation (PTGER3, AFRB3), induction of apoptosis (COL4A3), and immune and inflammatory responses (IL15, KNG1, CD28, ITGAL) were upregulated. Genes related to energy generation (CYBB), transport (GABRA1, GABRQ, SLC6A2, AKAP7), neuroactive signaling (CHRM4, PTGDR2, P2RX7), the JAK-STAT signaling pathway (CNTF), the PI3K-Akt signaling pathway (PIK3CG, ESR2, CCR2), phosphorylation (PTPRE, TTBK2), the cell cycle (NFATC1, SPDYA, CAMK2A, CAMK2B, OTX2, CDON), cell proliferation and growth (ESR1), and cell migration and angiogenesis (FLT1, ANGPT1, FN1, LGI4) were down-regulated. These results showed that Ac4ManNAz regulated a wide range of cellular functions and signaling pathways. The results also suggest that higher concentration of Ac4ManNAz induced the apoptotic process and immune response and inhibited the cell cycle, proliferation and cellular adhesion. Interestingly, contrary to previous reports, Ac4ManNAz led to the modulation of biological functions in cells.
Functional enrichment analysis of differentially expressed genes in Ac4ManNAz treated A549 cells. (A) Disease and biofunction analysis of 10 μM- and 50 μM Ac4ManNAz treated group were performed based on Ingenuity Systems Knowledge Base. The Z-score predicts the direction of change for the function and an absolute z-score of ≥ 3 or ≤ -3 is considered significant. (B) Heatmap of microarray data illustrating differentially expressed genes of 10 μM- and 50 μM Ac4ManNAz treated group. Expression levels are shown as mean-centered log2 values. Red, upregulated genes; blue, downregulated genes. The scale extends from -5 to +5 in log2 space as indicated at the upper left.
Down-regulation of physiological properties by azide labeling in A549 cells
Based on the microarray results, Ac4ManNAz modulated various bio-physiological properties including apoptosis, cellular adhesion, proliferation and the cell cycle. In general, these modulations were induced by numerous factors, such as secretory cytokines, membrane channel activity, gene expression and signaling pathways [28, 29]. Choosing among them, we decided to focus on membrane channel activity because metabolic labeling using azido-sugars primarily occurred on membrane proteins. Thus, we selected three channels of transient receptor potential (TRP): the M7 channel, the volume-sensitive outward rectifying (VSOR) Cl- channel and the voltage-gated potassium (Kv) channel. These channels are already known to play a critical role in cell permeability, apoptosis and proliferation [30-32].
According to our results, TRP M7 and VSOR Cl- channel activity showed no significant changes (Fig. 2A, B). However, Kv activation was gradually decreased by increased concentrations of azido-sugar, which suggests that glycosylation of the Kv channel with azido groups affected their function (Fig. 2C). The reduction of Kv channel activity directly affected the membrane potential, which contributes to cell mitotic biochemical signaling, cell cycle progression, proliferation, and cell volume regulation [33].
Analysis of channel activation, proliferation ability, and viability on Ac4ManNAz treated A549 cells. All A549 cells were incubated with various concentrations of Ac4MAnNAz (0 to 50 µM) for 3 days at 37 °C. Using the theses cells, TRPM7 (A), VSOR-Cl- (B), Kv (C) currents were measured and analyzed. The currents signals were recorded using Axopatch 200B amplifier and filtered from 1 kHz to 5 kHz. In addition, the morphological property was analyzed using microscopic observation (D). The specific growth rate (E) and viability (F) were analyzed by CCK-8 and manual microscopic counting.
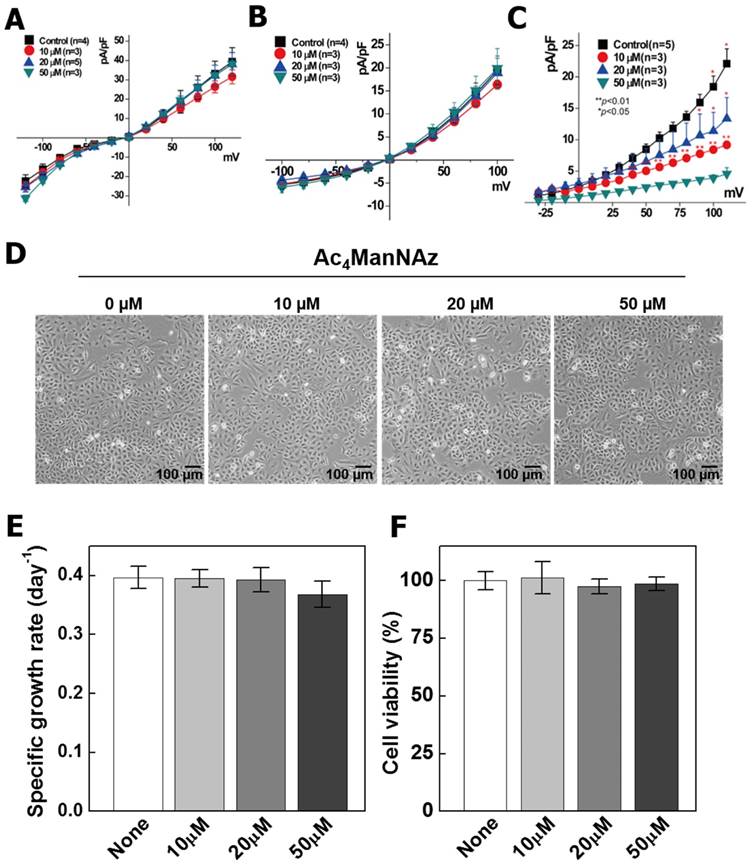
To validate the influence of the changed channel activity on cells, we measured the cell growth rate and viability with an MTT assay and manual microscopic counting, permeability, migration and invasion assays. As shown in Figure 2 D, E, Ac4ManNAz does not affect the cell viability. However, the growth rate was decreased by 10% in cells treated with 50 µM Ac4ManNAz compared to the non-treated cells (Fig. 2F). As known, the level of carbon source such as glucose and other sugars affects many cellular physiologies in the cells, such as proliferation, viability and morphological changes [34]. Ac4ManNAz is the analog of ManNAc, which was used by carbon source in the cells. Therefore, the addition of Ac4ManNAz have possibility of changes of cellular physiology.
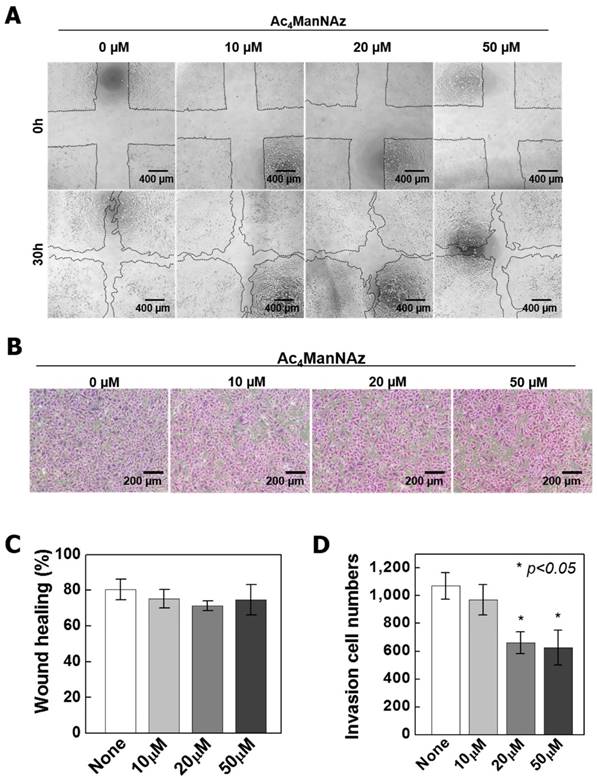
So, we confirmed the modification of cellular physiology depend on sugar level using ManNAc and Ac4ManNAc, that is another analog of ManNAc (Fig S1 and S2). The ManNAc have not shown the physiological cellular changes. These results were demonstrated that the cellular effects depend on sugar levels is negligible, and the decrease of growth rate in the high concentration of Ac4ManNAz (>50 μM) was caused by azido groups. Meanwhile, Ac4ManNAc dramatically increased cytotoxicity depend on the increase of concentration. These results were caused by accumulation acetic acids in cell, which result in intracellular pH decrease and thus induce cytotoxicity [35]. In general, the chemical properties of DMSO are an osmolyte, which affected the cell swelling, cell volume changes and cellular mechanisms [36]. We used DMSO for dissolving Ac4ManNAz and added the 0.1% (v/v) of DMSO with 10 ~ 50 µM of Az4ManNAz. The addition of 0.1% DMSO (v/v) to the growth medium has shown the negligible effects on cells (Fig. S3). Additionally, we analyzed the permeability of A549 cells treated with Ac4ManNAz using Cy5.5-labeled empty liposomes and liposome-mediated transfection with pcDNA3-eGFP plasmid. The results of the permeability test showed no significant differences between the treated and non-treated condition (Fig. S4). Additionally, the migration and invasion were determined by a wound healing and Transwell invasion experiment (Fig. 3). The migration and invasion ability were gradually decreased by increased concentrations of Ac4ManNAz. Specifically, rapid reductions in invasion ability were observed with 20 μM and 50 μM Ac4ManNAz compared with the untreated group (P < 0.05) (Fig. 3D). These results suggested that labeling native proteins with an azido group affected the proliferation, migration, invasion and channel activity of cells. Furthermore, treatment with higher concentrations of azido-sugar was negatively regulated and these changes in cellular properties were consistent with our microarray results.
Wound healing and invasion assay on Ac4ManNAz treated A549 cells. (A) Wound healing assay was performed to assess the effect of Ac4ManNAz on the migration of A549 cells. The assay was repeated three times and representative images are shown. (B) Representative images of the invasiveness of A549 cells that migrated through transwell membranes. Cells were treated with 0, 10, 20 and 50 μM Ac4ManNAz for 30 hr. (C), (D) Quantification of the wound healing and transwell assay by counting the number of invasive cells through the transwell membranes and migration area. Data are mean ± SD; n=3. *P<0.05 vs. control.
Effects of azido-sugar on mitochondrial function and characterization
The glycosylation of proteins in cell membranes has been extensively studied and is also reported in mitochondria [37]. The modified glycosylation of mitochondrial proteins has been linked to diabetes-related complications, cancer progression, neurodegeneration and mitochondrial dysfunction [24, 38]. Recently, many studies have reported that glycosylated mitochondrial proteins localized to the inner mitochondrial membrane, which suggests that glycosylation in the mitochondria plays important roles in oxidative phosphorylation, mitochondrial integrity, redox signaling, and cell survival pathways [37]. In this regard, modified glycosylation by azide labeling may affect mitochondrial function and energy generation. Thus, we conducted a JC-1 dye assay for analyzing the change of the mitochondrial membrane potential (ΔΨm) and extracellular acidification rate (ECAR) and oxygen consumption rate (OCR) assays.
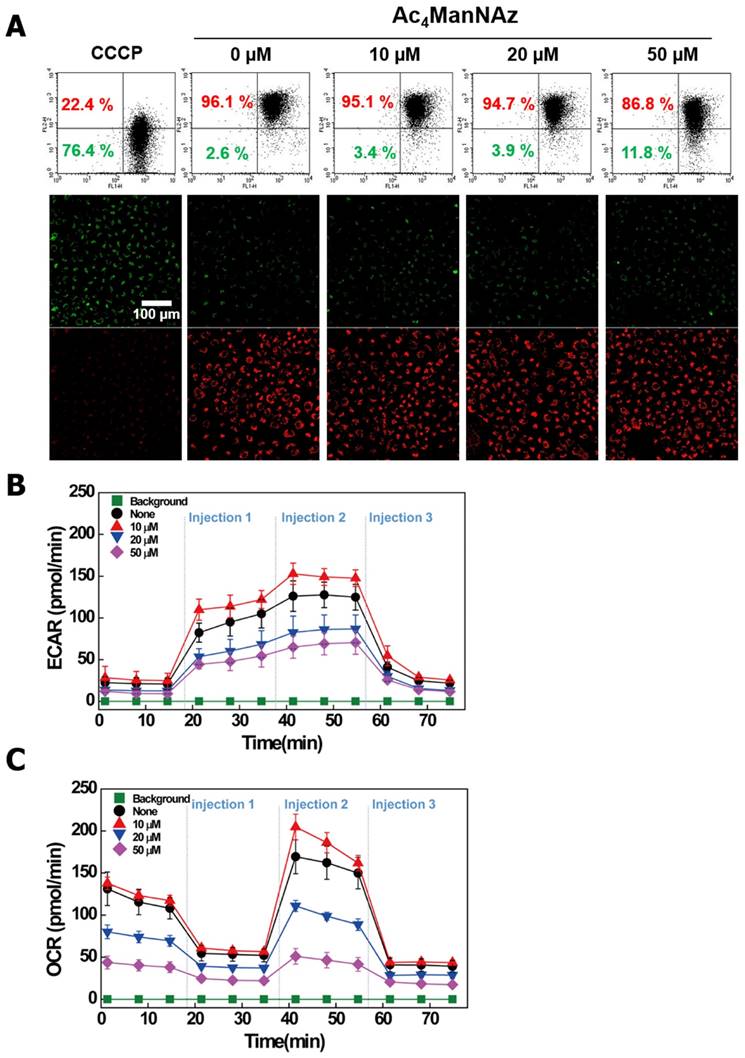
As shown in Figure 4A, the healthy cells were detected as a red JC-1 aggregate, the loss of ΔΨm was detected as a green JC-1 monomer. Compared to the control cells (0 μM of Ac4ManNAz), the cells treated with the azido-sugar were depolarized, and the treatment of 50 μM Ac4ManNAz have increased the levels of JC-1 detected 5-fold. In general, ΔΨm is critical for maintaining the physiological function of the respiratory chain to generate ATP. Additionally, lower ΔΨm renders cells depleted of energy, leading to subsequent death. In this regard, the cells treated with 50 μM Ac4ManNAz displayed decreased gene expression of cytochrome b (CYBB) in the microarray results, which is a component of respiratory chain complex III [39]. These data indicate that azido-sugars may preferentially engage in metabolic processes and interfere in ATP generation. To determine whether gene expression and metabolic measurements were associated with functional changes, we evaluated the ECAR, which quantified proton production as a surrogate for lactate production and thus reflects glycolytic flux and the OCR. According to the results, ECAR and OCR were gradually decreased in all treatments except the 10 μM Ac4ManNAz treatment. This result is consistent with the gene expression and ΔΨm analyses. The cells treated with over 20 μM Ac4ManNAz demonstrated evidence of interference with the metabolic process and ATP generation (Fig. 4 B, C).
Change of Mitochondria function in A549 cells treated with Ac4ManNAz. (A) Mitochondrial membrane potential (ΔΨm) was measured in A549 cells by JC-1 staining as described in materials and methods. (B) A representative graph of ECAR outputs from the XF96 analyzer of the control, and Ac4ManNAz treated A549 cells and the response to glucose, oligomycin and 2-deoxy-glucose. (C) A representative graph of OCR outputs from the XF96 analyzer of the control, and Ac4ManNAz treated A549 cells and the response to oligomycin, FCCP, and antimycin A/rotenone.
Optimum concentration of azido-sugar for cell labeling and proteomic analysis
In the manufacturer's protocol and labeling kit, the use of 40 or 50 μM of Ac4ManNAz was recommended for the highest labeling efficiency. Additionally, many studies of cell or virus labeling and tracking used over 50 μM Ac4ManNAz [3, 6, 40]. In our study, however, cells treated with 50 μM Ac4ManNAz showed a decrease of proliferation, migration and invasion ability. They also exhibited a reduction of glycolytic flux and OCR by a lower ΔΨm and many biofunctional changes in the microarray analysis. However, with 10 μM Ac4ManNAz treatment, there were no changes in the physiological and biochemical properties compared with control groups. Although 10 μM Ac4ManNAz provided the smallest effects on the bio-physiological and biochemical properties of cells, the labeling efficiency and sensitivity would be decreased if this concentration were used. Thus, the optimum concentration of azido-sugars was determined for cell labeling and tracking.
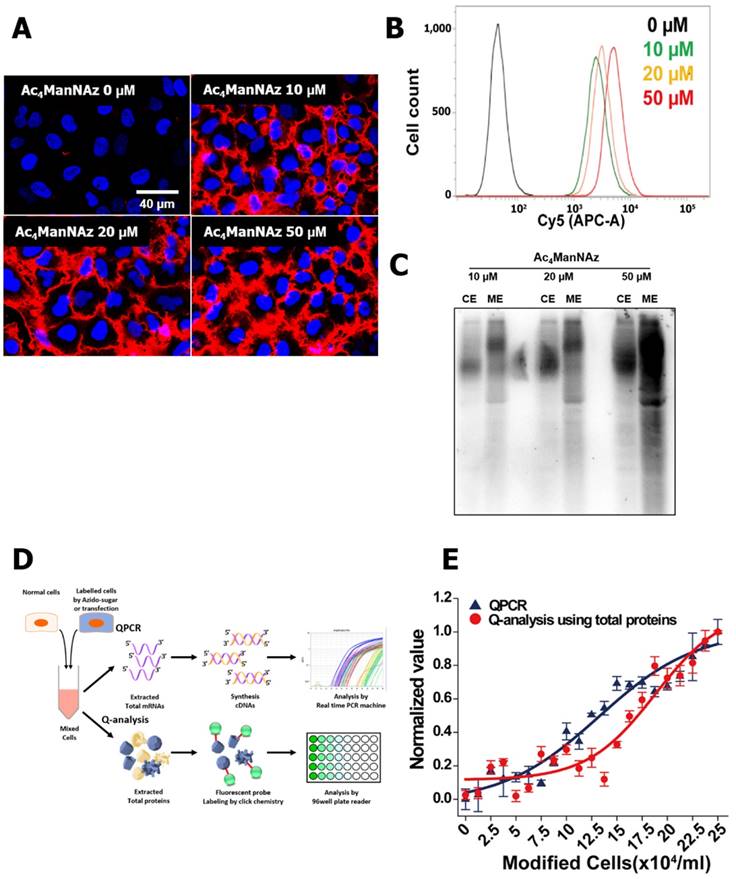
As shown in Figure 5 A, B and C, we conducted the western blot, cell imaging and FACS analyses for analyzing labeling efficiency and sensitivity. The labeled proteins and cell imaging of cells treated with 10 μM Ac4ManNAz were distinguished from higher concentrations of azido-sugar treated cells. However, in the FACS analysis, all labeled cells showed similar intensity. In addition, for the quantitative analysis of cell tracking using 10 μM Ac4ManNAz, we compared qPCR and labeled proteins derived from 10 μM Ac4ManNAz-treated cells. Using the labeled proteins, the sensitivity for quantitative analysis was lower than qPCR. Meanwhile, the proteins from mixed over 2.5 x 10⁵ labeled cells had a higher accuracy than qPCR. These results showed that 10 μM Ac4ManNAz is a sufficient concentration for cell labeling and tracking. Additionally, for proteomic and quantitative analysis, using 10 μM Ac4ManNAz is sufficient.
Optimization of metabolic labeling for cell tracking. To address the optimum concentration of Ac4ManNAz, (A) visualization of Ac4ManNAz treated cells using DBCO-cy5 (n = 3) and (B) flow cytometry analysis of (A) (n = 3) were conducted. Also, (C) western blot analysis of Ac4ManNAz-treated cells showing the amount of total proteins and generated azide groups (n = 5). For the quantitative analysis of cell tracking using azide labeled total proteins derived from 10 μM Ac4ManNAz-treated cells, (D) schematic representation was shown as comparative analysis of QPCR and labeled total proteins. (E) In representative graph of comparative analysis of QPCR and labeled total proteins, the cells were mixed so that the ratio gradually increased to 100% of modified cells, samples each had a total of 2.5×10⁵ cells in 1 mL.
Discussion
Cell-based therapy, such as stem cell transplantation and adoptive immunotherapy, have great potential for the next phase of biotherapeutics in oncological research and medical practice, but many questions remain about the efficacy of cell delivery and the fate of delivered cells [41]. For effective cell-based therapy, the ability of therapeutic cells has to be guaranteed by determination of the in vivo targeting efficiency, distribution, viability, biological fate and toxicity of therapeutic cell populations. To monitor the therapeutic cells in vivo, direct or indirect cell labeling and tracking methods utilizing fluorescent nanoparticles, and genetic modification by non-viral and viral systems have been developed [42, 43]. Recently, many reports have described advanced cell labeling methods by the development of novel fluorescent probes and simple cell labeling processes [44]. Metabolic labeling techniques are one of the advanced cell labeling techniques, which provide low background signals, a simple process, and commercial availability. However, the effects of the metabolic labeling agents on cell metabolism and physiology are not known, which puts into question the biological relevance of this strategy.
To address these questions, we performed the various analytical procedures involved in a microarray, physiological cell analysis, channel assay, and mitochondrial function assay on azido-sugar treated cells. According to the results, treatment of 50 μM Ac4ManNAz, the concentration of azido-sugar recommended for cell labeling in the manufacturer's procedure, resulted in the reduction of major cellular functions, including energy generation capacity, cellular infiltration ability and channel activity. In our previous study, we demonstrated that azido-sugar had low cytotoxicity and no inflammatory effects, as judged by hematoxylin and eosin (H&E) staining of liver, lung, spleen and kidney in vivo [6]. Contrary to previous results, the microarray results showed that the treatment of 50 μM Ac4ManNAz induced gene expression involving inflammation and the immune response. Although we focused on the effects of modified glycosylation with the azido group in this study, the cause of upregulated gene expression related immune response changes have to be investigated in an in vivo study. Treatment with 10 μM Ac4ManNAz had lesser effects on the physiological and biochemical properties of cells. Thus, we suggest that metabolic cell labeling for therapeutic purposes should use 10 μM Ac4ManNAz.
When cells are treated with azido-sugar, this addition of abiotic nutrient sources could affect the nutrient-sensing signaling pathway, which regulates cell metabolism and growth in response to altered nutrient levels, and growth factor signaling. As is known, carbon sources can regulate the transcription and expression of genes encoding enzymes related to glycolysis, and signaling pathways including MAPK, WNT and PI3K-Akt, which modulate cell growth, the cell cycle, and metabolism [45, 46]. Our microarray analysis results showed the up- and down-regulation of the expression of various genes involved in the MAPK and PI3K-Akt signaling pathways. Although the effects of regulated gene expression were not determined in our study, the microarray results are very similar to those from previous studies about nutrient sensing and signaling.
Stem cells, which are unspecialized cells with the ability to renew themselves, are expected by the next generation of cell therapy to bring substantial benefit to patients suffering from a wide range of diseases and injuries. As currently understood, the behavior and differentiation of stem cells is regulated and determined by MAPK, PI3K-Akt, WNT, FGF, Notch, SMAD, and Hedgehog signaling pathways by supplying outside signal and extracellular factors, rather than genetic manipulation [47, 48]. Additionally, in the regulation of cellular pluripotency and differentiation of stem cells, the significance of protein glycosylation and its potential roles are supported by multiple lines of evidence [49, 50]. Therefore, the activation or inactivation of these pathways and protein glycosylation are important to the success of stem cell therapy. In our results, gene expression related to the PI3K-Akt pathway and MAPK pathway and physiological and biochemical properties through the modified glycosylation were changed by treatment with 50 μM Ac4ManNAz on cells. Although we selected A549 cells as the model cell line in our study, our results suggest that metabolic labeling of stem cells using azido-sugars for monitoring may have an effect on the spreading and fate of injected stem cells.
In conclusion, this study demonstrates that high concentrations of Ac4ManNAz affected the expression of various genes related to important bio-functional pathways, bio-physiological and biochemical properties and cellular energy generation. However, 10 μM Ac4ManNAz showed the least effect on cellular systems, and it provided a sufficient labeling efficiency for cell labeling, tracking and proteomic analysis. Based on our results, we suggest 10 μM as the optimum concentration of Ac4ManNAz for in vivo cell labeling and tracking. Additionally, we expect that our approach could be used for cell-based therapy for monitoring the efficacy of molecule delivery and the fate of recipient cells.
Supplementary Material
Supplementary figures.
Acknowledgements
This work supported by grants (NRF-2016M3A9B4919616) from National Research Foundation of korea funded by the Ministry of Science, ICT, and Future Planning, Korea. We thank Eun Hee Han of the Korea Basic Science Institute (Daejeon, Republic of Korea) for her technical support in the confocal microscopy analysis.
Competing Interests
The authors have declared that no competing interest exists.
References
1. Saxon E, Bertozzi CR. Cell surface engineering by a modified Staudinger reaction. Science. 2000;287:2007-10
2. Prescher JA, Bertozzi CR. Chemical technologies for probing glycans. Cell. 2006;126:851-4
3. Chang PV, Chen X, Smyrniotis C, Xenakis A, Hu T, Bertozzi CR. et al. Metabolic Labeling of Sialic Acids in Living Animals with Alkynyl Sugars. Angew. Chem. Int. Ed. 2009;48:4030-3
4. Prescher JA, Dube DH, Bertozzi CR. Chemical remodelling of cell surfaces in living animals. Nature. 2004;430:873-7
5. Prescher JA, Bertozzi CR. Chemistry in living systems. Nat Chem Biol. 2005;1:13-21
6. Kang SW, Lee S, Na JH, Yoon HI, Lee DE, Koo H. et al. Cell labeling and tracking method without distorted signals by phagocytosis of macrophages. Theranostics. 2014;4:420-31
7. Kircher MF, Gambhir SS, Grimm J. Noninvasive cell-tracking methods. Nat. Rev. Clin. Oncol. 2011;8:677-88
8. Hang HC, Yu C, Kato DL, Bertozzi CR. A metabolic labeling approach toward proteomic analysis of mucin-type O-linked glycosylation. Proc. Natl. Acad. Sci. USA. 2003;100:14846-51
9. Hong H, Yang Y, Zhang Y, Cai W. Non-Invasive Cell Tracking in Cancer and Cancer Therapy. Curr. Top. Med. Chem. 2010;10:1237-48
10. Laughlin ST. Metabolic labeling of glycans with azido sugars for visualization and glycoproteomics. Methods Enzymol. 2006;415:230-50
11. Laughlin ST, Bertozzi CR. Metabolic labeling of glycans with azido sugars and subsequent glycan-profiling and visualization via Staudinger ligation. Nat. Protoc. 2007;2:2930-44
12. Nwe K, Brechbiel MW. Growing Applications of “Click Chemistry” for Bioconjugation in Contemporary Biomedical Research. Cancer. Biother. Radiopharm. 2009;24:289-302
13. McKay Craig S, Finn MG. Click Chemistry in Complex Mixtures: Bioorthogonal Bioconjugation. Chem. Biol. 2014;21:1075-101
14. Späte A-K, Bußkamp H, Niederwieser A, Schart VF, Marx A, Wittmann V. Rapid Labeling of Metabolically Engineered Cell-Surface Glycoconjugates with a Carbamate-Linked Cyclopropene Reporter. Bioconjug. Chem. 2014;25:147-54
15. Niederwieser A, Späte A-K, Nguyen LD, Jüngst C, Reutter W, Wittmann V. Two-Color Glycan Labeling of Live Cells by a Combination of Diels-Alder and Click Chemistry. Angew. Chem. Int. Ed. 2013;52:4265-8
16. Poloukhtine AA, Mbua NE, Wolfert MA, Boons G-J, Popik VV. Selective Labeling of Living Cells by a Photo-Triggered Click Reaction. J. Am. Chem. Soc. 2009;131:15769-76
17. Hayes TR, Lyon PA, Silva-Lopez E, Twamley B, Benny PD. Photo-initiated Thiol-ene Click Reactions as a Potential Strategy for Incorporation of [MI(CO)3]+ (M = Re, 99mTc) Complexes. Inorg. Chem. 2013;52:3259-67
18. Neves AA, Wainman YA, Wright A, Kettunen MI, Rodrigues TB, McGuire S. et al. Imaging Glycosylation In Vivo by Metabolic Labeling and Magnetic Resonance Imaging. Angew. Chem. Int. Ed. 2016;55:1286-90
19. Jamous M, Haberkorn U, Mier W. Synthesis of Peptide Radiopharmaceuticals for the Therapy and Diagnosis of Tumor Diseases. Molecules. 2013;18:3379
20. Gouw JW, Krijgsveld J, Heck AJR. Quantitative Proteomics by Metabolic Labeling of Model Organisms. Mol. Cell Proteomics. 2010;9:11-24
21. Li Z, Adams RM, Chourey K, Hurst GB, Hettich RL, Pan C. Systematic Comparison of Label-Free, Metabolic Labeling, and Isobaric Chemical Labeling for Quantitative Proteomics on LTQ Orbitrap Velos. J. Proteome Res. 2012;11:1582-90
22. Zhang X, Zhang Y. Applications of Azide-Based Bioorthogonal Click Chemistry in Glycobiology. Molecules. 2013;18:7145
23. Spiro RG. Protein glycosylation: nature, distribution, enzymatic formation, and disease implications of glycopeptide bonds. Glycobiology. 2002;12:43R-56R
24. Lee HS, Qi Y, Im W. Effects of N-glycosylation on protein conformation and dynamics: Protein Data Bank analysis and molecular dynamics simulation study. Sci. Rep. 2015;5:8926
25. Walsh CT, Garneau-Tsodikova S, Gatto GJ Jr. Protein posttranslational modifications: the chemistry of proteome diversifications. Angew. Chem. Int. Ed. 2005;44:7342-72
26. Mitra N, Sinha S, Ramya TN, Surolia A. N-linked oligosaccharides as outfitters for glycoprotein folding, form and function. Trends Biochem. Sci. 2006;31:156-63
27. Hanson SR, Culyba EK, Hsu TL, Wong CH, Kelly JW, Powers ET. The core trisaccharide of an N-linked glycoprotein intrinsically accelerates folding and enhances stability. Proc. Natl. Acad. Sci. USA. 2009;106:3131-6
28. Gupta SC, Kim JH, Prasad S, Aggarwal BB. Regulation of survival, proliferation, invasion, angiogenesis, and metastasis of tumor cells through modulation of inflammatory pathways by nutraceuticals. Cancer Metastasis Rev. 2010;29:405-34
29. Lang F, Foller M, Lang KS, Lang PA, Ritter M, Gulbins E. et al. Ion channels in cell proliferation and apoptotic cell death. J. Membr. Biol. 2005;205:147-57
30. Dadon D, Minke B. Cellular Functions of Transient Receptor Potential channels. Int. J. Biochem. Cell Biol. 2010;42:1430-45
31. Elmore S. Apoptosis: A Review of Programmed Cell Death. Toxicol. Pathol. 2007;35:495-516
32. Pardo LA, Stuhmer W. The roles of K+ channels in cancer. Nat. Rev. Cancer. 2014;14:39-48
33. Urrego D, Tomczak AP, Zahed F, Stühmer W, Pardo LA. Potassium channels in cell cycle and cell proliferation. Philos. Trans. R. Soc. Lond, B, Biol. Sci. 2014;369:20130094
34. Wilcox G. Insulin and Insulin Resistance. Clinical Biochemist Reviews. 2005;26:19-39
35. Chen L, Liang JF. Metabolic monosaccharides altered cell responses to anticancer drugs. European journal of pharmaceutics and biopharmaceutics: official journal of Arbeitsgemeinschaft fur Pharmazeutische Verfahrenstechnik eV. 2012;81:339-45
36. Lang F, Uhlemann AC, Lepple-Wienhues A, Szabo I, Siemen D, Nilius B. et al. Cell volume regulatory mechanisms in apoptotic cell death. Herz. 1999;24:232-5
37. Burnham-Marusich AR, Berninsone PM. Multiple proteins with essential mitochondrial functions have glycosylated isoforms. Mitochondrion. 2012;12:423-7
38. Stowell SR, Ju T, Cummings RD. Protein Glycosylation in Cancer. Annu. Rev. Pathol. 2015;10:473-510
39. Wen J-J, Garg NJ. Mitochondrial Complex III Defects Contribute to Inefficient Respiration and ATP Synthesis in the Myocardium of Trypanosoma cruzi-Infected Mice. Antioxid. Redox Signal. 2010;12:27-37
40. Zhao X, Cai L, Adogla EA, Guan H, Lin Y, Wang Q. Labeling of Enveloped Virus via Metabolic Incorporation of Azido Sugars. Bioconjug. Chem. 2015;26:1868-72
41. Trounson A, McDonald C. Stem Cell Therapies in Clinical Trials: Progress and Challenges. Cell stem cell. 2015;17:11-22
42. Xu C, Zhao W. Nanoparticle-based Monitoring of Stem Cell Therapy. Theranostics. 2013;3:616-7
43. Fu Y, Kraitchman DL. Stem cell labeling for noninvasive delivery and tracking in cardiovascular regenerative therapy. Expert. Rev. Cardiovasc. Ther. 2010;8:1149-60
44. Wang Y, Xu C, Ow H. Commercial Nanoparticles for Stem Cell Labeling and Tracking. Theranostics. 2013;3:544-60
45. Hotamisligil GS, Erbay E. Nutrient sensing and inflammation in metabolic diseases. Nat. Rev. Immunol. 2008;8:923
46. Jewell JL, Guan K-L. Nutrient Signaling to mTOR and Cell Growth. Trends Biochem. Sci. 2013;38:233-42
47. Blank U, Karlsson G, Karlsson S. Signaling pathways governing stem-cell fate. Blood. 2008;111:492-503
48. Bhaskar B, Mekala NK, Baadhe RR, Rao PS. Role of signaling pathways in mesenchymal stem cell differentiation. Curr. Stem. Cell. Res. Ther. 2014;9:508-12
49. Satomaa T, Heiskanen A, Mikkola M, Olsson C, Blomqvist M, Tiittanen M. et al. The N-glycome of human embryonic stem cells. BMC Cell Biol. 2009;10:1-18
50. Hamouda H, Ullah M, Berger M, Sittinger M, Tauber R, Ringe J. et al. N-Glycosylation Profile of Undifferentiated and Adipogenically Differentiated Human Bone Marrow Mesenchymal Stem Cells: Towards a Next Generation of Stem Cell Markers. Stem Cells Dev. 2013;22:3100-13
Author contact
![]() Corresponding authors: S.W. Kang, E-mail: swkangre.kr; Tel: +82-042-610-8209; Fax: +82-042-610-8157. K.M. Kim, E-mail: kimre.kr; Tel: +82-2-958-5909; Fax: +82-2-958-5909.
Corresponding authors: S.W. Kang, E-mail: swkangre.kr; Tel: +82-042-610-8209; Fax: +82-042-610-8157. K.M. Kim, E-mail: kimre.kr; Tel: +82-2-958-5909; Fax: +82-2-958-5909.