Impact Factor
- Issue 14; 2026
- Issue 13; 2026
- Issue 12; 2026
- Issue 11; 2026
- Issue 10; 2026
- Volume 16; 2026
- Advance Articles
- Past Issues
- Cover Images
- Cover Suggestion
- Index & Coverage
- Special Issues
Introduction
Materials and Methods
Results
Discussion
Supplementary Material
Abbreviations
Acknowledgements
References
International Journal of Biological Sciences
International Journal of Medical Sciences
 Global reach, higher impact

Theranostics 2017; 7(5):1100-1113. doi:10.7150/thno.18198 This issue Cite
Research Paper
AHNAK2 is a Novel Prognostic Marker and Oncogenic Protein for Clear Cell Renal Cell Carcinoma
Minglei Wang1,2*, Xuefeng Li1,3*, Jin Zhang4, Qiong Yang1, Wenqi Chen1, Weilin Jin5, Yi-Ran Huang4 ![]() , Ru Yang1
, Ru Yang1 ![]() , Wei-Qiang Gao1,2,6
, Wei-Qiang Gao1,2,6 ![]()
1. State Key Laboratory of Oncogenes and Related Genes, Renji-MedX Stem Cell Research Center, Ren Ji Hospital, School of Medicine, Shanghai Jiao Tong University, Shanghai 200127, China
2. School of Biomedical Engineering & Med-X Research Institute, Shanghai Jiao Tong University, Shanghai 200030, China;
3. Department of Medical Oncology, The First Affiliated Hospital, University of South China, Hengyang 421001, China;
4. Department of Urology, Ren Ji Hospital, School of Medicine, Shanghai Jiao Tong University, Shanghai 200127, China;
5. Institute of Nano Biomedicine and Engineering, Shanghai Engineering Center for Intelligent Diagnosis and Treatment Instrument, Department of Instrument Science and Engineering, Key Lab. for Thin Film and Microfabrication Technology of Ministry of Education, School of Electronic Information and Electronic Engineering, Shanghai Jiao Tong University, Shanghai 200240, China;
6. Collaborative Innovation Center of Systems Biomedicine, Shanghai 200240, China.
* These authors contributed equally to this work.
Received 2016-11-3; Accepted 2016-12-17; Published 2017-2-27
Abstract

Integrative database analysis was performed to identify novel candidate oncogene AHNAK2 overexpressed in clear cell renal cell carcinoma (ccRCC). However, the function of AHNAK2 in cancer cells is currently unknown. In this study, we first confirmed the upregulation of AHNAK2 in ccRCC tissues compared with adjacent normal tissues in 15 pairs of samples. Then we analyzed AHNAK2 expression in a large cohort of ccRCC patient samples (n = 355), and found that up-regulation of AHNAK2 was positively correlated with tumor progression and poor survival (p = 0.032). Knockdown of AHNAK2 inhibited cancer cell proliferation, colony formation and migration in vitro and tumorigenic ability in vivo. Meanwhile, knockdown of AHNAK2 impaired the cell oncologic-metabolism by inhibiting lipid synthesis. Moreover, we observed that expression of AHNAK2 was greatly upregulated, at least in part, by hypoxia in cancer cells. By using chromatin immune-precipitation (CHIP) and promoter-luciferase reporter assays, we identified that upregulation of AHNAK2 induced by hypoxia was hypoxia-inducible factor-1α (HIF1α)-dependent. Knockdown of AHNAK2 impaired hypoxia-induced epithelial-mesenchymal transition (EMT) and stem cell-like properties. Considered together, we reveal that AHNAK2 is upregulated in cancer cells and hypoxic upregulation of AHNAK2 can drive tumorigenesis and progression by supporting EMT and cancer cell stemness. Thus, AHNAK2 is a novel prognostic marker and an oncogenic protein for ccRCC.
Keywords: AHNAK2, hypoxia-inducible factor-1α, clear cell Renal Cell Carcinoma, hypoxia pathway, epithelial-mesenchymal transition.
Introduction
Clear cell renal cell carcinoma (ccRCC) is the most common renal carcinoma and a devastating type of cancer, responsible for approximately 75% of cases of kidney cancer [1]. Clear cell RCC, characterized by malignant epithelial cells with a clear cytoplasm, originates from the epithelial cells of renal proximal tubules [2, 3]. In most ccRCCs, loss of von Hippel-Lindau and dysregulated hypoxia signaling leads to the activation of a wide variety of genes [4]. The vascular endothelial growth factor (VEGF) and its receptor, and the mammalian target of rapamycin (mTOR) remain as the main targets of systemic therapies [5, 6]. Therapeutic agents targeting VEGF or mTOR signaling, such as Sorafenib [7], Pazopanib [8], Sunitinib [9], Bevacizumab [10], and Everolimus [11], have been successfully developed and clinically useful [12]. However, these drugs only produce a partial improvement for the outlook of ccRCC and their efficacy for advanced RCC are still limited [13]. In addition, few prognostic markers for ccRCC are available in clinical practice [14]. Therefore, identification of novel prognostic markers and additional new targets are desired for better treatment of this disease.
To identify novel oncogenes overexpressed in ccRCCs, we performed integrative data-mining analysis across multiple datasets from the Oncomine database. Among 4 independent datasets, AHNAK2 was identified as one of the top co-upregulated genes. The AHNAK family has two members: AHNAK and AHNAK2 [15, 16]. While AHNAK is implicated to be involved in cell repair, migration and so on [17-20], AHNAK2 is recently reported to be involved in the stress-induced non-classical FGF1 secretion pathway [21]. However, the biological function of AHNAK2 in cancer has not been determined.
In the present study, we investigated the role of AHNAK2 in tumorigenesis and tumor progression. We confirmed upregulation of AHNAK2 in 533 ccRCC clinical samples at the mRNA level and in 355 ccRCC human tissues at the protein level and validated its oncogenic functions. Mechanistically, AHNAK2 appears to exert its effects by promoting cell oncologic-metabolism and mediating hypoxia pathway-driven epithelial-mesenchymal transition and stem cell properties. This work suggests that AHNAK2 can be a novel prognostic marker and an oncogenic protein in ccRCCs.
Materials and Methods
Cell lines and culture
All cell lines were obtained from the American Type Culture Collection (ATCC) and were confirmed by specific indexes. CAKI-1, 769-P, ACHN, 786-O, MCF-7, H460, DU145, HK-2, and 293T were cultured in RPMI-1640 or DMEM supplemented with 10% FBS (Gibco), 100U/ml penicillin, and 0.1 mg/ml streptomycin (Gibco) at 37℃ in humidified 5% CO2 atmosphere. Hypoxic conditions were achieved with a hypoxia chamber (Billups-Rothenberg) flushed with a gas mixture of 1% O2, 5% CO2 and 94% N2.
Plasmid constructs, lentivirus production and infection
AHNAK2 shRNA was cloned into Tet-regulated lentiviral expression vector pLT3REVIR or pLT3GEPIR. The mammalian expression plasmid for human HIF1α was ordered from Addgene. HIF1α shRNA, HIF2α shRNA, and negative control shRNA were ordered from Genechem (Shanghai, China). Human AHNAK2 promoter (from -2131bp to +88bp) was generated by polymerase chain reaction and cloned into pGL4.17 vector. All AHNAK2 promoter mutants were made using the Thermo Scientific Phusion Site-Directed Mutagenesis Kit (Thermo, #F-541). All of the constructs generated were confirmed by DNA sequencing. Lentiviral packaging plasmids pCMV-DR8.8 and pMD2.G were co-transfected with the backbone plasmid into 293T cells for virus production. Cells were selected in 2.5 µg/ml puromycin in the culture medium or by fluorescence-activated cell sorting to generate the stable transfections.
RNA isolation and quantitative RT-PCR
Total RNA was isolated from cultured cells with Trizol reagent (Invitrogen). cDNA was synthesized by reverse transcription using the PrimeScript RT reagent kit (TakaRa) and subjected to quantitative RT-PCR with AHNAK2, VEGF, HIF1α, HIF2α, Glut1, LDHA, E-cadherin, N-cadherin, Vimentin, beta-catenin, ZO-1, and ACTB primers in the presence of the SYBR Green Realtime PCR Master Mix (Toyobo). Relative abundance of mRNA was calculated by normalization to ACTB mRNA. The following primer pairs used to quantitative RT-PCR were listed in Supplementary Table S1. Data were analyzed from three independent experiments and were shown as the mean ± SD.
Immunofluorescence staining
The cells were seeded on Chamber coverslips above 24 h. The cells were fixed with 4% paraformaldehyde for 15 min at room temperature, and then permeabilized with 0.3% Triton X-100. After blocked in donkey serum for 1 h at room temperature, slides were incubated with primary antibody at 4℃ overnight. Then the cells were washed 3 times with PBS, and incubated with fluorescence-conjugated secondary antibodies (1:1,000, Invitrogen,) for 1 h at room temperature in dark. The following antibodies were used for immunofluorescence: antibodies against AHNAK2 (1:200, SIGMA, HPA000878), and HIF1α (1:100, GeneTex, GTX127309). The slides were then washed 3 times with PBS and mounted with Prolong Gold anti-fade reagent with DAPI (Invitrogen). Cell images were captured with a confocal microscope (Nikon).
Immunohistochemistry
Immunohistochemistry was performed for AHNAK2 on the tissue array chip by using anti-AHNAK2 (1:200, SIGMA, HPA002940) primary antibody. The staining score was calculated by multiplying the “stained area (%)” score (0 = no cell positivity, 1 = 1-25%, 2 = 26-50% and 3 = 51-100%) and the intensity score (0 = no staining, 1 = weak, 2 = moderate and 3 = strong). AHNAK2-high was greater than 6. AHNAK2-low was less than or equal to 6.
Western blotting analysis
The cells were cultured under normoxic and hypoxic conditions for 6 h, 12 h, 24 h and 48 h, and then lysed in RIPA (Rockford, Prod#89901) supplemented with proteinase inhibitors. After examining the protein concentration by the BCA Protein Assay Kit (Thermo, Prod#23227), the equivalent protein quantities were subjected to SDS-PAGE, and transferred to PVDF membrane (Millipore, #IPVH00010). Membranes were blocked with 5% non-fat milk or 5% BSA for 1h at room temperature and then probed with the indicated primary antibodies, followed by the appropriate HRP-conjugated anti-mouse/rabbit secondary antibodies (Cell Signaling Technology). Immunoreactive bands were measured with enhanced chemiluminescence Western blotting system (Millipore, #WBKLS0500). The following antibodies were used: antibodies against HIF1α (1:1,000, GeneTex, GTX127309), actin (1:10,000, Cell Signaling Technology, #4970), the Epithelial-Mesenchymal Transition antibody Sampler Kit (1:1,000, Cell Signaling Technology, #9782), Nanog (1:500, ABGENT, AP1486c), the fatty acid and lipid metabolism antibody Sampler Kit (1:1000, Cell Signaling Technology, #8335). The Image J program was used for quantitative analyses of western blots.
Chromatin immune-precipitation assays
CHIP assays were performed with the SimpleCHIP® Enzymatic Chromation IP Kit and protocol (Cell Signaling Technology). Briefly, CAKI-1 cells were cultured under hypoxic conditions for 24 h. The cells were fixed in 1% formaldehyde at room temperature for 10 min and then quenched by glycine addition. Sonicated nuclear lysates were pre-cleared with protein A/G agarose beads and immunoprecipitated with 5 µg anti-HIF1α (GeneTex, GTX127309), or nonspecific IgG antibody. After reverse cross-linking and DNA purification, DNA from input or immunoprecipitated samples was assayed with a standard PCR Method. Data are represented as mean ± SD (n = 3).
Promoter luciferase reporter assays
Genomic human AHNAK2 promoter containing the hypoxia responsive elements sites (HREs) was cloned into the pGL4.17 Vector (Promega). 293T cells were transfected and subjected to the conditions indicated. Luciferase assay was performed using the Dual-Luciferase® Reporter Assay System (Promega) according to the manufacturer's protocol (Promega).
Xenografts model assay
A volume of 100 μL of 3.0 × 10⁶ CAKI-1 cells (Negative control or AHNAK2 shRNA) suspended in PBS/ Matrigel (1:1) were injected into either hind flank of four to six-week-old male nude mice. Negative control-expressing cells were injected on the left of the mouse and AHNAK2 shRNA-expressing cells were injected on the right side of the same mouse. After tumors had grown to at around 2 weeks, 10 mice were randomly divided into two groups: the first group received doxycycline (2 mg/ml) in the water, and the second group received water only. Tumor growth was evaluated by measuring two perpendicular diameters with Vernier calipers every six days, and tumor volume was calculated by the formula: V= L x W2 x 0.52, where L is the length and W is the width of the tumor. At the end of the experiment, the mice were euthanized and tumors were harvested and weighed. All mice were maintained in the Specific-Pathogen-Free Animal Research Centre of Ren Ji Hospital. All experiments were approved by the Animal Research Ethics Committee of Ren Ji Hospital, School of Medicine, Shanghai Jiao Tong University.
Patients and tissues
The large cohort of ccRCC patients paraffin samples (n = 355) between 2000 and 2008 and fifteen fresh samples were obtained from Ren Ji Hospital, with written consent from each patient.
Gene expression data analysis
We analyzed gene expression microarray datasets identified and normalized by Oncomine (http://www.oncomine.org). The Cancer Genome Atlas (TCGA; http://cancergenome.nih.gov) was used to explore the clinical significance of AHNAK2 expression in renal cell carcinoma. Gene set enrichment analysis (GSEA; http://www.broad.mit.edu/gsea) was performed to identify gene sets changed by high AHNAK2 expression vs. low AHNAK2 expression from the public TCGA dataset.
Other Methods
Live-cell imaging, cell proliferation, colony formation and transwell migration are described in detail in Supplementary Methods.
Statistical analysis
Prognostic analysis was performed using the Kaplan-Meter method and compared by the log-rank test. Group differences were analyzed by the Student's t-test and expressed as mean ± SD. Data were collected from at least three independent experiments. Data were then analyzed with the GraphPad Prism 5 software. All statistical tests were two-sided. * p < 0.05, ** p < 0.01, *** p < 0.001.
Results
Identification of AHNAK2 as an upregulated gene in ccRCC
To identify novel oncogenic genes in ccRCC, we performed data-mining analyses from 4 microarray datasets in the Oncomine database, all of which were analyzed using the Human Genome U133A Array [22-25]. We examined the top 200 genes upregulated in each data set, and found that AHNAK2 is one of the 45 overlapping genes among all of the 4 datasets (Figure 1A). While some of them, such as CXCR4, TGFB1 and HEY1 are already implicated in tumorigenesis [26-28], the role of AHNAK2 in cancer is unknown. Thus, we decided to focus on AHNAK2. Notably, the mRNA level of AHNAK2 was enhanced significantly in human ccRCC samples as compared to their adjacent normal renal tissues (Beroukhim Renal, n = 32, fold change = 9.856, p < 0.001; Grumz Renal, n = 10, fold change = 15.044, p < 0.001; Jones Renal, n = 23, fold change = 4.128, p < 0.001; Lenburg Renal, n = 9, fold change = 5.854, p < 0.001; Figure 1B).
AHNAK2 expression is upregurated in ccRCC. (A) Venn diagram analysis of the (overlapping) up-regulated genes based on the four independent datasets Gumz Renal, Jones Renal, Beroukhim Renal, and Lenburg Renal from Oncomine database. (B) Bar charts with the AHNAK2 mRNA levels (log2) on the vertical axis and normal tissues (kidney) vs cancer tissues (ccRCC) on the horizontal axis. Data are collected from datasets used in (A). (C) The mRNA levels of AHNAK2 were analyzed in the ccRCC in the TCGA dataset compared to the adjacent normal controls. (D-G) The clinical characteristics of AHNAK2 expression in ccRCC from the TCGA dataset were analyzed based on TNM stage (D), histological grade (E), lymphatic metastasis (F) and distant metastasis (G). (H-I) Kaplan-Meier analysis of overall survival and progression-free survival for ccRCC patients expressing low or high levels of AHNAK2 expression in from the TCGA dataset (We eliminated the samples from the patients whom were followed up for less than 30 days).
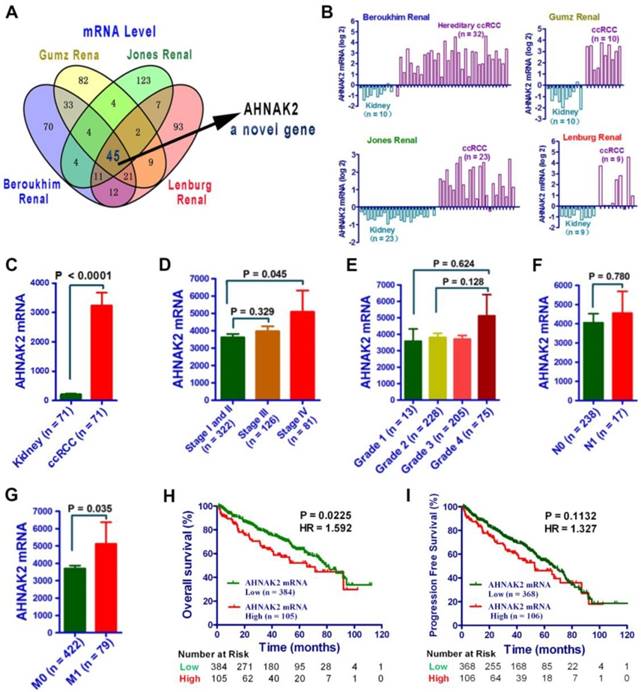
To further determine the role of AHNAK2 in ccRCC, we performed analysis on AHNAK2 expression from a large cohort of public TCGA dataset (n=533). The mRNA levels of AHNAK2 were significantly upregulated in the ccRCC in the TCGA dataset compared to the adjacent normal controls (Figure 1C). Moreover, higher expression of AHNAK2 in ccRCC patients was associated with advance stage, metastasis and shorter overall survival (Figure 1D-1I). These data suggest that overexpression of AHNAK2 may play an important role in the development of ccRCC.
AHNAK2 is upregulated in ccRCC clinical samples and cell lines
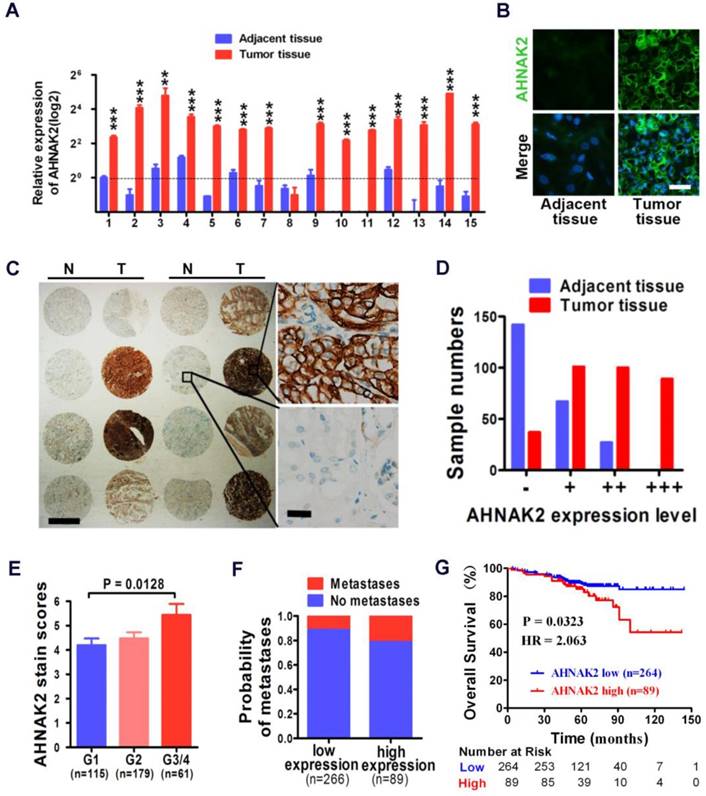
We performed quantitative RT-PCR experiments with freshly collected 15 pairs of human ccRCC specimens and their matched normal tissues. Fourteen of 15 tumor samples showed increased mRNA levels of AHNAK2, compared to adjacent normal tissues (p < 0.001; Figure 2A). Consistently, the enhanced expression of AHNAK2 was confirmed at the protein level by immunofluorescence staining in these freshly collected primary ccRCC (Figure 2B).
High expression of AHNAK2 correlates with ccRCC progression and shortened survival in patients. (A) Quantitative RT-PCR assay for AHNAK2 mRNA level in 15 pairs of human clinical ccRCC tumor tissue and adjacent normal tissue. ** p < 0.01, *** p < 0.001. (B) Immunofluorescence staining analysis for AHNAK2 protein level in ccRCC and adjacent normal tissues. Scale bar = 20 μm. (C) Representative immunohistochemistry micrographs of AHNAK2 expression from the large cohort of ccRCC patients paraffin samples (N = adjacent normal tissue, T = ccRCC tissue). Scale bar: left = 1 mm, right = 25 μm. (D) Quantitative analysis of sample numbers in different AHNAK2 expression levels in 355 ccRCC samples collected from our own Institution. (E) Analysis of AHNAK2 staining scores in association with histopathological grades (n=355). (F) Probability of patients with metastasis in different levels of AHNAK2 expression group (n = 266 in the low-expression group; n = 89 in the high-expression group). (G) Kaplan-Meier curve of comparing overall survival (OS) in the high expression of AHNAK2 group with the low expression group (n= 89 in the AHNAK2 high-expression group, n = 264 in the AHNAK2 low-expression group). The log-rank (Mantel-Cox) test was used.
In addition, we further assessed the expression of AHNAK2 in the immortalized renal tubular epithelial cell line HK-2, the human embryonic kidney cell line 293T and 4 renal cancer cell lines, including CAKI-1, 769-P, 786-O, and ACHN. Both mRNA and protein levels of AHNAK2 were higher in the renal cancer cell lines than HK-2 and 293T cells (Figure S1A, S1B). We made attempts to perform western blots, but failed due to the large size of the AHNAK2 protein (~ 600 kDa). Nevertheless, our quantitative RT-PCR (Figure 2A, Figure S1A), immunofluorescence (Figure 2B, Figure S1B) and immunohistochemistry data (Figure 2C) support the notion that AHNAK2 is upregulated in ccRCC cells and tissues.
High expression of AHNAK2 correlates with the disease progression and shortened patient survival in ccRCC
To determine the clinical relevance of AHNAK2 expression in human ccRCC, we carried out immunohistochemical analysis of AHNAK2 on primary human tumors from a large cohort of 355 ccRCC patient samples collected from our own Institution (Table 1). Expression of AHNAK2 was observed within the cytoplasm of cancer cells (Figure 2C). A significantly increased intensity of AHNAK2 staining was seen in ccRCC tumor tissues compared to the adjacent normal tissues (Figure 2C, 2D). Although AHNAK2 expression did not correlate with age, gender, tumor size, or TNM stage (p > 0.05), The AHNAK2 staining scores of G3-G4 tumors were higher than that of G1 tumors (p = 0.013; Figure 2E), suggesting that the higher ccRCC tumor pathologic grade, the more AHNAK2 upregulation. Metastasis was found more frequently in the tumor samples with higher expression of AHNAK2 (p < 0.05; Figure 2F). Log-rank (Mantel-Cox) test revealed that higher expression of AHNAK2 was significantly correlated with shortened patient survival (p = 0.0323; Figure 2G).
Correlation of AHNAK2 expression to clinicopathological features in ccRRCC.
| Parameters | AHNAK2 | P value | ||
|---|---|---|---|---|
| low | high | |||
| Age (years) | ≤ 55 | 129 (48.5%) | 47 (52.8%) | 0.481 |
| > 55 | 137 (51.5%) | 42 (47.2%) | ||
| Gender | male | 187 (70.3%) | 64 (71.9%) | 0.772 |
| female | 79 (29.7%) | 25 (28.1%) | ||
| Tumor size | ≤ 50 | 145 (54.5%) | 39 (43.8%) | .0081 |
| /mm | > 50 | 121 (45.5%) | 50 (56.2%) | |
| TNM stage | I | 217 (81.6%) | 66 (74.2%) | 0.072 |
| II | 36 (13.5%) | 19 (21.3%) | ||
| III | 8 (3%) | 2 (2.2%) | ||
| IV | 5 (1.9%) | 2 (2.2%) | ||
| Histological | G1 | 99 (37.2%) | 16 (18.0%) | < 0.001 |
| grade | G2 | 133 (50.0%) | 46 (51.7%) | |
| G3 | 30 (11.3%) | 25 (28.1%) | ||
| G4 | 4 (1.5%) | 2 (2.2%) | ||
| pr-Metastasis | M0 | 237 (89.1%) | 70 (78.7%) | 0.013 |
| M1 | 29 (10.9%) | 19 (21.3%) | ||
Note: Statistical significance was calculated by the χ2 test. AHNAK2 expression group: low, score ≤ 6; high, score > 6. TNM stage refers to Tumor Node Metastasis. pr-Metastasis refers to postoperative recurrent-metastasis.
AHNAK2 knockdown inhibits growth and tumorigenesis of ccRCC cells in vitro and in vivo
We next sought to examine the biological functions of AHNAK2 in ccRCC cells using a Tet-ON all-in-one lentivirus-mediated knockdown system. The efficient silencing of AHNAK2 expression was confirmed (Figure 3A, 3B). Cell proliferation was suppressed significantly by knockdown of AHNAK2 in CAKI-1 cells (p < 0.001; Figure 3C). Moreover, CAKI-1 cells stably expressing AHNAK2 shRNA had a marked lower number of colonies compared to control shRNA-transfected cells (Figure 3D). We further assessed the effect of AHNAK2 on cell migration using the Boyden transwell chamber assays. Knockdown of AHNAK2 hindered cell migration (p < 0.001; Figure 3E). Moreover, we performed time-lapse tracking to observe directional migration patterns by single cells (Figure 3F). Cell migration velocity and distance were significantly decreased in AHNAK2-knockdown CAKI-1 cells compared to the control (Figure 3G). These in vitro data were consistent with our finding that increased AHNAK2 is associated with a higher occurrence of human ccRCC metastasis in patients.
AHNAK2 knockdown inhibits the growth of ccRCC in vitro and in vivo. (A) CAKI-1 cells stably transfected with shRNAs were treated with doxycycline (1 μg/ml) for 7 days and performed by quantitative RT-PCR analysis. *** p < 0.001. (B) Representative immunofluorescence staining of AHNAK2 expression in each of the indicated cell lines. Scale bar = 20 μm. (C) The growth inhibition rates were measured by cell counting kit 8 assay at 0, 24, 48, and 72 hours in CAKI-1 cells stably transfected with different AHNAK2 short hairpin RNAs(sh#1 and #2) or control shRNA (sh-neg) after Doxycycline treatment for 7 days or not. ** p < 0.01, *** p < 0.001. (D) Representative images of clonogenic assays of CAKI-1 cells stably expressing AHNAK2 shRNAs (sh#1 and #2) or control shRNA. ** p < 0.01, *** p < 0.001. (E) Representative images of migration assays in CAKI-1 cells (left) and quantification of the relative migration cell number (right). Scale bar = 100 μm. ** p < 0.01, *** p < 0.001. (F) Representative time-lapse tracking images of CAKI-1 with sh-neg or sh-AHNAK2 #1 or #2 during one cell cycle. Each colored line in the bottom panels indicates the migration trace of each cell labeled by arrowhead. (G) Quantitative analysis of directional migration. The left panels indicate the distances and right panels show the velocity of cell migration. *** p < 0.001. (H) Representative images of xenografts derived from CAKI-1 stably transfected with control sh-neg and AHNAK2 sh#1. (n = 5/group). (I) Tumor volume and (J) weights of xenografts derived from control or AHNAK2-knockdowned CAKI-1 cells were evaluated. Each bar represents Mean ± SD in (H) and (I). Two-sided t test. *** p < 0.001.
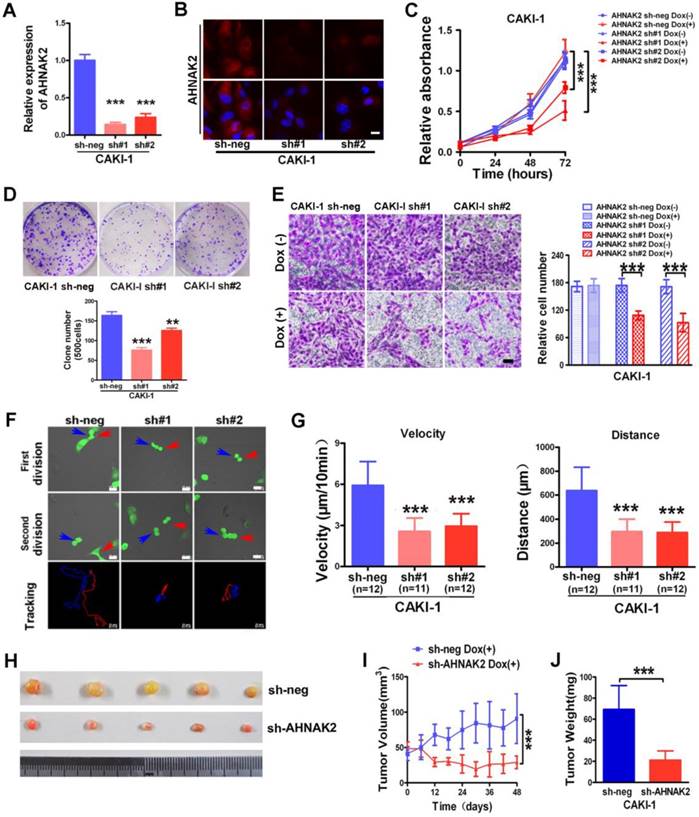
To determine whether the stimulating role of AHNAK2 in ccRCC tumor growth in vitro can be extended in vivo, we performed xenograft model assays using CAKI-1 stably transfected by control or AHNAK2-shRNA lentiviruses, respectively. We found that knockdown of AHNAK2 significantly inhibited tumor growth in nude mice (Figure 3H). Tumor volume and tumor weight were significantly decreased in the xenografts derived from AHNAK2 knockdown cells compared to the control cells (Figure 3I, 3J). We also confirmed the role of AHNAK2 in another cancer cell line 786-O (Figure S2A-2H). These in vitro and in vivo data collectively indicate that AHNAK2 acts as a novel tumor-promoting molecule and positively regulates ccRCC growth.
AHNAK2 knockdown inhibits lipid synthesis in ccRCC cells
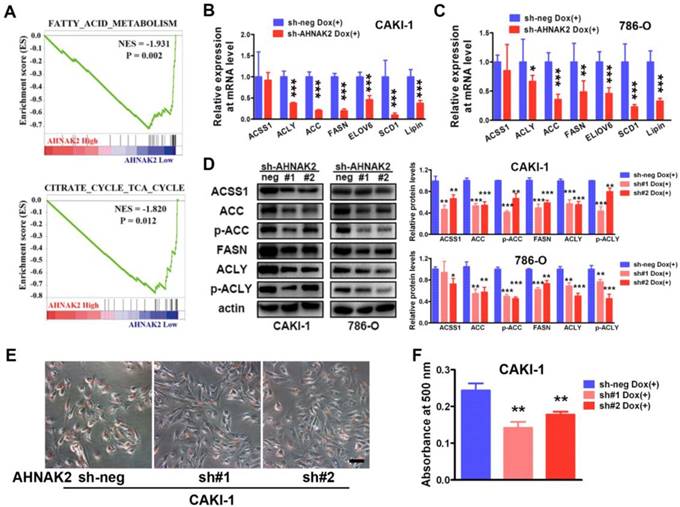
To further identify potential mechanism by which AHNAK2 drives the ccRCC tumorigenesis, we analyzed the gene sets altered by AHNAK2 overexpression using gene set enrichment analysis (GSEA) in human ccRCC samples from the public available TCGA dataset (n=267 in the high expression group and n=266 in the low expression group). Two of the top ten pathways negatively correlated with upregulated levels of AHNAK2 were the fatty acid degradation (p = 0.002) and the citrate cycle (p = 0.012) (Figure 4A). These two pathways are known to be dis-regulated in cancer, especially in ccRCC [29, 30]. The fatty acid and lipid metabolism is critical for energy maintenance and cellular nutrient in caner. To further confirm the link between AHNAK2 expression and metabolic shifting in ccRCC, we measured expression levels of the genes related to fatty acid and lipid synthesis in CAKI-1 and 786-O cells after knockdown of AHNAK2, including ATP citrate lyase (ACLY), acetyl-CoA carboxylase (ACC), fatty acid synthase (FASN), stearoyl-CoA Desaturase-1 (SCD1) and so on. AHNAK2 knockdown caused a decreased expression of these genes at mRNA and protein levels (Figure 4B-4D). In addition, to evaluate of the role of AHNAK2 in lipid synthesis, we performed the Oil-Red O staining to stain lipid droplets. A smaller quantity of lipid droplets were detected in CAKI-1 cells with AHNAK2 knockdown than in control cells, as measured by quantitative Oil-Red O staining (Figure 4E, 4F). These data suggest that AHNAK2 knockdown impairs cell oncologic-metabolism by inhibiting the lipid synthesis.
AHNAK2 knockdown inhibits lipid synthesis in ccRCC cells. (A) The two gene set enrichment analysis (GSEA) profiles (from top ten) for the altered genes data by comparing the AHNAK2 high and low expression sample groups from TCGA data set are shown. NES = normalized enrichment score. (B-C) Quantitative RT-PCR assay was performed to measure the mRNA level of the genes related to lipid synthesis in CAKI-1 and 786-O cells with AHNAK2 knockdown or not. Each bar in the grafts represents Mean ± SD of three independent experiments. Two-sided t test. * p < 0.05, ** p < 0.01, *** p < 0.001. (D) Each cell line as (B and C) was subjected to Western blot analysis to confirm the expression levels of genes related to lipid synthesis. Quantification of the indicated protein level (normalized to actin). The means ± SD from 3 experiments were shown. (E) Oil-Red O staining analysis of lipid droplets in CAKI-1 cells stably transfected AHNAK2 shRNA (sh#1 or sh#2) or control shRNA (sh-neg). (F) Quantitative analysis of lipid droplet formation. To quantify the amount of Oil-Red O after staining the cells, the dye was eluted with 100% isopropanol, and the absorbance was measured at a spectrophotometer at 500 nm (right).
Hypoxia activates the expression of AHNAK2 in cancer cells
Since hypoxia-related pathways play vital roles in the development and progression of ccRCC [4], to study whether there is a link between AHNAK2 and hypoxia pathway, we performed co-expression analysis in human ccRCC samples from Grumz Renal dataset and found that indeed there was a positive correlation between AHNAK2 expression and the expression of the target genes of hypoxia pathway (Figure S3A). We next determined whether the expression of AHNAK2 is upregulated under hypoxic conditions. Five human cell lines including 293T cells, renal cancer CAKI-1, prostate cancer DU145, breast cancer MCF-7 and lung cancer H460 cells were cultured under normoxia (21% O2) and hypoxia (1% O2), respectively for a various time course. AHNAK2 expression was increased gradually under the hypoxia conditions when compared to normoxic cultures (Figure 5A; Figure S3B). These data indicate that hypoxia can activate the expression of AHNAK2 in a variety of human tumor cells.
Hypoxic activation of AHNAK2 expression is HIF1α-dependent. (A) Real-time polymerase chain reaction assay of AHNAK2 transcription in CAKI-1 and 293T cells treated with hypoxia for 0, 6, 12, 24, and 48 hours respectively. Each bar in the graphs represents mean ± SD. Two-sided t test. * p < 0.05, ** p < 0.01, *** p < 0.001. (B) Real-time polymerase chain reaction assay of AHNAK2 and HIF1α transcription in CAKI-1 cells transfected with HA-vector, or HA-HIF1α vector. * p < 0.05, *** p < 0.001. (C) Real-time polymerase chain reaction assay of AHNAK2 and HIF1α transcription in 293T cells transfected with HIF1α short hairpin RNAs (sh#1 and #2) or control shRNA (sh-neg). *** p < 0.001. (D) Real-time polymerase chain reaction assay of AHNAK2 and HIF2α transcription in 293T cells transfected with HIF2α short hairpin RNAs (sh#2 and #3) or control shRNA (sh-neg). *** p < 0.001. (E) Immunofluorescence staining of HIF1α and AHNAK2 expression in CAKI-1 cells transfected with HIF1α short hairpin RNAs (sh#1 and #2) or control shRNA (sh-neg) treated with hypoxia (Scale bar = 25 μm).
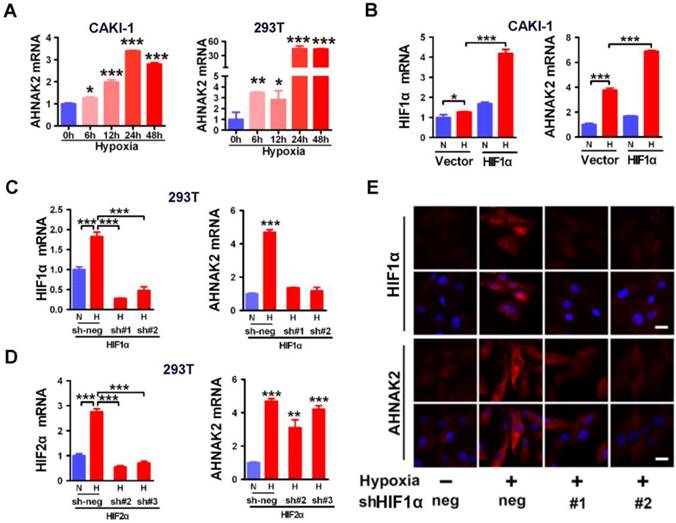
Hypoxic activation of AHNAK2 expression is HIF1α-dependent
HIFs are known to be the key transcription factors that regulate cellular responses to hypoxia [31]. For example, under hypoxia, HIF1α is stabilized and translocated to the nucleus and forms heterodimers with HIF1β to modulate transcriptional activity of hypoxia responsive elements (HREs), leading to transcription of numerous hypoxia-responsive oncogenes and related genes and resulting in development and metastasis of cancer. To determine whether HIF1α is involved in the hypoxia-induced expression of AHNAK2 in ccRCC cells, we found that AHNAK2 transcriptional activity was markedly increased in hypoxia when HIF1α was overexpressed in CAKI-1 cells (Figure 5B). In contrast, knockdown of HIF1α decreased significantly hypoxia-induced expression of AHNAK2 at both the mRNA and protein levels (Figure 5C, 5E), while knockdown of HIF2α cannot (Figure 5D). Taken together, these results suggest that HIF1α, not HIF2α, plays a critical role in the upregulated expression of AHNAK2 under hypoxia.
HIF1α regulates the expression of AHNAK2 through binding directly to the HREs in the AHNAK2 promoter
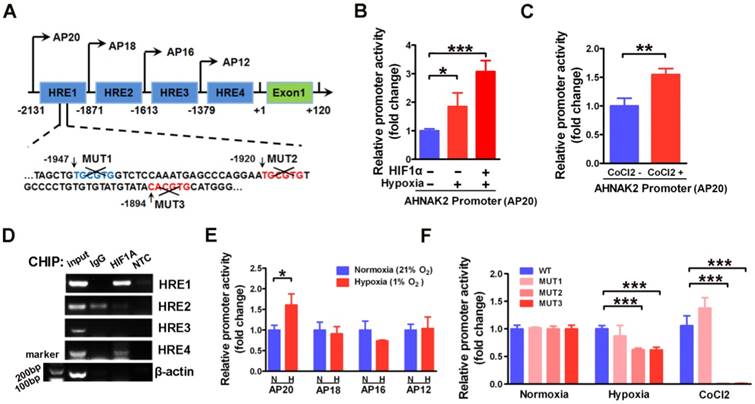
To further understand the molecular mechanism underlying AHNAK2 upregulation in ccRCC, we examined the promoter region of human AHNAK2 gene to determine if there are any binding sites of HIF1α. We identified 4 putative areas containing HREs (Figure 6A). To investigate whether HIF1α directly binds to AHNAK2 promoter, we then performed luciferase assays utilizing the AHNAK2-pGL4.17-firefly reporter containing 4 putative HREs within the AHNAK2 promoter. AHNAK2 promoter activity was enhanced under hypoxic conditions, by addition of 200 μM CoCl2 to the culture media, or by overexpression of HIF1α (Figure 6B, 6C). Chromatin immunoprecipitation assay performed in CAKI-1 cells under hypoxia (1% O2) for 24 hours also revealed that hypoxia promoted the binding of HIF1α to AHNAK2 promoter at HRE1 and HRE4 areas (Figure 6D). To determine whether the HRE1 and HRE4 areas are required for HIF1α to transactivate AHNAK2 expression, we constructed truncated AHNAK2 promoter luciferase vector. Deletion of HRE1 area (the AP20 vs. the AP18) nearly abolished the transactivation of AHNAK2 promoter by hypoxia (Figure 6E). Further, site-directed mutagenesis analysis showed MUT2 (-1920 bp, -1915 bp) and MUT3 (-1894 bp, -1889 bp) in HRE1 area as the functional motifs of HIF1α for the transcriptional activity of the AHNAK2 gene under hypoxia (Figure 6F).
HIF1α can directly binds to the AHNAK2 promoter. (A) Simplified schematic showing the putative hypoxia-response elements and truncated sites in the human AHNAK2 promoter region, +1 indicates translational start site. 293T cells were transfected with the AHNAK2-pGL4.17-firefly reporter construct and a control Renilla expression vector. Luciferase assay was performed under hypoxic conditions, HIF1α over-expression (B) and CoCl2 treatment (200 μM, treated for 48 hours) (C), * p < 0.05, ** p < 0.01, *** p < 0.001. (D) PCR amplification of DNA fragments immuno-precipitated by anti-HIF1α. CAKI-1 cells were cultured under hypoxia conditions for 24 hours and subjected to ChIP assay. (E) The control Renilla expression vector was co-transfected with the AHNAK2-pGL4.17 luciferase reporter construct (AP20) or truncated reporter plasmid (AP18, AP16, AP12) into 293T cells. Luciferase activity assay was performed 48 hours after transfection. * p < 0.05. (F) Luciferase activity of mutant AHNAK2 promoter reporters in CAKI-1 cells normalized to wild type. The pGL4.17-basic luciferase construct was used as a negative control. Three independent experiments were performed in duplicate. Each bar represents mean ± SD. *** p < 0.001.
AHNAK2 knockdown impairs hypoxia-induced EMT and stem cell-like properties
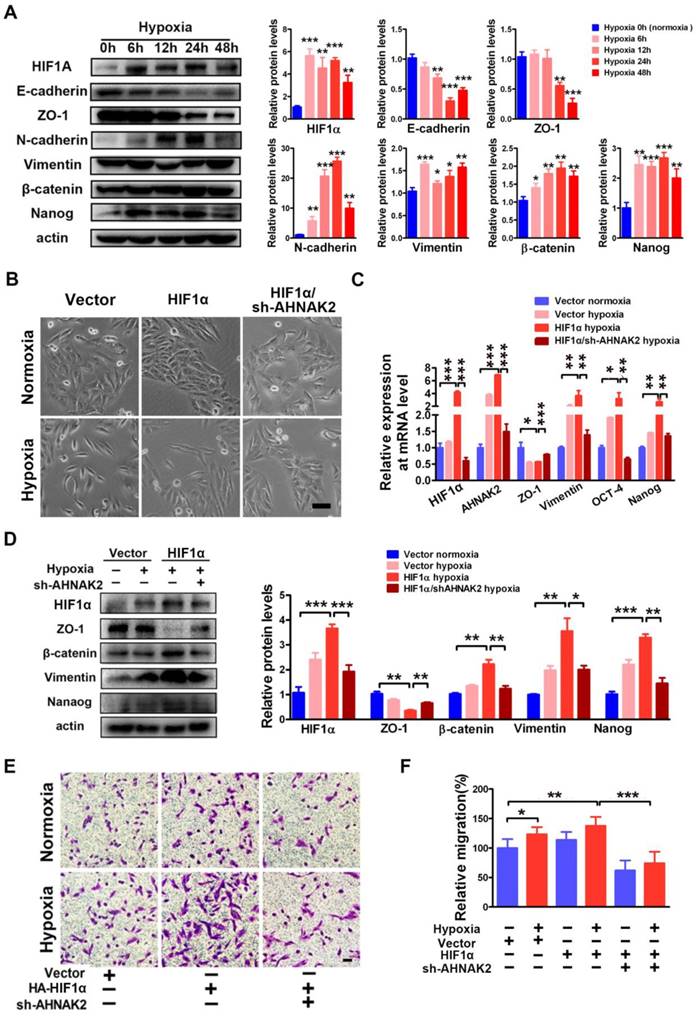
Hypoxia-related pathways contribute to tumor metastasis and poor survival via the governance of epithelial-to-mesenchymal transition (EMT) and cancer stem cell-like properties [32-34]. Consistent with this notion, when CAKI-1 cells were cultured under hypoxia for different time courses, we found a significantly decreased expression of the epithelial markers E-cadherin and ZO-1 and increased expression of the mesenchymal markers including N-cadherin, vimentin, beta-catenin, and the stem cell marker Nanog compared to normoxia (0 hours) cultures at the protein level (Figure 7A). Moreover, overexpression of HIF1α enhanced the EMT induced by hypoxia (Figure 7B-D). To understand the role of AHNAK2 in hypoxia-induced EMT, we knocked down AHNAK2 in HIF1α overexpressing CAKI-1 cells. AHNAK2 knockdown at least partially reversed the transition to a dispersed, fusiform morphology induced by HIF1α under hypoxia (Figure 7B). Meanwhile, AHNAK2 knockdown inhibited the upregulation of the EMT markers vimentin, beta-catenin, and the stem cell markers OCT-4, and Nanog by HIF1α (Figure 7C, 7D). Furthermore, we found that AHNAK2 knockdown reversed the stimulative effect of hypoxia on CAKI-1 cells migration, a phenotype of EMT (p < 0.001; Figure 7E, 7F). These data suggest that AHNAK2 is involved in HIF1α mediated EMT under hypoxia.
AHNAK2 knockdown impairs hypoxia-induced EMT and cancer stem cell-like features. (A) Immunoblot of CAKI-1 cells after exposed to hypoxia (1% O2) for 0, 6, 12, 24, or 48 hours for the EMT markers including E-cadherin, ZO-1, N-cadherin, Vimentin, beta-catenin, and stemness marker Nanog, an beta-actin antibody was used as loading control. (B) CAKI-1 cells that express HA-vector, HA-HIF1α vector or HA-HIF1α and AHNAK2 shRNA vectors were exposed to normoxia (21% O2) or hypoxia (1% O2) for 24 hours, and then were examined for morphology (Scale bar = 100μm). (C) The relative expression of HIF1α, AHNAK2, ZO-1, Vementin, Nanog and OCT-4 were assayed in cells as (B) by quantitative RT-PCR. * p < 0.05, ** p < 0.01, *** p < 0.001. (D) Extracts of these cells were immunoblotted for HIF1α, Nanog, and the EMT markers ZO-1, Vimentin, beta-catenin. (E) Representative images of migration assays in CAKI-1 cells stably expressing HA-vector, HA-HIF1α vector or HA-HIF1α and AHNAK2 shRNA vectors, and exposed to normoxia (21% O2) or hypoxia (1% O2) for 24 hours (scale bar = 100 μm). (F) Quantification of the migration assays of (E). * p < 0.05, ** p < 0.01, *** p < 0.001.
Moreover, to study stem cell phenotypes, we performed sphere-forming cultures. As shown in Figure S4A, knockdown of AHNAK2 significantly reduced the number of spheres compared to the control under the same culture conditions. In addition, expression of AHNAK2 and stem cell markers Nanog and OCT-4 were significantly increased under the sphere culture conditions as compared to attachment cultures (Figure S4B), suggesting that AHNAK2 may play an important role in maintaining stem cell properties of cancer cells.
Discussion
By data mining from multiple sets of database and confirmation of specific gene and protein expression in clinical samples and cell lines, our study reveals AHNAK2 as a novel prognostic marker in ccRCC. It is important to point out that two independent large cohorts of 355 clinical ccRCC samples from our own Institution and 533 ccRCC samples from the public TCGA dataset were used in the current study. High expression levels of AHNAK2 are positively correlated with the pathologic grades, metastasis and the poor survival of ccRCC patients. Thus, upregulation of AHNAK2 may be used to predict a worse prognosis of patients with ccRCC.
Up to now, very little is known about the biological function of AHNAK2 since AHNAK2 is identified [15]. The current study shows that AHNAK2 plays an oncogenic role in tumor growth and progression in ccRCC. Knockdown of AHNAK2 suppresses tumor proliferation, migration and colony formation in vitro and decreased tumor growth in vivo. Further, knockdown of AHNAK2 can inhibits the fatty acid and lipid synthesis, the processes vital for cancer energy maintenance and cellular nutrient, suggesting that the oncogenic effects of AHNAK2 might be achieved by changing cell oncologic-metabolism. Since AHNAK2 shares significant homology and same tripartite protein structure with AHNAK, AHNAK2 may also shares some functions with AHNAK such as fat metabolism, cell-cell contacts, membrane repair, and tumor metastasis. On the other hand, we have also analyzed AHNAK expression in ccRCC patients from TCGA dataset and we find that although AHNAK expression was not significantly different between ccRCC tissues and normal tissues, AHNAK expression was unexpectedly negatively correlated with patients' poor survival (data not shown). This finding suggests that AHNAK appears to exert a tumor-suppressing rather than oncogenic role [35]. However, whether AHNAK2 may interfere with functions of AHNAK and why they have opposite functions remain to be determined.
The present data support the notion that AHNAK2 may be a target gene in the hypoxia-related pathways. First, we found that hypoxia can induce upregulation of AHNAK2 in several human cancer cells. Second, we showed that HIF1α, one main effector for hypoxia, has a direct binding site in the AHNAK2 promoter at HRE1 area using chromatin immunoprecipitation assay. HIF1α regulates AHNAK2 promoter activity based on loss-of-function analysis by knockdown of HIF1α or deletion of hypoxia response elements of the AHNAK2 promoter. Third, the motifs of HIF1α, MUT2 (-1920 bp, -1915 bp) and MUT3 (-1894 bp, -1889 bp), appear to be responsible for the transcriptional activity of AHNAK2 based on site-directed mutagenesis analysis. In addition, knockdown of HIF2α could not inhibit the upregulation of AHNAK2 induced by hypoxia. These results indicate that AHNAK2 may be a specific target gene of HIF1α, but not HIF2α. However, HIF2α, rather than HIF1α, is reported to play a more oncogenic role for ccRCC [4], which is somewhat contradictory to our model. The discrepancy might be explained as follows: Firstly, tumor metabolism, commonly referred as the Warburg effect for which glycolysis is a key component, has emerged as a central feature of ccRCC. It has been shown that the glycolysis-related genes HK2, PGK1, and LDHA are the targets of HIF1α, but not HIF2α and are all highly expressed in many tumors including ccRCC [36]. Secondly, carbonic anhydrase CAIX, a specific target gene of HIF1α, has been an attractive marker for diagnosis, prognosis and therapy of ccRCC [37, 38]. Consistent with this notion, the present study indicates that AHNAK2 regulated by HIF1α, not HIF2α, is an onocgenic protein by enhancing lipid synthesis in ccRCC and that AHNAK2 is upregulated during progression of ccRCC. Although how exactly hypoxia and HIF1α signaling regulate ccRCC development is still not completely understood, the novelty of our current study is to add AHNAK2 to the list of the molecules that may mediate hypoxia-induced tumor proliferation, invasion and metastasis.
It is noted that the oncogenic effects of AHNAK2 on cell proliferation, colony formation and migration are also observed when AHNAK2 is knocked down in 786-O cells that do not express wild type HIF1α, suggesting that AHNAK2 may also serve as a downstream target of other pathways. For example, the PI(3)K/AKT pathway and the Notch signaling pathway have also been implicated to promote formation and progression of ccRCC [29, 39, 40]. Further studies need to be conducted to determine whether other signaling pathways may also regulate the expression of AHNAK2.
The current study provides clear evidence for an oncogenic role of AHNAK2 in tumorigenesis and progression of ccRCC. We propose a candidacy of AHNAK2 as a potential therapeutic target, which is further supported by its role in mediating the hypoxia-promoted epithelial-mesenchymal transition. Hypoxia and hypoxia-related pathways are well-known to contribute to tumor growth, metastasis and poor survival. Our observations that knockdown of AHNAK2 partially reverses the EMT phenotype including EMT gene expression, cell morphology and stem cell properties support the notion that AHNAK2 acts downstream of the hypoxia and HIF1α axis, affecting hypoxia-induced EMT and stem cell properties. In addition, these data also suggest that there are likely other molecules acting downstream of this pathway. Considering that small molecule inhibitors targeting VEGF and mTOR can reduce growth of ccRCC [13], co-targeting both AHNAK2 and those small molecules may provide a more effective therapy for ccRCC.
In summary, we demonstrate that AHNAK2 functions as a novel prognostic biomarker and a novel potential therapeutic target in ccRCC. AHNAK2 is found to be a target gene of HIF1α, mediating hypoxia pathway-driven EMT and stem cell properties. These findings shed a new light on mechanisms of HIF1 signaling-modulated tumor growth and progression.
Supplementary Material
Supplementary figures and tables.
Abbreviations
HIF1α, Hypoxia-inducible factor-1α; ccRCC, clear cell Renal Cell Carcinoma; CHIP, chromatin immune-precipitation; EMT, epithelial-mesenchymal transition; VEGF, vascular endothelial growth factor; mTOR, mammalian target of rapamycin; TCGA, The Cancer Genome Atlas; FACS, the fluorescence activated cell sorting analysis; HREs, hypoxia response elements; ACLY, ATP citrate lyase; ACC, acetyl-CoA carboxylase; FASN, fatty acid synthase; SCD1, stearoyl-CoA Desaturase-1.
Acknowledgements
The authors thank all patients who donated ccRCC samples to this study. We are grateful to Dr. Qiang Liu for his assistance in analysis of the pathology of the immunohistochemical staining. This study was supported by funds from the Chinese Ministry of Science and Technology (2013CB945600 to WQG and RY), the National Natural Science Foundation of China (81630073 and 81372189 to WQG), Science and Technology Commission of Shanghai Municipality (16JC1405700 to WQG), KC Wong foundation (to WQG), Special Research Foundation of State Key Laboratory of Medical Genomics (to WQG), Shanghai Municipal Commission of Health and Family Planning (201540193 to RY), Shanghai Jiao Tong University School of Medicine Doctor Innovation Foundation (BXJ201617 to MW) and the National Science Foundation for Young Scientists of China (81602443 to XL).
Competing Interests
The authors have declared that no competing interest exists.
References
1. Shuch B, Amin A, Armstrong AJ. et al. Understanding pathologic variants of renal cell carcinoma: distilling therapeutic opportunities from biologic complexity. European urology. 2015;67:85-97
2. Shen SS, Krishna B, Chirala R. et al. Kidney-specific cadherin, a specific marker for the distal portion of the nephron and related renal neoplasms. Modern Pathology. 2005;18:933-40
3. Gerharz CD, Moll R, Storkel S. et al. Ultrastructural appearance and cytoskeletal architecture of the clear, chromophilic, and chromophobe types of human renal cell carcinoma in vitro. The American journal of pathology. 1993;142:851-9
4. Schodel J, Grampp S, Maher ER. et al. Hypoxia, Hypoxia-inducible Transcription Factors, and Renal Cancer. European urology. 2015
5. Kroeger N, Xie W, Lee JL. et al. Metastatic non-clear cell renal cell carcinoma treated with targeted therapy agents: characterization of survival outcome and application of the International mRCC Database Consortium criteria. Cancer. 2013;119:2999-3006
6. Rini BI. Targeted therapy for patients with renal-cell carcinoma. The Lancet Oncology. 2011;12:1085-7
7. Escudier B, Eisen T, Stadler WM. et al. Sorafenib in advanced clear-cell renal-cell carcinoma. The New England journal of medicine. 2007;356:125-34
8. Sternberg CN, Davis ID, Mardiak J. et al. Pazopanib in locally advanced or metastatic renal cell carcinoma: results of a randomized phase III trial. Journal of clinical oncology: official journal of the American Society of Clinical Oncology. 2010;28:1061-8
9. Motzer RJ, Hutson TE, Tomczak P. et al. Sunitinib versus interferon alfa in metastatic renal-cell carcinoma. The New England journal of medicine. 2007;356:115-24
10. Escudier B, Pluzanska A, Koralewski P. et al. Bevacizumab plus interferon alfa-2a for treatment of metastatic renal cell carcinoma: a randomised, double-blind phase III trial. Lancet (London, England). 2007;370:2103-11
11. Motzer RJ, Escudier B, Oudard S. et al. Efficacy of everolimus in advanced renal cell carcinoma: a double-blind, randomised, placebo-controlled phase III trial. Lancet (London, England). 2008;372:449-56
12. Pal SK, Nelson RA, Vogelzang N. Disease-specific survival in de novo metastatic renal cell carcinoma in the cytokine and targeted therapy era. PloS one. 2013;8:e63341
13. Buchler T, Bortlicek Z, Poprach A. et al. Outcomes for Patients with Metastatic Renal Cell Carcinoma Achieving a Complete Response on Targeted Therapy: A Registry-based Analysis. European urology. 2015
14. Jonasch E, Gao J, Rathmell WK. Renal cell carcinoma. Bmj. 2014;349:g4797
15. Komuro A, Masuda Y, Kobayashi K. et al. The AHNAKs are a class of giant propeller-like proteins that associate with calcium channel proteins of cardiomyocytes and other cells. Proceedings of the National Academy of Sciences of the United States of America. 2004;101:4053-8
16. Davis TA, Loos B, Engelbrecht AM. AHNAK: the giant jack of all trades. Cellular signalling. 2014;26:2683-93
17. Gentil BJ, Benaud C, Delphin C. et al. Specific AHNAK expression in brain endothelial cells with barrier properties. Journal of cellular physiology. 2005;203:362-71
18. Benaud C, Gentil BJ, Assard N. et al. AHNAK interaction with the annexin 2/S100A10 complex regulates cell membrane cytoarchitecture. The Journal of cell biology. 2004;164:133-44
19. Haase H, Podzuweit T, Lutsch G. et al. Signaling from beta-adrenoceptor to L-type calcium channel: identification of a novel cardiac protein kinase A target possessing similarities to AHNAK. FASEB journal: official publication of the Federation of American Societies for Experimental Biology. 1999;13:2161-72
20. Sussman J, Stokoe D, Ossina N. et al. Protein kinase B phosphorylates AHNAK and regulates its subcellular localization. The Journal of cell biology. 2001;154:1019-30
21. Kirov A, Kacer D, Conley BA. et al. AHNAK2 Participates in the Stress-Induced Nonclassical FGF1 Secretion Pathway. Journal of cellular biochemistry. 2015;116:1522-31
22. Beroukhim R, Brunet JP, Di Napoli A. et al. Patterns of gene expression and copy-number alterations in von-hippel lindau disease-associated and sporadic clear cell carcinoma of the kidney. Cancer research. 2009;69:4674-81
23. Gumz ML, Zou H, Kreinest PA. et al. Secreted frizzled-related protein 1 loss contributes to tumor phenotype of clear cell renal cell carcinoma. Clinical cancer research: an official journal of the American Association for Cancer Research. 2007;13:4740-9
24. Jones J, Otu H, Spentzos D. et al. Gene signatures of progression and metastasis in renal cell cancer. Clinical cancer research: an official journal of the American Association for Cancer Research. 2005;11:5730-9
25. Lenburg ME, Liou LS, Gerry NP. et al. Previously unidentified changes in renal cell carcinoma gene expression identified by parametric analysis of microarray data. BMC cancer. 2003;3:31
26. Zagzag D, Krishnamachary B, Yee H. et al. Stromal cell-derived factor-1alpha and CXCR4 expression in hemangioblastoma and clear cell-renal cell carcinoma: von Hippel-Lindau loss-of-function induces expression of a ligand and its receptor. Cancer research. 2005;65:6178-88
27. Shang D, Liu Y, Yang P. et al. TGFBI-promoted adhesion, migration and invasion of human renal cell carcinoma depends on inactivation of von Hippel-Lindau tumor suppressor. Urology. 2012;79:966 e1-7
28. Gaetani P, Hulleman E, Levi D. et al. Expression of the transcription factor HEY1 in glioblastoma: a preliminary clinical study. Tumori. 2010;96:97-102
29. Cancer Genome Atlas Research N. Comprehensive molecular characterization of clear cell renal cell carcinoma. Nature. 2013;499:43-9
30. Zaidi N, Swinnen JV, Smans K. ATP-citrate lyase: a key player in cancer metabolism. Cancer research. 2012;72:3709-14
31. Mimeault M, Batra SK. Hypoxia-inducing factors as master regulators of stemness properties and altered metabolism of cancer- and metastasis-initiating cells. Journal of cellular and molecular medicine. 2013;17:30-54
32. Marie-Egyptienne DT, Lohse I, Hill RP. Cancer stem cells, the epithelial to mesenchymal transition (EMT) and radioresistance: potential role of hypoxia. Cancer letters. 2013;341:63-72
33. van den Beucken T, Koch E, Chu K. et al. Hypoxia promotes stem cell phenotypes and poor prognosis through epigenetic regulation of DICER. Nature communications. 2014;5:5203
34. Myszczyszyn A, Czarnecka AM, Matak D. et al. The Role of Hypoxia and Cancer Stem Cells in Renal Cell Carcinoma Pathogenesis. Stem cell reviews. 2015;11:919-43
35. Lee IH, Sohn M, Lim HJ. et al. Ahnak functions as a tumor suppressor via modulation of TGFbeta/Smad signaling pathway. Oncogene. 2014;33:4675-84
36. Hu CJ, Wang LY, Chodosh LA. et al. Differential roles of hypoxia-inducible factor 1alpha (HIF-1alpha) and HIF-2alpha in hypoxic gene regulation. Molecular and cellular biology. 2003;23:9361-74
37. Grabmaier K, MC AdW, Verhaegh GW. et al. Strict regulation of CAIX(G250/MN) by HIF-1alpha in clear cell renal cell carcinoma. Oncogene. 2004;23:5624-31
38. Stillebroer AB, Mulders PFA, Boerman OC. et al. Carbonic Anhydrase IX in Renal Cell Carcinoma: Implications for Prognosis, Diagnosis, and Therapy. European urology. 2010;58:75-83
39. Sjolund J, Johansson M, Manna S. et al. Suppression of renal cell carcinoma growth by inhibition of Notch signaling in vitro and in vivo. The Journal of clinical investigation. 2008;118:217-28
40. Sjolund J, Bostrom AK, Lindgren D. et al. The notch and TGF-beta signaling pathways contribute to the aggressiveness of clear cell renal cell carcinoma. PloS one. 2011;6:e23057
Author contact
![]() Corresponding authors: Wei-Qiang Gao or Ru Yang or Yi-Ran Huang, Renji-MedX Stem Cell Research Center, Ren Ji Hospital, School of Medicine, Shanghai Jiao Tong University, Shanghai 200127, China. Email: gao.weiqiangedu.cn or yangrucom or huangyrrenjicom.
Corresponding authors: Wei-Qiang Gao or Ru Yang or Yi-Ran Huang, Renji-MedX Stem Cell Research Center, Ren Ji Hospital, School of Medicine, Shanghai Jiao Tong University, Shanghai 200127, China. Email: gao.weiqiangedu.cn or yangrucom or huangyrrenjicom.