Impact Factor
- Issue 12; 2026
- Issue 11; 2026
- Issue 10; 2026
- Issue 9; 2026
- Issue 8; 2026
- Volume 16; 2026
- Advance Articles
- Past Issues
- Cover Images
- Cover Suggestion
- Index & Coverage
- Special Issues
Introduction
Materials and methods
Results
Discussion
Conclusions
Supplementary Material
Acknowledgements
References
International Journal of Biological Sciences
International Journal of Medical Sciences
 Global reach, higher impact

Theranostics 2017; 7(3):624-633. doi:10.7150/thno.17484 This issue Cite
Research Paper
Hybrid Imaging Labels: Providing the Link Between Mass Spectrometry-Based Molecular Pathology and Theranostics
Tessa Buckle1,2 ![]() , Steffen van der Wal1, Stijn J.M. van Malderen3, Larissa Müller4, Joeri Kuil1, Vincent van Unen5, Ruud J.B. Peters6, Margaretha E.M. van Bemmel6, Liam A. McDonnell7, Aldrik H. Velders1,8, Frits Koning6, Frank Vanhaeke3, Fijs W. B. van Leeuwen1, 8
, Steffen van der Wal1, Stijn J.M. van Malderen3, Larissa Müller4, Joeri Kuil1, Vincent van Unen5, Ruud J.B. Peters6, Margaretha E.M. van Bemmel6, Liam A. McDonnell7, Aldrik H. Velders1,8, Frits Koning6, Frank Vanhaeke3, Fijs W. B. van Leeuwen1, 8
1. Interventional Molecular Imaging laboratory, Department of Radiology, Leiden University Medical Center, Leiden, the Netherlands;
2. Division of Molecular Pathology, Netherlands Cancer Institute- Antoni van Leeuwenhoek hospital (NKI-AvL), Amsterdam, the Netherlands.
3. Department of Analytical Chemistry, Ghent University, Ghent, Belgium.
4. Bundesanstalt für Materialforschung und -prüfung (BAM), Berlin, Germany.
5. Department of immunohematology and Blood Transfusion, Leiden University Medical Center, Leiden, the Netherlands.
6. RIKILT Wageningen UR, Wageningen, the Netherlands.
7. Center for Proteomics and Metabolomics, Leiden University Medical Center, Leiden, the Netherlands.
8. Laboratory of BioNanoTechnology, Wageningen University, Wageningen, the Netherlands.
Received 2016-9-6; Accepted 2016-11-16; Published 2017-1-12
Abstract

Background: Development of theranostic concepts that include inductively coupled plasma mass spectrometry (ICP-MS) and laser ablation ICP-MS (LA-ICP-MS) imaging can be hindered by the lack of a direct comparison to more standardly used methods for in vitro and in vivo evaluation; e.g. fluorescence or nuclear medicine. In this study a bimodal (or rather, hybrid) tracer that contains both a fluorescent dye and a chelate was used to evaluate the existence of a direct link between mass spectrometry (MS) and in vitro and in vivo molecular imaging findings using fluorescence and radioisotopes. At the same time, the hybrid label was used to determine whether the use of a single isotope label would allow for MS-based diagnostics.
Methods: A hybrid label that contained both a DTPA chelate (that was coordinated with either 165Ho or 111In) and a Cy5 fluorescent dye was coupled to the chemokine receptor 4 (CXCR4) targeting peptide Ac-TZ14011 (hybrid-Cy5-Ac-TZ4011). This receptor targeting tracer was used to 1) validate the efficacy of (165Ho-based) mass-cytometry in determining the receptor affinity via comparison with fluorescence-based flow cytometry (Cy5), 2) evaluate the microscopic binding pattern of the tracer in tumor cells using both fluorescence confocal imaging (Cy5) and LA-ICP-MS-imaging (165Ho), 3) compare in vivo biodistribution patterns obtained with ICP-MS (165Ho) and radiodetection (111In) after intravenous administration of hybrid-Cy5-Ac-TZ4011 in tumor-bearing mice. Finally, LA-ICP-MS-imaging (165Ho) was linked to fluorescence-based analysis of excised tissue samples (Cy5).
Results: Analysis with both mass-cytometry and flow cytometry revealed a similar receptor affinity, respectively 352 ± 141 nM and 245 ± 65 nM (p = 0.08), but with a much lower detection sensitivity for the first modality. In vitro LA-ICP-MS imaging (165Ho) enabled clear discrimination between CXCR4 positive and negative cells, but fluorescence microscopy was required to determine the intracellular distribution. In vivo biodistribution patterns obtained with ICP-MS (165Ho) and radiodetection (111In) of the hybrid peptide were shown to be similar. Assessment of tracer distribution in excised tissues revealed the location of tracer uptake with both LA-ICP-MS-imaging and fluorescence imaging.
Conclusion: Lanthanide-isotope chelation expands the scope of fluorescent/radioactive hybrid tracers to include MS-based analytical tools such as mass-cytometry, ICP-MS and LA-ICP-MS imaging in molecular pathology. In contradiction to common expectations, MS detection using a single chelate imaging agent was shown to be feasible, enabling a direct link between nuclear medicine-based imaging and theranostic methods.
Keywords: bimodal, fluorescence, molecular imaging, molecular pathology, mass spectrometry, mass cytometry, LA-ICP-MS imaging, radioisotopes, SPECT.
Introduction
The use of technologies based on inductively coupled plasma (ICP) mass-spectrometry (MS), in the form of MS-based cytometry and laser ablation ICP-MS (LA-ICP-MS) imaging for mass spectrometry immunohistochemistry (MSIHC), is gaining attention in molecular pathology. Along with the multiplexing potential (e.g. ability to detect multiple targets within one sample) of this technology, its wide dynamic range and the absence of background effects due to autofluorescence shows promise in the elucidation of molecular profiles. This does, however, require receptor-targeting vectors (e.g. antibodies) that are functionalized with non-ionizing lanthanide isotopes. [1,2,3]
The use of MS-labels that contain a single lanthanide isotope theoretically allows for multiplexing of up to 100 targets. Such a level of multiplexing cannot be achieved using standard brightfield microscopy or fluorescence detection techniques, in spite of development of advanced sequential methods such as dye-cycling.[4] Isotopically enriched stable isotopes are expensive but mono-isotopic elements (e.g. 165Ho) can be accurately detected with a higher sensitivity. This means that in MS approaches mono-isotopic elements are preferred over isotopes that convey multiple masses (e.g. 158Gd).[5] To generate MS-dedicated tracers, targeting vectors are generally functionalized with (commercially available) polymeric structures that contain 130-160 chelates and the corresponding number of non-ionizing metal (most often lanthanide) isotopes, e.g. 113In, 176Lu or 165Ho.[2] Unfortunately the molecular weight of these “large” polymeric MS-tags is close to that of an antibody or protein (100-150 kD) and can therefore influence the properties of the binding vector.[6] In nuclear medicine identical or similar targeting vectors labeled with only a “small” single chelate (Mw: 540 Da [7]) and a single radioisotope atom (e.g. 111In, 177Lu or 166Ho) are used for both imaging and therapy.[8] It is important to note that in nuclear medicine one aspect of tracer optimization has always been to minimize the impact of imaging labels on the receptor affinity and in vivo kinetics of targeting vectors. Hereby the size and chemical characteristics of the label influences the overall properties of the tracer. [9-11]
Through theranostics, the fields of radio-immunotherapy and peptide-based systemic radionuclide therapy have started to gain ground.[12, 13] Because of their economic and practical advantages over antibodies (e.g. lower production cost, easier GMP manufacturing protocols and improved pharmacokinetics), peptides are increasingly applied in the clinic.[14] Without changing the tracer, diagnostic and therapeutic applications of peptides can be linked through the use of two different (radio)isotopes, e.g. 111In or 68Ga for diagnostic applications and 177Lu, or 90Y for therapeutic applications. Some radioisotopes almost seem to be tailored towards such combined use. For example, 166Ho provides two different emission types; γ-rays for scintigraphy and β-particles for therapeutic applications.[15]
A promising oncologic target that has been pursued successfully in a peptide-based theranostic set-up is the chemokine receptor 4 (CXCR4) [16, 17]; CXCR4 expression is directly related to the malignancy and metastatic nature of cancer.[18, 19] Depending on the type of label one wants to introduce, there are different targeting vectors available for CXCR4.[20] Here one should consider that, for now, fluorescent or bimodal (or rather hybrid) labels seem to require a (larger) targeting vector, e.g. Ac-TZ14011.
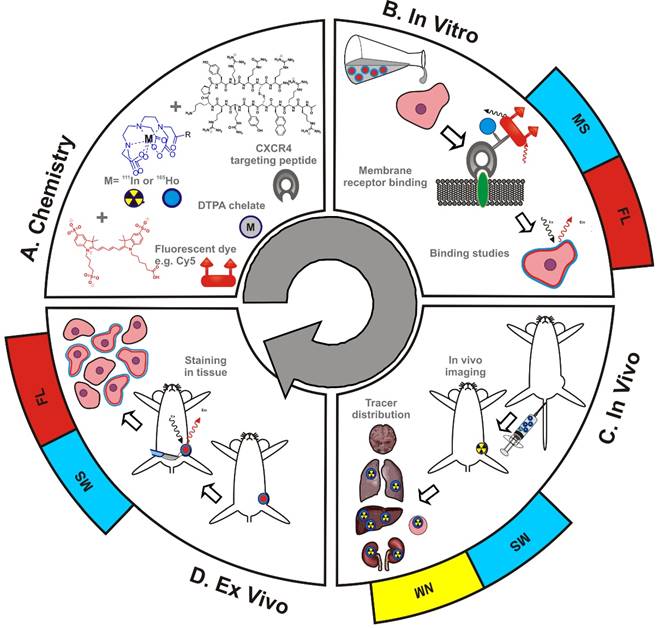
While the effectiveness of theranostic concepts can be proven in vivo using tumor models, their early phase development can be hindered by the inability to microscopically analyze the tracer-uptake in cells (in vitro) and tissue (ex vivo). In a different setting, namely that of image-guided surgery, the use of hybrid imaging tracers allowed successful integration of non-invasive diagnostic imaging (based on the radioisotope) with detailed analysis of pathological tissue sections (based on fluorescence).[21-24] Theoretically, the fluorescent component in hybrid tracers could help to provide a direct link between MS and radioisotope-based findings. At the same time, the use of a hybrid label could also help in determining whether “large” multi-chelate labels are indeed absolutely required for MS-based diagnostics. To study these concepts, the CXCR4 targeting peptide Ac-TZ14011 was functionalized with a hybrid label that contained a diethylenetriaminepentaacetic acid (DTPA) chelate and a Cy5 fluorescent dye (Scheme 1A). Application of this hybrid tracer was used to: 1) validate the efficacy of (165Ho-based) mass-cytometry in determining the receptor affinity of targeting peptides (in this case the CXCR4 targeting peptide Ac-TZ14011) via comparison to fluorescence-based flow cytometry (Cy5; Scheme 1B), 2) evaluate the microscopic binding pattern of the tracer in tumor cells using both fluorescence confocal imaging (Cy5) and LA-ICP-MS-imaging (165Ho; Scheme 1B), 3) compare in vivo biodistribution patterns obtained with ICP-MS (165Ho) and radiodetection (111In) in tumor-bearing mice (Scheme 1C), and 4) link LA-ICP-MS-imaging (165Ho) to the molecular pathology of excised tissue samples (Cy5; Scheme 1D).
Schematic overview of the use of hybrid tracers in theranostic applications. A) Components that make up the hybrid tracer used to target CXCR4: a Cy5-fluorescent dye, a DTPA-chelate and the CXCR4 targeting peptide Ac-TZ14011. After functionalization with either a radioisotope (radiolabel; yellow) or a non-ionizing lanthanide isotope (blue), this tracer also becomes of value for respectively nuclear medicine (NM) or mass spectrometry (MS) based applications. B) In vitro this tracer can be used in fluorescence (FL)- (red) and MS-based cytometry and imaging studies. C) In vivo NM-based imaging studies can be complemented with NM- or MS-based analysis of uptake levels in tissues and D) ex vivo FL- and MS-based imaging could be used to evaluate the degree and heterogeneity of tissue staining following in vivo tracer administration.
Materials and methods
For synthesis and labeling of the Hybrid-Cy5-Ac-TZ14011 tracer, see the 'Materials and methods' section of the supporting information (SI).
Flow cytometry
MDAMB231 and MDAMB231 X4 human breast cancer cells [25] were trypsinized and aliquoted in portions of 300000 cells. For details on the culturing conditions, see the SI. For saturation binding experiments, different concentrations of hybrid-Cy5-Ac-TZ14011 ranging between 0 and 1000 nM in 50 μL of 0.1% bovine serum albumin (BSA) in PBS were added. Cells were incubated for 1 hr at 4 °C. The cells were washed three times with 300 μL of 0.1% BSA in PBS and re-suspended in 300 μL of 0.1% BSA in PBS. Fluorescence was measured using a LSRII flow cytometer (BD Biosciences) at APC-A settings (635 nm laser and 750 nm long pass filter). Live cells were gated on Forward Scatter, Side Scatter and Pulse Width, and 20000 viable cells were analyzed. All experiments were performed in triplicate (total n=6).
Mass cytometry
0.5 x 10⁶ MDAMB231 X4 and 0.5 x 10⁶ MDAMB231 cells were aliquoted per sample, to which 1 mL of 1:500 diluted 500 µM 103Rh DNA intercalator (Fluidigm) with Staining Buffer (Fluidigm) was added for 15 minutes at RT to stain dead cells as the dye only enters cells when cell membranes are compromised. Subsequently, cells were washed twice with Staining Buffer (Fluidigm). 250nM (165Ho)hybrid-Cy5-Ac-TZ14011 was added to the cells, and incubated for 1 hour at 4ºC. Following incubation, cells were washed twice with Staining Buffer. Hereafter cells were incubated with 1 mL of 1:1000 diluted 125 μM DNA intercalator-Ir (containing 191Ir and 193Ir in MaxPar Fix and Perm Buffer (Fluidigm)) overnight at 4ºC to stain all cells. Hereafter cells were centrifuged at 2500 rpm and the supernatant discarded. Cells were washed twice with Staining Buffer followed by two washing steps with MilliQ water (MQ). Prior to data acquisition, cell pellets were diluted in MQ water containing 1:10 diluted EQ Four Element Calibration Beads (Fluidigm) to the concentration of 0.5 *106 cells/mL to achieve an acquisition rate of 500 events/s on the CyTOF 2TM mass cytometer (Fluidigm). Data was acquired and analyzed using dual-count mode and noise-reduction on. After data acquisition, the mass bead signal was used to normalize the short-term signal fluctuations with the reference EQ passport P13H2302 during the course of each experiment and the bead events were removed. Data analysis was performed with FlowJo v10.1 (Tree Star Inc.). Determination of the dissociation constants is described in the SI.
Fluorescence imaging of cells
For details on the sample preparation for imaging of cells, see the SI. Confocal imaging was performed on viable cells, using an SP8 WLL fluorescence confocal microscope (Leica). Cells were incubated with hybrid-Cy5-Ac-TZ14011 (1mg/ml, 1:200) for 1 hr at 40C and washed three times with medium. Prior to imaging the nuclei of the cells were stained with Hoechst 33342 (ThermoFisher Scientific). Sequential scanning settings were used to visualize all fluorescent features; Cy5 (ex 633 nm, em 650-700 nm), GFP (ex 488 nm, em 525-575 nm) and Hoechst (ex 405 nm, em 425-474 nm). A maximum intensity projection (MIP) of 25 separate images over approximately 10um (height of the cell) was used to obtain a 3D representation of the sample. For the evaluation of the variation in the staining over time images were obtained over 60 minutes, with a 2 minute time interval. Intensity profiles and pixel counts were obtained with ImageJ (ImageJ 1.45s).
MS imaging of cells
Slides with cells were washed twice with PBS, incubated with 250 nM (165Ho)hybrid-Cy5-Ac-TZ14011 for 1 hr at 40C and fixed in a 4% Formalin solution.
For ICP-MS imaging a commercial LA system (New Wave 213, Portland, USA) carried out with a beam expander and laser spot sizes between 4 µm and 250 µm, was attached to an ICP-SF-MS device (Element XR, Thermo Fisher Scientific). For imaging 165Ho was selected and a 15 µm laser spot (213 nm, 5 µm overlap, “real” spot size 10 µm), 15 µm/s scan rate and 20 Hz repetition rate were used. Samples were completely ablated line by line under optimized LA-ICP-MS conditions (ablation gas flow: 1 L min-1 He, RF plasma source: 1350 W, plasma gas flow: 16 L min-1 Ar, auxillary gas flow: 1.1 L min-1 Ar). ImageJ was used to create intensity profiles or color-coded images by transforming the scan time into a micrometer scale.
In vivo SPECT imaging
Details on the generation of the in vivo tumor model can be found in the SI. Mice were injected intravenously with (111In)hybrid-Cy5-Ac-TZ14011 (50 μg, 10 MBq) and imaged at 24 hrs post-injection (n=5). Animals were anesthetized with a mixture of Hypnorm, Dormicum and water suitable for injection; 1:1:2; 5μL/gr intraperitoneal (i.p.), prior to placement onto a dedicated positioned bed of a three-headed U-SPECT (MILabs, Utrecht, The Netherlands). Radioactivity counts from total body scans were acquired over 45 minutes using a 0.6 mm mouse multi-pinhole collimator in list mode data. For reconstruction from list mode data, the photo-peak energy window was centered at 171 and at 245 keV with a window width of 20%. Side windows of 5% were applied to correct for scatter and down scatter corrections. The image was reconstructed using 6 pixel based ordered subset expectation maximization iterations (POSEM) with 16 subsets, unfiltered 0.2 mm isotropic voxel size and with decay and triple energy scatter correction integrated into the reconstruction.[26] Volume-rendered images were generated from 4 mm slices and analyzed using Matlab R2014a software (v 8.3.0.532, MatWorks®). Images were generated using maximum intensity projections (MIP). A Gaussian filter of 1.65 mm full width at half maximum (FWHM) was applied to the 3D data to suppress small scale non-uniformities and the color scale threshold was adjusted to achieve optimal lesion identification.[27] Images were reconstructed and evaluated by using identical settings and cut-off values. After imaging the mice were included in the biodistribution study.
Biodistribution Studies
Mice were sacrificed at twenty-four hours after intravenous injection of 50 μg of (111In)hybrid-Cy5-Ac-TZ14011, (165Ho)hybrid-Cy5-Ac-TZ14011 or 111In(165Ho)hybrid-Cy5-Ac-TZ14011 (10 MBq, n=3-5 for each group), and tissues were excised and weighed individually. Samples containing both labels were first divided in half before being weighed; One part was used to measure the content of radioactivity, the other part was used for lanthanide detection. The level of radioactivity present in the tissues containing the radiolabeled compound was counted using a gamma counter (2470 automatic gamma counter, Perkin-Elmer, 245 keV, 60 s). Counts per minute were converted into 1) the total amount of 111In atom counts and 2) MBq, and corrected for decay and counting efficiency. The percentage of the injected dose per gram of tissue (% ID/g) was calculated as follows: [(MBq measured in tissue/injected dose) X 100%]/weight of tissue. The total amount of 111In atom counts per gram of tissue was calculated by dividing the total amount of 111In counts by the weight of the tissue. Lanthanide-containing tissue samples were freeze dried before the tissue was degraded in boiling 69% nitric acid (Traceselect) in 20 mL glass scintillation vials. Note: especially in high-content organs such as the liver and kidneys destruction of small parts of the tissues (>1.0 g) was required to realize accurate measurement outcomes. Samples were heated in a sand bath at 120 °C until nearly dry and after cooling were subsequently re-dissolved in 2 mL 1.5 % nitric acid.[28] 165Ho content was measured on a Thermo X series-2 ICP-MS system equipped with an auto-sampler and a conical glass concentric nebulizer and operated at an RF power of 1400 W. Data acquisition was performed in the selected ion monitoring mode at m/z ratio of 165 that is characteristic for 165Ho. Quantification was based on ionic 165Ho standard diluted in the same acidic matrix. The percentage of the injected dose per gram of tissue (% ID/g) was calculated as follows: [(amount of 165Ho isotopes measured in tissue/injected dose) x 100%]/weight of tissue. The total amount of 165Ho atom counts per gram of tissue was calculated by dividing the total amount of 165Ho counts by the weight of the tissue.
Imaging of tissue sections
Frozen tissue sections (4 μm thickness) obtained from tissues that were excised during the distribution study were used for both fluorescence- and scanning mass-spectrometry imaging of tissues.
Fluorescence imaging of tissues
Tissue sections nuclei were stained using 25 μl of Prolong Gold DAPI (4',6-diaminidino-2-phenylindole) mounting medium (Thermofisher Scientific). The hybrid-Cy5-Ac-TZ14011 content of the sections was visualized at a 10x magnification using a DM5500 fluorescence microscope (Leica) using Cy5 and DAPI settings and Colorpic software. Intensity profiles and pixel counts were obtained with ImageJ.
MS-imaging of tissues
LA-ICP-MS imaging was performed using a 193 nm ArF*excimer-based Analyte G2 LA-unit (Teledyne CETAC Technologies) hyphenated to complement a quadrupole-based ICP-MS device. For imaging, a laser spot size of 15 µm diameter (5 µm overlap and a actual spatial resolution of 10µm), 15 µm s-1 translation speed and 20 Hz repetition rate were selected.
Statistics
Statistics were performed using a standard unpaired t-test.
Results
Receptor affinity (Mass-cytometry vs. flow cytometry)
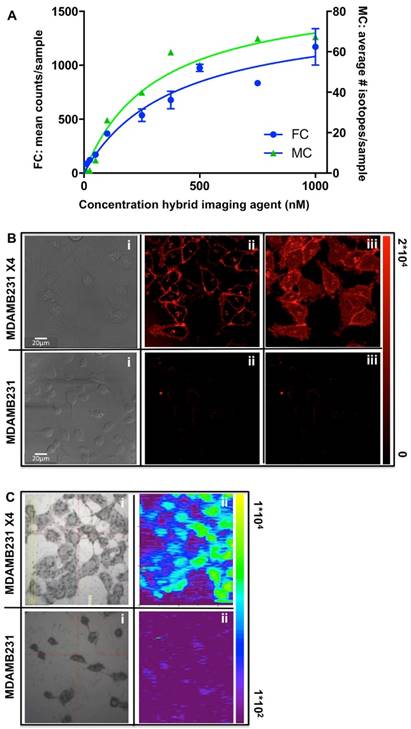
Direct comparison between fluorescence-cytometry and mass-cytometry for assessment of the tracer affinity was achieved via the evaluation of identically prepared cell samples using different methods. For fluorescence-based flow-cytometry the Cy5 signal was used as readout. This resulted in an affinity of 245 ± 65 nM using non-functionalized hybrid-Cy5-Ac-TZ14011 or hybrid-Cy5-Ac-TZ14011 functionalized with 165Ho. These values are in agreement with previous reports using different conjugates from the same peptide (functionalized with slightly different imaging labels; e.g. DTPA, a fluorescent dye alone and a different hybrid label).[20] Mass-cytometry measurements using 165Ho-hybrid-Cy5-Ac-TZ14011 provided a KD value that was not significantly different (p = 0.08) from the values found using fluorescence, namely 352 ± 141 nM (Figure 1A). However, the relatively low maximum signal intensity obtained with mass-cytometry (being 65 atom counts vs. 1100 fluorescence counts) could be seen as a weakness of this detection method.
Determination of the receptor affinity via fluorescence-cytometry and mass-cytometry. A) Concentration-dependent saturation curves generated upon measurement of the mean amount of fluorescent counts (FC: fluorescence-cytometry; blue), or the average amount of 165Ho-isotopes (MC: mass-cytometry; green) in each cell sample (n=6 for both methods). B) Fluorescence microscopy of viable CXC4 overexpressing MDAMB231 X4 (top images) and basal CXCR4 expressing MDAMB231 cells (bottom images) after incubation with 165Ho-hybrid-Cy5-Ac-TZ14011; i = brightfield image, ii = single plane confocal image, iii = 3D confocal image (MIP). C) LA-ICP-MS imaging image of similar cell samples that were formalin fixed after incubation for 1hr with 165Ho-hybrid-Cy5-Ac-TZ14011.
Fluorescence microscopy vs. LA-ICP-MS-imaging of cells
The uptake specificity and cellular localization of binding of (165Ho-)hybrid-Cy5-Ac-TZ14011 was evaluated using both fluorescence confocal microscopy and LA-ICP-MS imaging. This was performed using basal CXCR4 expressing MDAMB231 cells and CXCR4 overexpressing MDAMB231 X4 cells. Cy5-based fluorescence imaging (Figure 1Bii) revealed clear localization at the membrane of the MDAMB231 X4 cells (10-20 μm in diameter; maximum signal intensity: 2*104 pixel counts), which corresponds to the GFP signal of the CXCR4 receptor; in this cell-line, GFP was fused to the CXCR4 receptor (See SI, Figure SI1).[25] A 3D image of these samples (maximum intensity projection (MIP) of 25 separate images over approximately 10 μm (height of the cell)) revealed the complete staining pattern of the cells (Figure 1Biii). No clear signal could be detected in the MDAMB231 cells.
Using LA-ICP-MS imaging, uptake of 165Ho-hybrid-Cy5-Ac-TZ14011 was clearly seen in the MDAMB231 X4 cells (maximum signal: 1*104 165Ho atom counts), while the signal measured in the MDAMB231 cells did not significantly exceed the background signal (1*102 165Ho atom counts; Figure 1C). Unfortunately, the resolution of MS-imaging (lateral resolution: 10 μm) did not allow for in-plain imaging, and thus only provided a more global distribution pattern of (Figure 1Cii).
In vivo biodistribution patterns
In vivo radioactivity-based imaging was performed in mice using SPECT after intravenous injection of 111In-hybrid-Cy5-Ac-TZ14011 (tracer-labeling: 10 MBq/mouse, 3.5*1011 111In atoms; Figure 2A). These images revealed a high uptake in the liver and kidneys as well as in the tumor (T). Ex vivo analysis (Figure 2B, blue bars and Figure 2C) revealed that uptake in the tumor exceeded the uptake in muscle by a factor 6 (respectively 9.2*108 ± 2.6*108 and 1.5*108 ± 3.1*106 111In atom counts, tumor to muscle ratio (T/M): 5.95 ± 0.39).
In vivo biodistribution of hybrid-Cy5-Ac-TZ14011. The biodistribution was evaluated via A) in vivo SPECT imaging (L= liver, K= kidney, M= muscle and T = tumor (encircled in red)) and B) by assessment of the atom counts per gram of tissue using gamma counting (radiodetection after injection of 111In-hybrid-Cy5-Ac-TZ14011 (red bars) or 111In(165Ho)-hybrid-Cy5-Ac-TZ14011 (purple bars)) or ICP-MS after injection of 165Ho-hybrid-Cy5-Ac-TZ14011 (blue bars). C) Overview of the percentage of the injected dose per gram of tissue (%ID/g) of 111In-hybrid-Cy5-Ac-TZ14011 (111In-hybrid), 111In(165Ho)-hybrid-Cy5-Ac-TZ14011 (111In(165Ho)-hybrid) and 165Ho-hybrid-Cy5-Ac-TZ14011 (165Ho-hybrid).
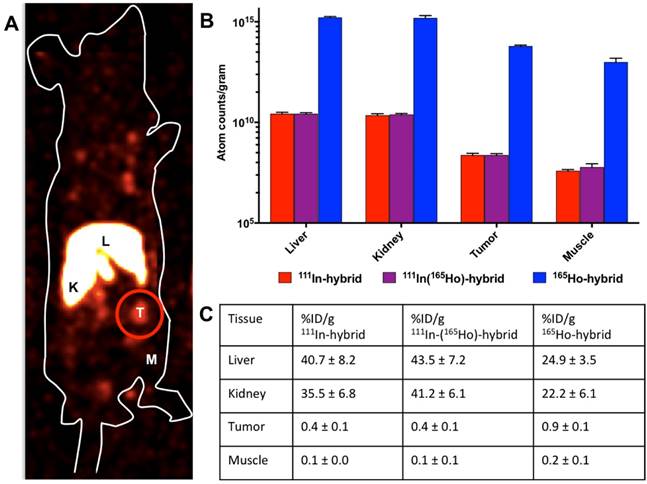
Radioisotope-based assessment of samples that contained 111In(165Ho)-hybrid-Cy5-Ac-TZ14011 (tracer labeling with 111In, followed by saturation with 7.5*1015 165Ho atoms) gave highly similar results (Figure 2B, red bars). The highest level of uptake was also found in the liver and kidneys (respectively 1.4*1011 ± 1.9*1010 and 9.6*1010 ± 9.69*1010 111In atom counts/gram tissue), with lower, but significant, uptake levels in the tumor (Figure 2B; 9.2*108 ± 2.2*108 111In atom counts/gram tissue) and a T/M ratio of 4.38 ± 1.51.
When evaluating the 165Ho isotope content in the tissue samples (165Ho-hybrid-Cy5-Ac-TZ14011 saturated with 7.5*1015 165Ho atoms; Figure 2B, blue bars), a similar trend in the distribution was seen with a comparable T/M ratio (5.85 ± 1,40). Overall the differences between the T/M ratio's were not statistically significant and a strong correlation was observed between 111In-hybrid-Cy5-Ac-TZ14011 and 111In(165Ho-)hybrid-Cy5-Ac-TZ14011 (R2= 0.99627) as well as between 111In(165Ho-)hybrid-Cy5-Ac-TZ14011 and 165Ho-hybrid-Cy5-Ac-TZ14011 (R2 = 0.99955). The higher count rates could be distributed to the saturated conditions in which 165Ho was applied. Hereby, the 104 fold difference in intensity between the tracer labeling (111In) and the 165Ho saturated condition was in agreement with the labeling-ratio, which was also 1:104 (111In:165Ho).
165Ho-based LA-ICP-MS imaging vs. fluorescence imaging in excised tissue samples
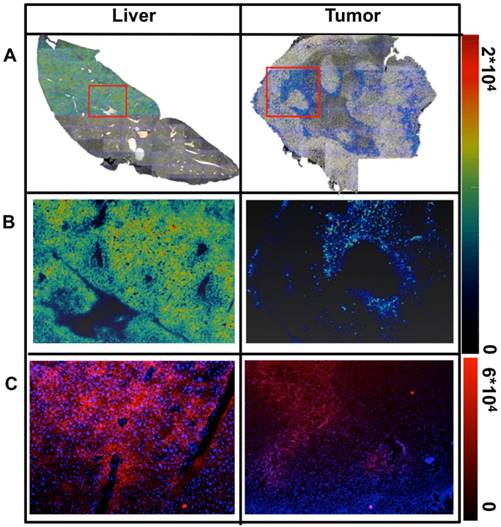
Next to the %ID/g evaluation, the distribution of 165Ho-hybrid-Cy5-Ac-TZ14011 was visualized in 5μm thick fresh frozen tissue sections, via both LA-ICP-MS imaging (Figure 3A and B) and fluorescence microscopy (Figure 3C). A homogeneous distribution was observed in liver tissue, while for tumor tissue a heterogeneous distribution was observed with both imaging techniques (max intensity 2*104 for LA-ICP-MS and 6*104 for fluorescence imaging).
Ex vivo analysis of the distribution of hybrid-Cy5-Ac-TZ14011 in tissue sections. A) Color overlay of the 165Ho-signal intensity map as obtained using LA-ICP-MS on standard photographic images of the whole tissue section (max intensity: 2*104 165Ho atoms). Individual images were obtained using a 2.5x magnification, the complete overview was obtained after stitching of these images. B) More detailed 165Ho signal intensity map of the area within the red rectangle. The linearly scaled color bar on the right presents the 165Ho signal intensity. C) Fluorescence images of consecutive tissue sections at 5x magnification showing a more detailed staining pattern (max pixel intensity: 6*104). Cell nuclei were stained blue using DAPI containing Proline Gold mounting medium.
Discussion
The hybrid LA-ICP-MS-fluorescence-radioactivity approach enabled a critical intra-methodological evaluation of ICP-MS-based diagnostics in relation to fluorescence- and radioisotope-based methods. The use of a single isotope containing imaging label preserved the receptor affinity and allowed for detailed in vitro, in vivo and ex vivo analysis using the different modalities. This direct comparison revealed not only the strengths but also the weaknesses of ICP-MS-based diagnostics, thereby providing insight into how ICP-MS-based analysis may best fit within the realm of theranostics.
In the current theranostic setting interchanging of isotopes empowers both diagnostic and therapeutic applications, while using the same tracer. Ho-based theranostic approaches are increasing and insight in to their function could possibly be enhanced further through the use of MS-compatible 165Ho-isotopes.[8,12] Uniquely, Ho-isotopes are also MRI compatible, allowing their use in a combined SPECT and MRI approach.[29] This feature could be explored in a future extension of the described approach.
When using CXCR4-overexpressing cells, a single isotope was shown to be sufficient for determination of the KD using MS-cytometry. However, the count rates obtained with mass-cytometry were a 17-fold lower than the count rates obtained with fluorescence-based flow cytometry (Figure 1A). Although the 165Ho-related background signal was almost nonexistent, these low count rates induced a higher variance. At first glance, signal amplification via functionalization with a multiple-chelate-containing imaging label would provide the necessary increase in mass-cytometry signal. However, the other studies presented using LA-ICP-MS or ICP-MS analysis of tissue (extracts) do not indicate that there is a requirement to enhance the MS-signal intensity. This suggests that improvements in the ion transmission and detector sensitivity of MS-cytometry provide the most straightforward approaches to improve sensitivity. Such improvements would overcome the need to introduce “large“ labels that would certainly disrupt the delicate balance between the affinity of the Ac-TZ14011 targeting moiety and the size of the label.[20] This is highly relevant as even antibodies with and without a polymeric MS-label revealed that, a 2-27% reduction in signal intensity for the antibody that was functionalized with the polymeric label, even while the target specificity of the antibodies was retained.[1]
The results from the direct comparison between the T/M ratio obtained with the radioisotope-based approach and ICP-MS analysis showed the possible utility of ICP-MS in this application (Figure 2). However, the methodology used for tissue destruction was of great importance for the effectiveness of the ICP-MS analysis of liver and kidney specimens.[28,29] Possibly isotope recovery using small tissue fragments can be further improved by implementing microwave-based digestion instead of hot plate-based chemical extraction.
In cells, both fluorescence- and LA-ICP-MS imaging enabled discrimination between CXCR4-overexpressing and non-overexpressing cells. Where fluorescence imaging can be hindered by e.g. autofluorescence and signal scattering [14, 24, 30], LA-ICP-MS imaging is not. In tissue 165Ho-based MS-imaging showed intensity differences between tissue types but also heterogeneous distribution within the tissue sections itself (Figure 3). The 20 μm beam-size used in LA-ICP-MS imaging only enabled visualization of the entire cell. With fluorescence (confocal) microscopy a resolution of approximately 200 nm can be obtained, which enabled visualization of organelles such as lysosomes within a cell (Figure 1 and Figure SI1). Ongoing efforts on improving the (spatial) resolution and detection sensitivity of MS-imaging might help bring these resolutions closer together.[31] Using this hybrid approach, the radioactive signature could also be exploited for autoradiography purposes, providing yet another link between the different methods.
The combined use of a lanthanide isotope, a radioisotope and a fluorescent dye has allowed us to cross-validate mass-cytometry, solution based LA-ICP-MS and LA-ICP-MS imaging findings. The increasing availability of the chelate (or hybrid) labeled targeting vectors provides ground for future expansion of this approach. The evaluation of multiple receptors in one sample (multiplexing), via the use of multiple MS-isotopes, would even enable assessment (and validation) of multiple targets in one sample. Selection of the receptor with the highest expression level could then even be used to tailor imaging and/or therapeutic approaches, to the expression profile of a lesion in one specific patient.[22]
Conclusions
Lanthanide-isotope chelation expands the scope of hybrid tracers to include MS-based analytical tools such as mass-cytometry, ICP-MS and LA-ICP-MS imaging. In contradiction to common expectations, MS detection using a single chelate imaging agent was shown to be feasible, enabling direct link with nuclear medicine based theranostic approaches.
Supplementary Material
Supplementary methods and figure.
Acknowledgements
We thank M.M. Welling and M.N. van Oosterom for their assistance with the acquisition and processing of the SPECT images, and C.M. de Korne for her assistance with the acquisition of the fluorescence images of the tissues. This research was financially supported by a Koningin Wilhelmina Fonds (KWF) translational research award (Grant No. PGF 2009-4344), a Netherlands Organization for Scientific Research STW-VIDI grant (Grant No. STW BGT11272), and a European Research Council under the European Union' s Seventh Framework Program (FP7/2007-2013) grant (Grant No. 2012-306890) and the 2015-2016 Post-Doctoral Molecular Imaging Scholar Program Grant granted by the Society of Nuclear Medicine and Molecular imaging (SNMMI) and the Education and Research Foundation for Nuclear Medicine and Molecular Imaging. The authors acknowledge Teledyne CETAC Technologies and the Flemish Research Foundation (FWO) for financial and/or logistic support. Stijn J. M. Van Malderen is a PhD fellow of the FWO.
Competing Interests
The authors have declared that no competing interest exists.
References
1. Giesen C, Wang HA, Schapiro D, Zivanovic N, Jacobs A, Hattendorf B. et al. Highly multiplexed imaging of tumor tissues with subcellular resolution by mass cytometry. Nat Methods. 2014;11:417-22
2. Bendall SC, Nolan GP, Roederer M, Chattopadhyay PK. A deep profiler's guide to cytometry. Trends Immunol. 2012;33:323-32
3. Angelo M, Bendall SC, Finck R, Hale MB, Hitzman C, Borowsky AD. et al. Multiplexed ion beam imaging of human breast tumors. Nat Med. 2014;20:436-42
4. Clarke GM, Zubovits JT, Shaikh KA, Wang D, Dinn SR, Corwin AD. et al. A novel, automated technology for multiplex biomarker imaging and application to breast cancer. Histopathology. 2014;64:242-55
5. Levenson RM, Borowsky AD, Angelo M. Immunohistochemistry and mass spectrometry for highly multiplexed cellular molecular imaging. Lab Invest. 2015;95:397-405
6. Majonis D, Herrera I, Ornatsky O, Schulze M, Lou X, Soleimani M. et al. Synthesis of a functional metal-chelating polymer and steps toward quantitative mass cytometry bioassays. Anal Chem. 2010;82:8961-9
7. Sousa AA, Aronova MA, Wu H, Sarin H, Griffiths G, Leapman RD. Determining molecular mass distributions and compositions of functionalized dendrimer nanoparticles. Nanomedicine (Lond). 2009;4:391-9
8. Volkert WA, Hoffman TJ. Therapeutic radiopharmaceuticals. Chem Rev. 1999;99:2269-92
9. Bunschoten A, van Willigen DM, Buckle T, van den Berg NS, Welling MM, Spa SJ. et al. Tailoring Fluorescent Dyes To Optimize a Hybrid RGD-Tracer. Bioconjug Chem. 2016;27:1253-8
10. Kuil J, Buckle T, Oldenburg J, Yuan H, Borowsky AD, Josephson L. et al. Hybrid peptide dendrimers for imaging of chemokine receptor 4 (CXCR4) expression. Mol Pharm. 2011;8:2444-53
11. Lou X, Zhang G, Herrera I, Kinach R, Ornatsky O, Baranov V. et al. Polymer-based elemental tags for sensitive bioassays. Angew Chem Int Ed Engl. 2007;46:6111-4
12. Chatalic KL, Kwekkeboom DJ, de Jong M. Radiopeptides for Imaging and Therapy: A Radiant Future. J Nucl Med. 2015;56:1809-12
13. Mesguich C, Zanotti-Fregonara P, Hindie E. New Perspectives Offered by Nuclear Medicine for the Imaging and Therapy of Multiple Myeloma. Theranostics. 2016;6:287-90
14. van Leeuwen F.W. vdPHG. Surgical Guidance in Prostate Cancer: "From Molecule to Man" Translations. Clinical Cancer Research. 2015
15. Smits ML, Nijsen JF, van den Bosch MA, Lam MG, Vente MA, Huijbregts JE. et al. Holmium-166 radioembolization for the treatment of patients with liver metastases: design of the phase I HEPAR trial. J Exp Clin Cancer Res. 2010;29:70
16. Philipp-Abbrederis K, Herrmann K, Knop S, Schottelius M, Eiber M, Luckerath K. et al. In vivo molecular imaging of chemokine receptor CXCR4 expression in patients with advanced multiple myeloma. EMBO Mol Med. 2015;7:477-87
17. Vag T, Gerngross C, Herhaus P, Eiber M, Philipp-Abbrederis K, Graner FP. et al. First Experience with Chemokine Receptor CXCR4-Targeted PET Imaging of Patients with Solid Cancers. J Nucl Med. 2016;57:741-6
18. Balkwill F. The significance of cancer cell expression of the chemokine receptor CXCR4. Semin Cancer Biol. 2004;14:171-9
19. Mukherjee D, Zhao J. The Role of chemokine receptor CXCR4 in breast cancer metastasis. Am J Cancer Res. 2013;3:46-57
20. Kuil J, Buckle T, van Leeuwen FW. Imaging agents for the chemokine receptor 4 (CXCR4). Chem Soc Rev. 2012;41:5239-61
21. Buckle T, Brouwer OR, Valdes Olmos RA, van der Poel HG, van Leeuwen FW. Relationship between intraprostatic tracer deposits and sentinel lymph node mapping in prostate cancer patients. J Nucl Med. 2012;53:1026-33
22. Buckle T, Kuil J, van den Berg NS, Bunschoten A, Lamb HJ, Yuan H. et al. Use of a single hybrid imaging agent for integration of target validation with in vivo and ex vivo imaging of mouse tumor lesions resembling human DCIS. PLoS One. 2013;8:e48324
23. van den Berg NS, Brouwer OR, Klop WM, Karakullukcu B, Zuur CL, Tan IB. et al. Concomitant radio- and fluorescence-guided sentinel lymph node biopsy in squamous cell carcinoma of the oral cavity using ICG-(99m)Tc-nanocolloid. Eur J Nucl Med Mol Imaging. 2012;39:1128-36
24. van Leeuwen FW, Valdes-Olmos R, Buckle T, Vidal-Sicart S. Hybrid surgical guidance based on the integration of radionuclear and optical technologies. Br J Radiol. 2016;89:20150797
25. Luker K, Gupta M, Luker G. Bioluminescent CXCL12 fusion protein for cellular studies of CXCR4 and CXCR7. Biotechniques. 2009;47:625-32
26. Branderhorst W, Vastenhouw B, Beekman FJ. Pixel-based subsets for rapid multi-pinhole SPECT reconstruction. Phys Med Biol. 2010;55:2023-34
27. van Oosterom MN, Kreuger R, Buckle T, Mahn WA, Bunschoten A, Josephson L. et al. U-SPECT-BioFluo: an integrated radionuclide, bioluminescence, and fluorescence imaging platform. EJNMMI Res. 2014;4:56
28. Niazi SB, Littlejohn D, Halls DJ. Rapid partial digestion of biological tissues with nitric acid for the determination of trace elements by atomic spectrometry. Analyst. 1993;118:821-5
29. van de Maat GH, Seevinck PR, Elschot M, Smits ML, de Leeuw H, van Het Schip AD. et al. MRI-based biodistribution assessment of holmium-166 poly(L-lactic acid) microspheres after radioembolisation. Eur Radiol. 2013;23:827-35
30. Chin PT, Beekman CA, Buckle T, Josephson L, van Leeuwen FW. Multispectral visualization of surgical safety-margins using fluorescent marker seeds. Am J Nucl Med Mol Imaging. 2012;2:151-62
31. van Malderen SJM MA, Sharp BL, VanHaeke F. Recent developments in the design of rapid response cells for laser ablation inductively-coupled plasma-mass spectrometry and their impact on bioimaging applications. J Anal At Spectrom. 2016;31:423-39
Author contact
![]() Corresponding author: Tessa Buckle, Interventional Molecular Imaging laboratory, Department of Radiology, Leiden University Medical Center, Albinusdreef 2, 2300 RC, Leiden, the Netherlands. E-mail: t.bucklenl.
Corresponding author: Tessa Buckle, Interventional Molecular Imaging laboratory, Department of Radiology, Leiden University Medical Center, Albinusdreef 2, 2300 RC, Leiden, the Netherlands. E-mail: t.bucklenl.