Theranostics
13.3
Impact Factor
- Current Issue
- Advance Articles
- Volume 16; 2026
- Volume 15; 2025
- Volume 14; 2024
- Volume 13; 2023
- Volume 12; 2022
- Archive
- Cover Images
- Cover Suggestion
- Special Issues
Top
Introduction
Materials and Methods
Results and Discussion
Conclusions
Abbreviations
Supplementary Material
Acknowledgements
References
Introduction
Materials and Methods
Results and Discussion
Conclusions
Abbreviations
Supplementary Material
Acknowledgements
References
International Journal of Biological Sciences
International Journal of Medical Sciences
 Global reach, higher impact

Theranostics 2016; 6(9):1378-1392. doi:10.7150/thno.15156 This issue Cite
Research Paper
Phenylboronic Acid-Mediated Tumor Targeting of Chitosan Nanoparticles
Xin Wang1,2, Huang Tang1, Chongzhi Wang1, Jialiang Zhang1, Wei Wu1, Xiqun Jiang1 ![]()
1. Department of Polymer Science & Engineering, College of Chemistry & Chemical Engineering, Nanjing University, Nanjing, 210093, P. R. China.
2. Engineering Research Center for Biomedical Materials, School of Life Science, Anhui University, Hefei, 230601, P. R. China.
Received 2016-2-1; Accepted 2016-4-20; Published 2016-6-15
Citation:
Wang X, Tang H, Wang C, Zhang J, Wu W, Jiang X. Phenylboronic Acid-Mediated Tumor Targeting of Chitosan Nanoparticles. Theranostics 2016; 6(9):1378-1392. doi:10.7150/thno.15156. https://www.thno.org/v06p1378.htm
Other stylesAbstract

The phenylboronic acid-conjugated chitosan nanoparticles were prepared by particle surface modification. The size, zeta potential and morphology of the nanoparticles were characterized by dynamic light scattering, zeta potential measurement and transmission electron microscopy. The cellular uptake, tumor penetration, biodistribution and antitumor activity of the nanoparticles were evaluated by using monolayer cell model, 3-D multicellular spheroid model and H22 tumor-bearing mice. The incorporation of phenylboronic acid group into chitosan nanoparticles impart a surface charge-reversible characteristic to the nanoparticles. In vitro evaluation using 2-D and 3-D cell models showed that phenylboronic acid-decorated nanoparticles were more easily internalized by tumor cells compared to non-decorated chitosan nanoparticles, and could deliver more drug into tumor cells due to the active targeting effect of boronic acid group. Furthermore, the phenylboronic acid-decorated nanoparticles displayed a deeper penetration and persistent accumulation in the multicellular spheroids, resulting in better inhibition growth to multicellular spheroids than non-decorated nanoparticles. Tumor penetration, drug distribution and near infrared fluorescence imaging revealed that phenylboronic acid-decorated nanoparticles could penetrate deeper and accumulate more in tumor area than non-decorated ones. In vivo antitumor examination demonstrated that the phenylboronic acid-decorated nanoparticles have superior efficacy in restricting tumor growth and prolonging the survival time of tumor-bearing mice than free drug and drug-loaded chitosan nanoparticles.
Keywords: Chitosan nanoparticles, phenylboronic acid, 3-D multicellular spheroids, antitumor.
Introduction
In recent years, many kinds of nanocarriers made from natural or synthetic polymers have been used to change the pharmacokinetic profile of loaded anticancer drugs, improve drug's chemotherapeutic efficacy and reduce adverse effects, based on the enhanced permeation and retention (EPR) effect [1-5]. Compared to many other natural polymers, chitosan (CS) is a positively charged biopolymer and has a primary driving force for the cellular binding and uptake as well as subsequent endosomal escape [6, 7]. However, the exorbitant charge of CS is concomitant with the formation of aggregates via adsorbed plasma proteins and erythrocytes, reducing the CS nanocarriers' circulation time [8-10]. Moreover, the penetration of CS-based nanoparticles in solid tumor was significantly restricted due to the strong interactions between the positively charged CS and the excessively generated extracellular matrix (ECM) in tumor site [11, 12].
On the other hand, many types of active tumor-targeted ligands such as RGD peptide, folic acid and transferrin have been decorated at the nanoparticle's surface to enhance the drug accumulation in tumor areas [13-17]. Although the complicated tumor microenvironment and surface properties of nanocarriers compromise ligand's capabilities, the nanoparticle targeting toward tumor site is still improved significantly [18-20]. Thus, the development of active tumor-targeted drug delivery systems are highly important. It has been shown that sialic acid groups are over-expressed on the surface of most malignant carcinoma cells [21], providing a potential target site by a boronic acid group, which is liable to react with the sialic acid residues to form annular boronate ester [22, 23]. Recently, it has been demonstrated that phenylboronic acid-rich nanoparticles can remarkably enhance the tumor targeting delivery of antitumor agents [24-26].
As an in vitro tumor-mimic model, 3-D cell culture systems such as multicellular spheroids (MCS) are often used to examine intratumoral drug delivery since the cells in 3-D culture models are more closely similar those in vivo situation, including gradient microenvironments such as oxygen, acidity, and glucose [27, 28]. It was found that 3-D culture cell models can produce compact extracellular matrix (ECM), which is a dominant barrier to nanoparticle penetration in tumor tissues [29]. Furthermore, large MCS are composed of three different regions with heterogeneous cells [30]. Thus, MCS offer an appropriate model to optimize nanoparticulate drug delivery systems.
In present work, the 4-carboxyphenylboronic acid (CPBA) was used to modify the surface of chitosan nanoparticles (CS NPs), to give phenylboronic acid-decorated nanoparticles (PBA-CS NPs). The incorporation of negatively charged phenylboronic acid group onto the surface of positively charged CS nanoparticles will impart CS nanoparticles a zwitterionic surface and reduce their surface potential. More importantly, phenylboronic acid decoration can enhance the targeting ability of nanoparticles to cancer cells and prolong the retention time in tumor sites due to the interaction between over-expressed sialic acid residues in cancer cells and phenylboronic acid groups. With loading doxorubicin (DOX) into the nanoparticles, the spatiotemporal distributions and antitumor effects of CS NPs with and without phenylboronic acid decoration were evaluated in 2-D culture monolayer cells, 3-D culture multicellular spheroids and H22 tumor-bearing mice.
Materials and Methods
Materials
Low molecular weight chitosan (Mn = 5000) and Doxorubicin hydrochloride (DOX) were obtained from Meilun Biotechnology Company (Dalian, China). Glutaric dialdehyde solution (25%), Fluorescein isothiocyanate (FITC), NIR-797-isothiocyanate and poly(2-hydroxyethyl methacrylate) (polyHEMA) were purchased from Sigma Chemical Co.. 1-(3-Dimethylaminopropyl)-3-ethylcarbodiimide hydrochloride (EDC×HCl), 4-carboxyphenylboronic acid (CPBA), Ethylene diamine tetraacetic acid, N-hydroxysuccinimide (NHS) and 1-(4,5-dimethylthiazol-2-yl)-3,5-diphenyl-formazan (MTT) were obtained from J&K. Human neuroblastom cancer cell line (SH-SY5Y), murine hepatic cancer cell line (H22) and human liver carcinoma cell line (HepG2) were obtained from KeyGEN BioTECH (Nanjing, China). Male ICR mice (18-22 g) were obtained from Nanjing University of Chinese Medicine (Nanjing, China).
Preparation of Pure Chitosan Nanoparticles
The pure chitosan nanoparticles (CS NPs) were prepared based on our group's previous work: 30 mg chitosan and 5 mg EDTA was added into 3 mL of water under stirring [31, 32]. After then, 6 mL of ethanol was added to give a cloudy solution, indicating the formation of nanoparticles. To this solution, 30 μL of glutaraldehyde (25%) was added as a crosslinker by the reaction between aldehyde groups and amino groups of nanoparticles. After cross-linking, the nanoparticles were centrifuged at 1×10⁴ rpm for 20 min and the sediment was re-dispersed in 3 mL of distilled water to give the pure CS NPs.
Conjugation of 4-Carboxyphenylboronic Acid and CS NPs
A solution of 4-carboxyphenylboronic acid (11.2 mg) in 1 mL of anhydrous DMSO was reacted with EDC×HCl (15.5 mg) and NHS (9.3 mg) for 30 min, and then added into 5 mL of CS NPs solution and stirred at 37 oC for 24 h. Finally, the phenylboronic acid-decorated CS NPs (PBA-CS NPs) were obtained by dialysis against distilled water for 48 h to remove un-reacted 4-carboxyphenylboronic acid. The modification ratio of 4-CPBA was measured using ninhydrin reaction. 1 mL of CS NPs or 1 mL of PBA-CS NPs was mixed with 1mL of 1% ninhydrin solution and 1 mL of sodium acetate buffer solution (pH 6.0). The mixture was heated at 100 oC for 20 min to accelerate the reaction between ninhydrin and amino groups of CS NPs or PBA-CS NPs. The mixture was then diluted 3-fold with 60% ethanol solution and the absorbance was measured at 570 nm by a microplate system (Molecule Devices, USA).
Preparation of Drug-Loaded Nanoparticles
The drug-loaded CS NPs and PBA-CS NPs were prepared as follows: Firstly, a certain amount of DOX was dissolved in 3 mL of CS NPs and PAB-CS NPs solutions, respectively, and the mixture was stirred overnight in the dark. Next, the mixed solution was centrifuged at 1×10⁴ rpm for 15 min to remove those un-loaded drug and the precipitate was re-dispersed in the distilled water. The DOX-loaded CS NPs were designed into CS-DOX NPs and DOX-loaded PBA-CS nanoparticles were named as PBA-CS-DOX NPs. The concentration of un-loaded DOX was measured by UV-Vis spectrophotometer at 481 nm. The sediment was dried and weighted. The drug loading content (DLC) and the drug loading efficiency (DLE) were calculated as follows:
DLC (%) = (Weight of drug in NPs)/(Weight of the NPs)×100%
DLE (%) = (Weight of drug in NPs)/(Weight of the feeding drug)×100%
In Vitro Drug Release
The DOX release profiles of CS-DOX NPs and PBA-CS-DOX NPs were evaluated in phosphate buffer solution (PBS) at different pH values (5.5, 6.5 and 7.4, respectively). 1.0 mL of CS-DOX NPs and PBA-CS-DOX NPs suspension was transferred into a dialysis tube (MWCO 14 kDa) and immersed into PBS (5 mL). The release system was continuously shaken (100 rpm) at 37 oC. At desired time intervals, all release solution was taken out for content measurement and replenished with 5 mL of fresh PBS. The amount of released DOX was measured by a microplate system (Molecule Devices, USA) at an excitation wavelength of 480 nm and an emission wavelength of 590 nm.
Characterization of Prepared Nanoparticles
Hydrodynamic diameter of these nanoparticles were studied by dynamic light scattering (DLS, BI9000AT, Brookheaven Instruments Inc., USA). Nanoparticles were adjusted to a proper concentration and measurements were triplicated. The zeta potential of these nanoparticles was measured with Zetaplus (Brookhaven Instruments Corporation, USA). All analyses were repeated three times and the results were the average of three runs. The morphology of the prepared nanoparticles was investigated by transmission electron microscopy (TEM) (JEOL TEM-100, Japan). A drop of nanoparticle solution was placed onto copper grill and air-dried for 10 min at room temperature.
Preparation of FITC-Conjugated CS NPs and PBA-CS NPs
Briefly, 0.5 mg FITC was dissolved in 0.5 mL of anhydrous DMSO. FITC solution (0.1 mL) was added into 1 mL of nanoparticle solution and stirred overnight. After that, the mixture was centrifuged at 1×10⁴ rpm for 10 min. The precipitate was re-dispersed in the distilled water.
Co-localization of FITC-Labeled Nanoparticles with SH-SY5Y Cells
SH-SY5Y cells were inoculated into a cell culture plate (1×10⁵ cells/well) and cultured with RPMI 1640 medium for 24 h. SH-SY5Y cells were then co-cultured with 100 nM Lyso-Tracker Red for 0.5 h at 37 °C. After that, 100 μL of FITC-label CS NPs and PBA-CS NPs were added into the well, respectively, and incubated with the cells for another 4 h at 37 oC. The cells were then washed with PBS and fixed with paraformaldehyde (4%) before observed by LSM 710 (Zeiss, Germany).
In Vitro Cellular Uptake
SH-SY5Y cells (human neuroblastoma cell line) were cultured in RPMI 1640, supplemented with 10% FBS, 1% penicillin (100 U/mL) and streptomycin (0.1 mg/mL). SH-SY5Y cells were co-cultured with free DOX (4 μg/mL), CS-DOX NPs (4 μg/mL eq.) and PBA-CS-DOX NPs (4 μg/mL eq.) for 4 h at 37 oC. The cells were then washed twice with PBS, fixed with 4% paraformaldehyde and stained with Hoechst 33258 before confocal laser scanning microscope observing (FluoView TM FV1000, Olympus). Cellular uptake of H22 cells and HepG2 cells were also evaluated as the same method.
Time-Dependent Uptake Amount of DOX-Loaded Nanoparticles
SH-SY5Y cells were inoculated into a 6-well cell culture plate and co-incubate with free DOX (4 μg/mL), CS-DOX NPs (4 μg/mL eq.) and PBA-CS-DOX NPs (4 μg/mL eq.) for 4 h, respectively. Cells were then washed twice with PBS and collected, the fluorescence intensity of DOX in each sample was measured by flow cytometry. The quantitative analysis of H22 cells and HepG2 cells were also evaluated as the same method.
Cytotoxicity Assay
SH-SY5Y cells seeded in 96-well plates (5×10³ cells/well) were treated with a series of concentration of empty CS NPs, empty PBA-CS NPs, free DOX, CS-DOX NPs and PBA-CS-DOX NPs for 48 h, respectively. After then, 20 μL of MTT solution (5 mg/mL in PBS solution) was added to each well and incubated for another 4 h. After that, the culture medium was removed and 150 μL of dimethyl sulfoxide was added to dissolve crystals formed by living cells. The absorbance of each well was measured at 490 nm by a microplate reader. The cytotoxicity of H22 cells and HepG2 cells were also evaluated as the same method.
Culture of SH-SY5Y MCS
3-D MCS were prepared based on our previous work [27, 28]. 5 mL of polyHEMA solution (15 mg/mL) was added in cell culture flasks and air-dried for 24 h to give a thin layer of polyHEMA hydrogel. The polyHEMA coated cell culture flasks were sterilized by a UV lamp for 4 h before cell culture. 4×10⁵ cells in 4 mL of cell culture medium were added in a polyHEMA coated culture flask and cultured at 37 oC for a week. The RPMI 1640 medium was replaced every day. After a week, 3-D MCS with a diameter around 250-350 μm will be formed spontaneously.
Penetration and Accumulation in MCS
The penetration and accumulation of free DOX, FITC-labeled CS-DOX NPs and PBA-CS-DOX NPs within MCS were determined by CLSM. For each experiment, ~20 spheroids with the diameter of about 300 μm were collected and co-cultured with appropriate concentrations of free DOX, FITC-labeled CS-DOX NPs and PBA-CS-DOX NPs at 37 oC. At different time (1 h, 2 h, 4h, 8 h and 12 h), the MCS were collected and washed with PBS solution for three times before investigating with LSM 710. After the end of the observation, each sample was re-dispersed in fresh culture medium and allowed for another 24 h incubation. The MCS were then observed under CLSM again to investigate the changes of the fluorescence intensity of DOX. The semi-quantitative analysis of mean DOX and FITC intensity in each MCS was calculated using ZEN 2008 program. All pixels' fluorescence intensity were calculated and normalized by the area.
Growth Suppression in MCS
The inhibition effect of free DOX, CS NPs, PBA-CS NPs, CS-DOX NPs and PBA-CS-DOX NPs to MCS were then measured. The MCS with a diameter of 250 μm were divided into 6 groups (6 MCS/group) and co-cultured with free DOX (8 μg/mL), CS NPs, PBA-CS NPs, CS-DOX NPs (8 μg/mL eq.) and PBA-CS-DOX NPs (8 μg/mL eq.), respectively, at 37 oC for 7 days. The MCS were observed under an optical microscope with a 10× objective every day and the MCS' diameter was measured.
Real-Time NIRF Imaging
NIR 797-labeled nanoparticles were prepared as follows: Firstly, 0.5 mg of NIR-797-isothiocyanate was dissolved in 0.5 mL of DMSO and added to 3 mL of CS NPs and PBA-CS NPs solution, respectively. Next, the mixture was stirred for 10 h at 37 oC in the dark. After that, the solution was centrifuged at 1×10⁴ rpm for 15 min and the precipitate was re-dispersed in 3 mL of distilled water to give NIR-797-labeled nanoparticles. All these in vivo experiments were proceeded under the guidelines set by the Animal Care Committee at Drum Tower Hospital. Each mouse was injected with 5×10⁵ murine H22 cells in 0.1 mL saline at the left limb armpits of mice. To the H22 tumor-bearing mice, NIR-797 labeled CS NPs and PBA-CS NPs were injected via tail vein, respectively, and the NIRF images were obtained by a MaestroTM in vivo imaging system (CRi, USA) at different times. The mice were sacrificed at the end of observation (120 h after injection), major organs (tumor, heart, spleen, liver, kidneys, lungs, intestine, brain, and stomach) were quickly excised and imaged to investigate the tissue accumulation of nanoparticles.
Penetration in Tumor Tissues
The H22 tumor-bearing mice were injected with FITC-labeled CS NPs and PBA-CS NPs while the subcutaneously transplanted tumor volume reached an average size of about 200 mm3. These mice were sacrificed after 24 h injected and tumors were quickly excised. Tumors were washed with PBS (7.4) for three times and immersed in paraformaldehyde (4%) solution for 6 h at 4 oC. Afterwards, tumors were co-incubated with sucrose solution (25%) for overnight and frozen in O.C.T. embedding medium at -80 oC for 20 min. Tumors were then cut into 6 μm sections for further use. The sections were rehydrated in Triton X-100 solution (0.1% in PBS) for 15 min and incubated with BSA (3% in PBS) solution for 60 min at 37 ◦C. After then the sections were incubated with a primary monoclonal antibody (1:400, rat monoclonal anti-mouse CD31, BD Pharmingen, San Jose, California) for 60 min in a humidified chamber at 37 ◦C. Next, the sections were washed with tween 20 (0.05% in PBS v/v) for 5 min and then counterstained with an Alexa 594 conjugated donkey anti-rat secondary antibody (1:1000, Molecular Probes, Eugene, OR) and an Alex 488 conjugated streptavidin (1:1000; Invitrogen, Camarillo, CA) in a humidified chamber at 37 ◦C in the dark for 0.5 h. At last, the tumor sections were washed with PBS (7.4) for three times and stained with DAPI. The sections were then observed with a LSM 710.
In Vivo Biodistribution
When the subcutaneously transplanted tumor reached an average size of about 200 mm3, the mice were then randomly divided into 13 groups (3 mice/group). CS-DOX NPs and PBA-CS-DOX NPs were intravenous injected into H22 tumor-bearing mice at an equivalent DOX dose of 4 mg/kg. The mice were sacrificed on the predetermined times, and major organs (spleen, heart, kidney, liver, lung and tumor) were excised and weighed. Each tissue was then immersed in 5 mL of extract liquor (70% ethanol with 0.3 N HCl) and drastically homogenized for 3 min. The mixture was centrifuged at 1×10⁴ rpm for 5 min, the supernatant was collected and the DOX concentration was measured using a fluorescence spectrometer.
In Vivo Antitumor Effect
When the subcutaneously transplanted tumor reached an average size of about 70-80 mm3, the mice were then divided into 6 groups (10 mice/group), free DOX (6 mg/kg), CS-DOX NPs (6 mg/kg eq.), PBA-CS-DOX NPs (6 mg/kg eq.) and empty nanoparticles were intravenous injected into the mice, respectively, and this day was set as “day 1”. All the mice were received single injection. Saline injected mice were set as a control group. At day 7 post-injection, mice were sacrificed and the tumor mass was collected, imaged and weighed. The tumor size was measured using a slide caliper every day and the volume (V) was calculated as follows:
V = d2×D/2,
D: the longest size of the tumor in mm; d: the shortest size of the tumor in mm.
Statistical Analysis
Student's t-test was employed to determine the difference of tumor inhibition between the mice administrated with the DOX, CS-DOX NPs and PBA-CS-DOX NPs, and P values less than 0.05 were considered statistically significant.
Results and Discussion
Preparation of CS NPs and PBA-CS NPs and Drug Loading
CS NPs were prepared by the self-assembly of CS and EDTA under nonsolvent (ethanol)-aided counterion complexation [31, 32]. The nanoparticles were then cross-linked by glutaraldehyde solution (25%), and then EDTA was eliminated by means of dialysis against distilled water, to give the pure CS NPs. After that, 4-carboxyphenylboronic acid (CPBA) was reacted with the amino groups in chitosan chains to give boronic acid-decorated nanoparticles (PBA-CS NPs), as shown in Figure 1a. To examine the CPBA decoration, the 1H NMR spectra of CPBA, CS NPs and PBA-CS NPs in d6 DMSO were measured, and show in Figure S1. Two peaks at 7.8 and 8.2 ppm (b) assigned to the protons of benzene ring were observed in the 1H NMR spectrum of CPBA and PBA-CS NPs while the single peak at 13 ppm (a) assigned to the protons of carboxyl group was observed in CPBA's spectrum but disappeared in PBA-CS NPs' spectrum, confirming that the CPBA was successfully decorated on the surface of CS NPs. The degree of modification with 4-CPBA is calculated to be 32.3% by comparing the amino group content of CS NPs and PBA-CS NPs using ninhydrin reaction method (Figure S2).
Then the anticancer drug, DOX was loaded into CS NPs and PBA-CS NPs at two different pH values (7.4 and 8.5), affording CS-DOX NPs and PBA-CS-DOX NPs. The drug loading efficiency (DLE) and loading content (DLC) of CS NPs and PBA-CS NPs at different pH values were investigated. As shown in Table S1, when pH changed from 7.4 to 8.5, the drug loading content in PBA-CS NPs increased from 7.3% to 13.7%. In addition, the DLC and DLE of PBA-CS NPs are much higher than those of CS NPs at both pH values. This result suggests that there is an electrostatic interaction between DOX and PBA-CS NPs at high pH value, which is in favor of DOX loading in PBA-CS NPs.
Particle size was measured by DLS and shown in Figure 1b. The hydrodynamic size of CS NPs, PBA-CS NPs, CS-DOX NPs and PBA-CS-DOX NPs was 111.4 nm, 118.2 nm, 179.4 nm and 192.5 nm, respectively. It was also found that both particles exhibited different surface charges in the aqueous solution with different pH values (Figure 1c). The zeta potential of CS NPs decreased from 30.7 mV to 7.71 mV as pH value increased from 4.5 to 8.5. The positive charge of CS NPs at low pH value indicates that most amino groups on the surface of CS NPs are protonated. In contrast, the zeta potential of PBA-CS NPs was changed from positive potential (27.1 mV) to negative (-9.55 mV) when pH raised from 4.5 to 8.5. This indicates that phenylboronic acid groups on the surface of PBA-CS NPs are deprotonated at high pH value. Thus, the PBA-CS NPs have a surface charge reversible characteristic. In neutral condition, the zeta potential of CS NPs and PBA-CS NPs is 12.7 mV and 4.86 mV. The stability of CS NPs and PBA-CS NPs in different pH values (PBS solution, 0.01M, pH 5.5, 6.5, 7.4 and 8.5, respectively) were measured by DLS (Figure S3 and S4). Both nanoparticles are stable in the range of pH 5.5-8.5, while only a slight increase in diameter of PBA-CS NPs at pH 7.4 and 8.5.
Figure S5 show the typical TEM images of PBA-CS NPs and PBA-CS-DOX NPs. Obviously, both PBA-CS NPs and PBA-CS-DOX NPs have a spherical shape. The size of PBA-CS NPs and PBA-CS-DOX NPs is about 100 nm and 128 nm, respectively. In addition, the morphology of CS NPs and CS-DOX NPs is also spherical (the images are not shown), and the size of CS NPs and CS-DOX NPs is about 83.5 nm and 108.6 nm, respectively. These values are smaller than those measured by DLS, which is due to the dry state of samples in TEM study.
Figure 1
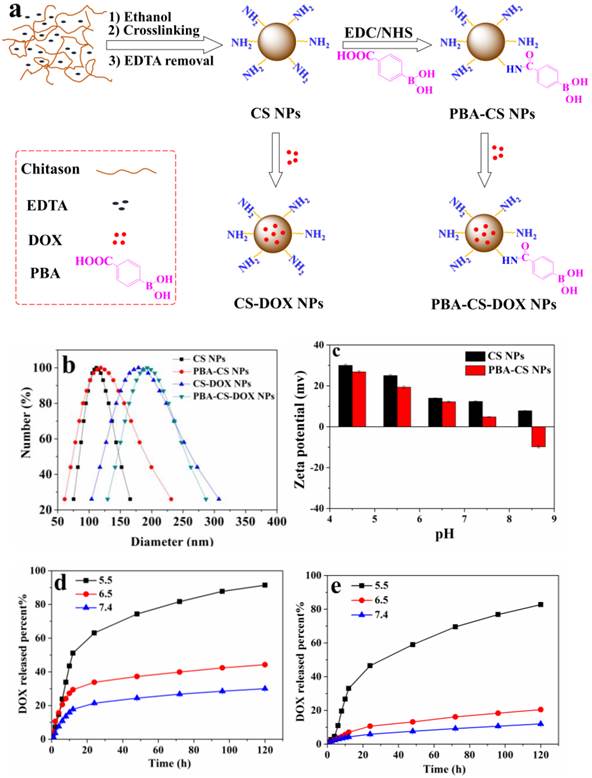
(a) Schematically showing the preparation of CS NPs, PBA-CS NPs, CS-DOX NPs and PBA-CS-DOX NPs; (b) Size distribution of CS NPs, CS-DOX NPs, PBA-CS NPs and PBA-CS-DOX NPs; (c) Zeta potential of CS NPs and PBA-CS NPs at different pH values; (d) and (e) DOX release profiles from CS-DOX NPs and PBA-CS-DOX NPs in PBS (pH 7.4, 6.5 and 5.5) at 37 oC, respectively.
In Vitro Drug Release
The DOX release profiles of CS-DOX NPs and PBA-CS-DOX NPs were evaluated in phosphate buffer solution (PBS) at different pH values (5.5, 6.5 and 7.4, respectively), as shown in Figure 1d and e. For CS-DOX NPs, only 30% DOX released from the nanoparticles within 120 h (pH 7.4), while the release percent of DOX increases to 44% and 91% at pH 6.5 and 5.5, respectively. On the other hand, the DOX release amount from PBA-CS-DOX NPs is 12% (pH 7.4), 20% (pH 6.0) and 83% (pH 5.0) within 120 h. It is obviously that the release rate of DOX increases with the decrease of medium pH for both two nanoparticles. When pH value decreases, the electrostatic interaction between carriers and drug declines due to the protonation of amino groups in both chitosan and DOX. In addition, the DOX release rates from PBA-CS-DOX NPs are slower than that from CS-DOX NPs at three pH values (especially at pH 7.4), which is consistent with the zeta potential of two nanoparticles.
Cellular Uptake
The cellular uptake and distribution are crucial for nanoparticles to achieve their biological activities. To investigate the cellular distribution of the CS NPs and PBA-CS NPs, SH-SY5Y cells were pretreatment with 100 nM Lyso-Tracker Red, an endosomal/lysosomal marker, and then co-cultured with FITC-labeled CS NPs and PBA-CS NPs for 4 h at 37 oC. From Figure S6, the co-localization of endosome and lysosome with FITC-labeled CS NPs and PBA-CS NPs revealed that most of NPs were localized in endosomes or lysosomes, indicating that the cell endocytic is the most possible pathway of cellular uptake for these NPs. Also, it is apparent that both nanoparticles do not penetrate the nuclei. It seems that the intracellular amount of PBA-CS NPs is much more than non-decorated CS NPs, suggesting that the phenylboronic acid decorated nanoparticles are more easily internalized by the cells.
To observe the intracellular DOX delivery, free DOX, CS-DOX NPs and PBA-CS-DOX NPs were co-cultured with SH-SY5Y cells, H22 cells and HepG2 cells for 4 h, and then the cells were examined using CLSM (Figure 2a, b and c). After 4 h incubation, a weak red fluorescence arising from DOX was observed in cell nuclei. On the other hand, a strong red signal is observed in cytoplasm and nucleus for CS-DOX NPs and PBA-CS-DOX NPs treated cells, indicating that CS-DOX NPs and PBA-CS-DOX NPs can be rapidly internalized by tumor cells and release DOX in cytoplasm. The DOX fluorescence intensity from PBA-CS-DOX NPs is higher than that from CS-DOX NPs in both the cytoplasm and the nuclei.
To provide further evidence, free DOX, CS-DOX NPs and PBA-CS-DOX NPs were incubated with SH-SY5Y cells, H22 cells and HepG2 cells for 4 h, and then the cellular uptake of DOX was quantitatively investigated by flow cytometry, as shown in Figure 2d. Fluorescence intensity of each cell line increases in the following order: free DOX < CS-DOX NPs < PBA-CS-DOX NPs, which is consistent with the results of CLSM. All these cellular uptake results demonstrate that PBA-CS-DOX NPs are able to deliver more DOX into tumor cells due to the active targeted effect from the boronic acid groups in PBA-CS-DOX NPs.
In Vitro Cytotoxicity
The cytotoxicity of CS-DOX NPs and PBA-CS-DOX NPs at different concentrations against SH-SY5Y cells, H22 cells and HepG2 cells were verified by MTT assay. Figure 3a, b and c show the viability of cells co-cultured with all these samples for 48 h, respectively. It can be seen that neither CS NPs nor PBA-CS NPs show any significantly cytotoxicity against SH-SY5Y cells, H22 cells and HepG2 cells even after 48 h incubation (all cell viabilities are larger than 90%), suggesting that chitosan-based nanoparticles are biocompatible. On the other hand, dose-dependent cytotoxicity for free DOX, CS-DOX NPs and PBA-CS-DOX NPs is observed. Cell viability decreases as the DOX concentration increases. For SH-SY5Y cells, cell viability decreases to 34% after CS-DOX NPs treated for 48 h at the DOX concentration of 16 μg/mL, while this value decreases to 31% after PBA-CS-DOX NPs treated for 48 h at same DOX concentration. Figure 3b show the viability of H22 cells treated under same conditions. The cell viability decreases to 38% after CS-DOX NPs treated for 48 h at the DOX concentration of 16 μg/mL, while this value decreases to 32% after PBA-CS-DOX NPs treated for 48 h. For HepG2 cells, the cell viability is 42% for CS-DOX NPs and 35% for PBA-CS-DOX NPs at the DOX concentration of 16 μg/mL. It is also found that CS-DOX NPs and PBA-CS-DOX NPs display lower cytotoxicity than free DOX at all tested concentrations, which is due to the sustained drug release property of nanoparticles cells. Figure 3d displays the calculated IC50 values of three DOX formulations against SH-SY5Y cells, H22 cells and HepG2 cells.
Penetration and Accumulation in Multicellular Spheroids
SH-SY5Y cells were used to culture the multicellular spheroids (MCS), which represent the avascular areas in tumor tissues and can be used to investigate the penetration and accumulation profiles of these two nanoparticles. MCS were co-cultured with free DOX, FITC-labeled CS-DOX NPs and FITC-labeled PBA-CS-DOX NPs for 1 h, 2 h, 4 h, 8 h and 12 h, respectively.
Apparently, a time-dependent penetration and accumulation of these two nanoparticles were observed in first run, as shown in Figure 4a, c and e. From Figure 4a, it can be seen that the penetration of free DOX is obviously restricted to the outer region of MCS (only about 70 μm from the periphery of MCS) even after 12 h incubated. From Figure 4c, it is found that the weak FITC fluorescence from FITC-labeled CS-DOX NPs appears in the periphery cells of MCS after 12 h incubation and DOX signal ranged from the periphery to the middle of the MCS, indicating that some DOX (released from CS-DOX NPs) can penetrate through the spheroids. In addition, for PBA-CS-DOX NPs, not only a strong FITC fluorescence signal from nanoparticles appears in the periphery of MCS, but also a strong DOX fluorescence signal retains in almost the entire MCS (Figure 4e). This result indicates that PBA-CS-DOX NPs can more efficiently deliver a large amount of DOX into MCS, which is consistent with the result of monolayer cellular uptake.
Figure 2
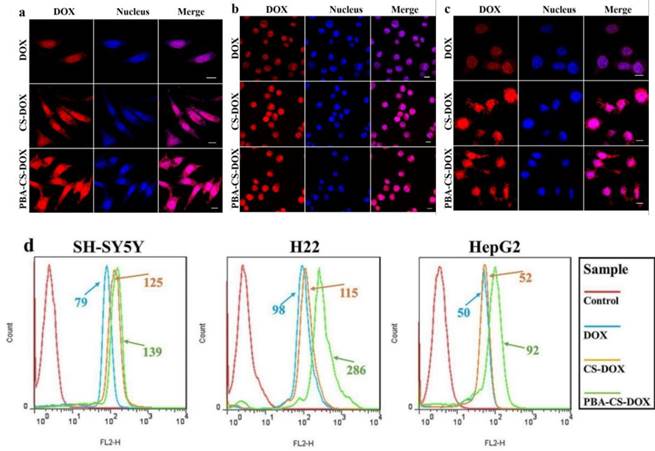
(a) CLSM images of SH-SY5Y cells incubated with DOX, CS-DOX NPs and PBA-CS-DOX NPs for 4 h; (b) CLSM images of H22 cells incubated with DOX, CS-DOX NPs and PBA-CS-DOX NPs for 4 h; (c) CLSM images of HepG2 cells incubated with DOX, CS-DOX NPs and PBA-CS-DOX NPs for 4 h; (d) Cellular uptake of DOX, CS-DOX NPs and PBA-CS-DOX NPs measured by flow cytometry; Scale bar = 10 μm.
Figure 3
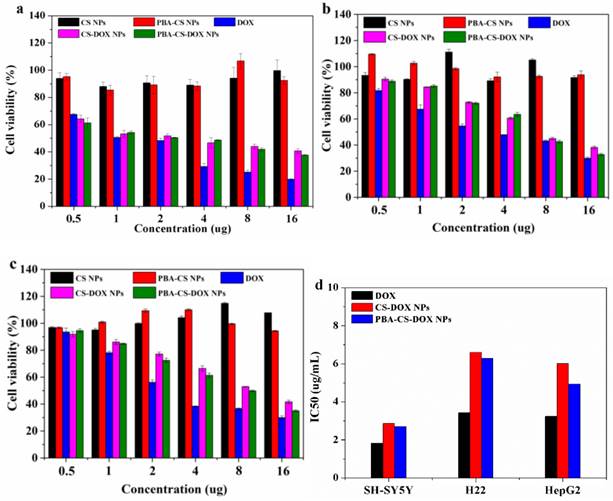
In vitro cytotoxicity of CS-DOX NPs and PBA-CS-DOX NPs against SH-SY5Y cells (a), H22 cells (b) and HepG2 cells (c) for 48 h; IC50 of DOX, CS-DOX NPs and PBA-CS-DOX NPs against SH-SY5Y, H22 and HepG2 cells (d).
Figure 4
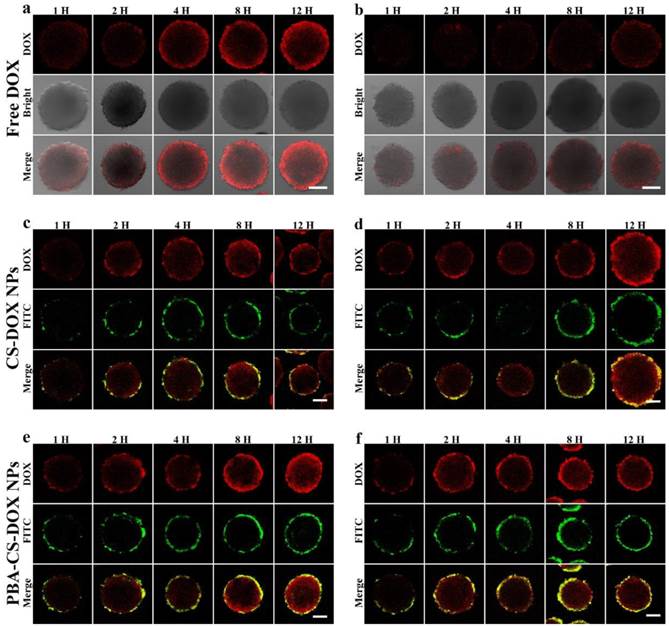
CLSM images of SH-SY5Y MCS incubated with free DOX (a and b), FITC-labeled CS-DOX NPs (c and d) and FITC-labeled PBA-CS-DOX NPs (e and f), Scale bars = 100 μm.
To further investigate the accumulation of drug-loaded nanoparticles in MCS, all DOX-internalized MCS in the first run were washed with PBS for three times and re-dispersed in fresh culture medium to incubate for another 24 h. After then, corresponding samples were washed with PBS for three times and observed by CLSM again (the second run). To our surprise, DOX fluorescence signal sharply decreases, even disappear for all free DOX co-cultured MCS (Figure 4b). We suppose that MCS can expel accumulated free DOX from outer layer cells to cell culture medium by the so called multicellular resistance (MCR). In contrast, neither FITC nor DOX fluorescence signal from FITC-labeled CS-DOX NPs and PBA-CS-DOX NPs co-cultured MCS has any significant reduction (Figure 4d and f).
The semi-quantitative assessment of the average fluorescence intensity of each sample were done by the software ZEN 2008 program. The mean DOX fluorescence intensity in the three different regions of each MCS were calculated and normalized by area. As shown in Figure 5a, b and c, the mean intensity in the periphery of MCS increases as the time elapses for free DOX and reached its maximum at 12 h after incubation (the 1st run), while the mean intensities in the intermedium and core region of MCS were much lower than that of in the periphery region, indicating that free DOX tends to accumulate at MCS' periphery relative to the core. For 2nd run (time with “*” in Figure 5), the mean intensities of DOX in three regions for all time points significantly decrease for free DOX. From Figure 5b and c, it can be seen that the DOX fluorescence intensities for both CS-DOX NPs and PBA-CS-DOX NPs are much stronger than that of free DOX in these three regions of MCS at all the treatment time. For example, the mean intensity in the core of MCS at 12 h (1st run) was 35 (free DOX), 48 (CS-DOX NPs) and 61 (PBA-CS-DOX NPs), respectively, confirming that PBA-CS-DOX NPs can penetrate much deeper into MCS than CS-DOX NPs and free DOX. In addition, there is no significantly decrease in mean intensity in three regions of MCS for PBA-CS-DOX NPs in 2nd run, indicating that PBA-CS-DOX NPs can remain in MCS for a long time and resist drug efflux.
Additionally, the FITC fluorescence average intensities of FITC-labeled CS-DOX NPs and PBA-CS-DOX NPs in MCS in the 1st run and 2nd run were also calculated (Figure 5d). It was clear that FITC mean intensity of PBA-CS-DOX NPs are higher than CS-DOX NPs at all the tested time points, further demonstrating that the PBA-CS NPs have excellent penetrate and accumulate ability in MCS.
Growth Inhibition of MCS
To study the cell inhibition of these drug-loaded nanoparticles, SH-SY5Y MCS were incubated with fresh culture medium, free DOX, empty PBA-CS NPs, CS-DOX NPs and PBA-CS-DOX NPs for 7 days. Figure 6a shows the representative graphics of SH-SY5Y MCS during the treatment. Apparently, MCS that incubated with cell culture medium or empty PBA-CS NPs do not limit the growth of MCS during 7 days. All the spheroids' diameter increases over time and the cells become increasingly compact owing to the interaction between cell and ECM. For free DOX, the growth inhibition to MCS is effective at initial three days, but does not work at then. Otherwise, MCS that co-cultured with CS-DOX NPs and PBA-CS-DOX NPs give a persistent growth inhibition, the diameter of MCS decreases remarkably during the 7 days, indicating that the outer cells of MCS are killed due to the cytotoxic effect of DOX.
The morphology of these MCS is observed by scanning electronic microscope, as shown in Figure 6b. Apparently, MCS co-cultured with fresh medium and empty PBA-CS NPs have a homogeneously spherical shape, and the periphery cells of spheroids grow integrally and compactly. Furthermore, the surface of MCS treated with CS-DOX NPs and PBA-CS-DOX NPs is sharply disorganized, the peripheral cells become disintegrated and shrunken, and the MCS almost lose their 3-D structure. These morphologies and their size confirm again growth inhibition effect is in the order of PBA-CS-DOX NPs > CS-DOX NPs > free DOX.
Figure 5
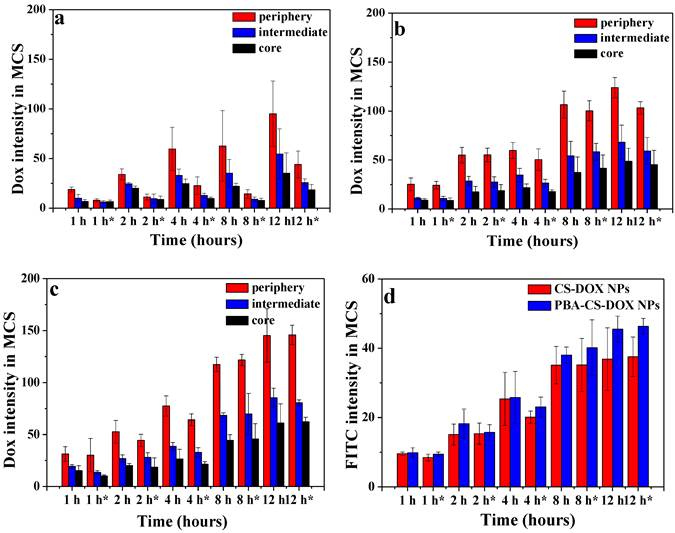
Area-normalized distribution of free DOX (a), CS-DOX NPs (b) and PBA-CS-DOX NPs (c) in different regions of MCS at different time in 1st and 2nd ( “*” represents 2nd); (d) Area-normalized distribution of FITC-labeled CS-DOX NPs and PBA-CS-DOX NPs in MCS; Data are represented as mean ± SD (n = 3).
Figure 6
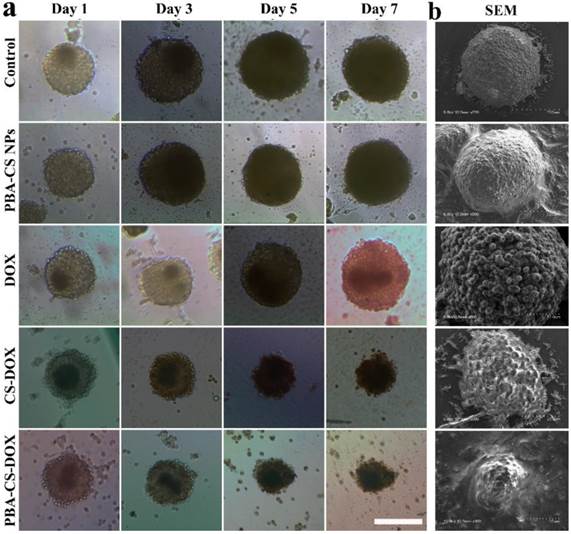
(a) Growth inhibition assay in SH-SY5Y MCS. Representative images of MCS treated with PBA-CS NPs, free DOX, CS-DOX NPs and PBA-CS-DOX NPs. MCS cultured in RPMI 1640 medium as a control; Scale bar = 200 μm; (b) SEM images of MCS at Day 7.
NIR Fluorescence In Vivo Imaging
To visualize the nanoparticles' fate in vivo, NIR-797-isothiocyanate was decorated on the surface of CS NPs and PBA-CS NPs, respectively. The distribution of the nanoparticles in hepatic H22 tumor-bearing mice was monitored via the NIRF imaging. Figure 7a depicts the in vivo NIRF images at different time after intravenous injection. It can be seen that strong fluorescence appears in both liver and intestine in the initial 4 h for CS NPs and PBA-CS NPs treated groups, suggesting that some of the nanoparticles are captured by the phagocytic cells and the reticuloendothelial system (RES). On the other hand, at 1 h post-injection, the fluorescence signal occurs in tumor areas for both CS NPs and PBA-CS NPs treated groups. Moreover, the fluorescence intensity in the tumor region increases with time. Compared with CS NPs group, the fluorescence intensity in the tumor area of PBA-CS NPs group is much higher at all the tested time, suggesting that the decoration of phenylboronic acid on the surface of CS NPs can enhance the accumulation of nanoparticles in tumor sites.
At the end of observation the mice were sacrificed and the ex vivo fluorescence intensity images of heart, tumor, lungs, liver, brain, spleen, stomach, kidneys and intestine were obtained. From Figure 7b and c, we can see that the tumor and liver show comparably strong fluorescence signal for CS NPs group, while the fluorescence signal in the tumor is much stronger than that in the liver for PBA-CS NPs treated mouse. Figure 7d shows the semi-quantitative comparison of fluorescence intensity in tumor regions and liver regions of CS NPs and PBA-CS NPs treated mice. A greater tumor accumulation for PBA-CS NPs treated mouse than that of CS NPs treated mouse is observed, indicating that phenylboronic acid modification increases nanoparticles' tumor targeting ability. Thus, it is apparently that PBA-CS NPs can not only target to the tumor tissues by the passive EPR effect, but also accumulate more in tumor site through the active target action between the phenylboronic acid decorated nanoparticles and sialic acid over-expressed tumor cells.
Penetration in Tumor Tissue
Accumulation and penetration in tumor tissues are very important for CS-DOX NPs and PBA-CS-DOX NPs to achieve a desired therapeutic effect in oncotherapy. Therefore, the distribution of CS NPs and PBA-CS NPs in tumor tissues was investigated and displayed in Figure 8, where the green fluorescence signals represent the location of FITC-labeled CS NPs and PBA-CS NPs in the tumor sections, while the red fluorescence signals correspond the position of tumor blood vessels. We can see that a quality of CS NPs are in tumor area at 24 h post-injection, but most of them just gather in the area around of blood vessels, indicating that CS NPs can only passively extravasate through the leaky vessels. In contrast, a great number of PBA-CS NPs are observed in the tumor area and most of them penetrate much further from blood vessels. Moreover, they almost distribute in the whole tumor area. Thus, compared to CS NPs, PBA-CS NPs can accumulate more and penetrate further from tumor blood vessels.
Figure 7
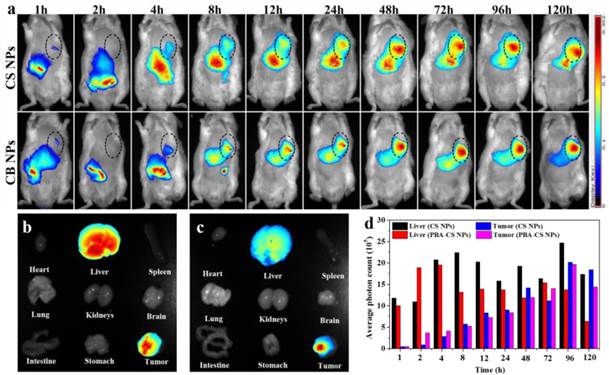
(a) The NIRF images of H22 tumor-bearing mice following intravenous injection of NIR-797 labeled CS NPs and PBA-CS NPs, tumor areas were surrounded with dotted lines; Images of various organs at 120 h post-administration. NIR-797 labeled CS NPs (b); NIR-797 labeled PBA-CS NPs (c); The average photon counts measured by Image J in tumor and liver region at different time points post injection (d).
Figure 8
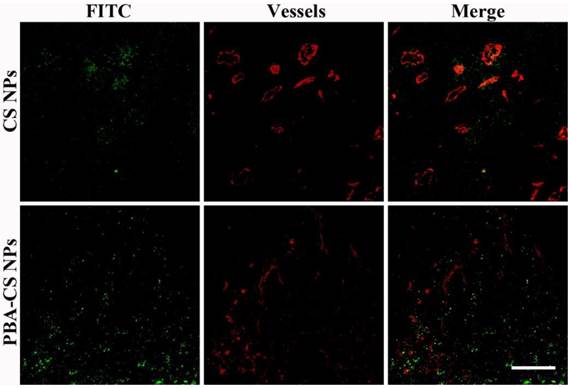
Penetration of FITC-labeled CS NPs and PBA-CS NPs in tumors at 24 h post-administration, Green nanoparticles and red blood vessels show in the images of H22 tumor sections, Scale bar = 100 μm.
Figure 9
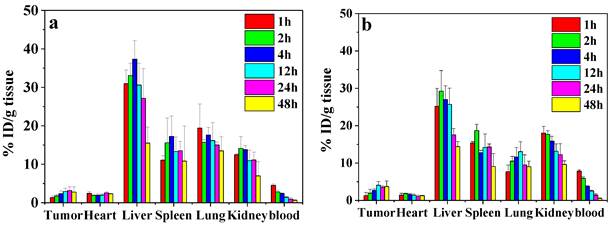
Biodistribution of CS-DOX NPs (a) and PBA-CS-DOX NPs (b) in different organs of H22 tumor-bearing mice at various time points after intravenous injection; Data are represented as mean ± SD (n = 3).
DOX Biodistribution In Vivo
To study the biodistribution of DOX-loaded nanoparticles, the H22 subcutaneous tumor-bearing mice were administrated with CS-DOX NPs and PBA-CS-DOX NPs via tail vein. Figure 9a and b show the biodistribution results of DOX in tumor and major organs (heart, liver, kidney, lung, spleen and blood) at different time points for both formulations. For the CS-DOX NPs, the DOX concentration in tumor keeps an increase from 1 h to 24 h post-injection and reaches its maximum of 3.2 % injection dose per gram of tumor (ID/g) at 24 h post-injection. For the PBA-CS-DOX NPs, the drug concentration in tumor shows a similar increase with time after injection and reaches its maximum (4.1 % ID/g) at 12 h post-injection. Compared to CS-DOX NPs, PBA-CS-DOX NPs display a 1.3-fold increase in DOX concentration in tumor. Also, it should be noted that a high DOX concentration in tumor is maintained in detection time points. In addition, DOX accumulation in tumor areas is also characterized as the area-under-the-curve (AUC), by the measured concentration over time. The AUC of CS-DOX NPs distribution in tumor is 135% ID h/g, while the AUC of PBA-CS-DOX NPs is 168% ID h/g. This fact indicates that the phenylboronic acid-decorated nanoparticles can increase the DOX concentration in tumor tissue, which is attributed to the active targeting against hepatoma cells. In addition, it is found that the DOX concentration in heart for CS-DOX NPs and PBA-CS-DOX NPs is only 2.5% ID/g and 1.8% ID/g, respectively, which is much smaller than that of free DOX [27]. This fact suggests that nanoparticulate formulation can significantly decrease the cardiotoxicity of free drug.
In Vivo Antitumor Activity
Next the in vivo antitumor efficacy was investigated. The H22 tumor-bearing mice were injected with free DOX (6 mg/kg), CS-DOX NPs (6 mg/kg DOX eq.) and PBA-CS-DOX NPs (6 mg/kg DOX eq.), respectively, at a single dose. Saline, empty CS NPs and empty PBA-CS NPs were used as control. Tumor size was monitored every day. At day 7 post-injection, mice were sacrificed and the tumor mass was collected, imaged and weighed.
Figure 10a shows the change curves of tumor volumes during the 7 days treatment. At the end of experiments (Day 7), the average tumor volume of the mice received saline, CS NPs and PBA-CS NPs reaches to 1880 mm3, 1792 mm3 and 1896 mm3, respectively. For free DOX and CS-DOX NPs treated groups, the tumor growth shows some extent degree of inhibition in the first 3 days, but then goes up. The resulting tumor volume is 1226 mm3 and 1052 mm3 at day 7 for free DOX and CS-DOX NPs treated groups, respectively. On the other hand, the average tumor size of PBA-CS-DOX NPs treated mice is 688 mm3 at the end of treatment.
The mice were then sacrificed at day 7 post-injection, tumor tissues were completely excised, weighted and imaged (Figure 10b and 10c). Figure 10b shows the mean weight of tumor tissues from all the groups. The proliferation and growth of tumors in saline, CS NPs and PBA-CS NPs treated mice a very quickly and have a much higher tumor weight (0.76 ± 0.16 g, 0.74 ± 0.20 g, 0.79 ± 0.28 g, respectively). In contrast, tumor weight of CS-DOX NPs and PBA-CS-DOX NPs treated mice is only 0.47 ± 0.10 g and 0.30 ± 0.09 g, much lower than that of free DOX treated mice (0.60 ± 0.17 g). The tumor growth inhibition (TGI) is 21%, 38% and 60% for free DOX, CS-DOX NPs and PBA-CS-DOX NPs, respectively. Figure 10c shows all tumor tissues in each group, it can be seen that the tumor diameter and volume of PBA-CS-DOX NPs treated group are smaller than other groups. Thus, PBA-CS-DOX NPs treated mice have the smallest tumor volume and tumor weight. This may ascribe to the combined effect of passive targeting (EPR effect) and the active tumor targeting by PBA surface decoration.
Enhancing tumor accumulation and penetration of nanomedicines is a common issue in the development of effective drug delivery systems. Compared to other tumor-targeting ligands such as antibody, aptamer, polypeptide, phenylboronic acid has some advantages such as inexpensive and non-immunogenicity. More importantly, phenylboronic acid can interact with sialic acid residues overexpressed on many malignant carcinoma cells to form annular boronate ester, resulting a high selectivity and binding affinity. Based on our results, the targeting effect of phenylboronic acid toward solid tumor and tumor cells is significant. It facilitates cellular uptake of nanoparticles, especially for the tumor cells in which sialic acid residues are highly overexpressed such as HepG2 and H22 tumor cells. Also, phenylboronic acid can improve the drug retention in cells as we showed the accumulation of drug-loaded nanoparticles in 3-D MCS. This property of phenylboronic acid can decline drug to pump out from cells. Finally, phenylboronic acid can enhance drug accumulation in tumor. In our case, 30% increase in DOX accumulation in tumor for PBA-CS-DOX NPs is observed compared to that of CS-DOX NPs. These advantages of phenylboronic acid group are much useful in the design of new generation of drug delivery systems.
Figure 10
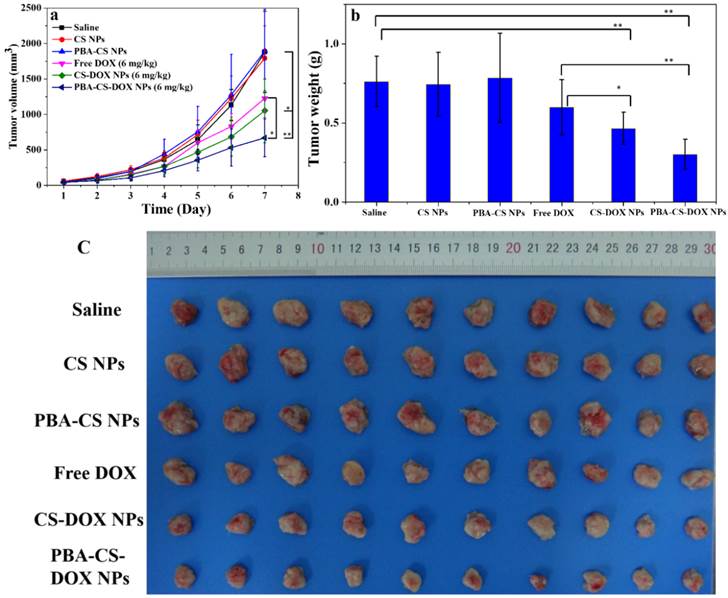
(a) In vivo tumor growth curves of H22 tumor-bearing mice that received different treatments. Data are represented as mean ± SD (n = 10); (b) Tumor weight changes of mice after 7-day treatment; (c) image of H22 graft tumors at the end of the treatment; ** represents P < 0.01; * represents P < 0.05.
Conclusions
PBA-CS NPs were prepared by the surface reaction of 4-carboxyphenylboronic acid and chitosan nanoparticles. DOX was successfully loaded into PBA-CS NPs with drug loading content up to 13.7%. It was found that the decoration of CPBA on the surface of CS NPs significantly decreased the surface potential of particles and impart a surface zwitterionic characteristic to the nanoparticles. In vitro 2-D monolayer and 3-D MCS co-cultured experiments showed that compared to CS NPs, PBA-CS NPs were more easily internalized by the cells and could deliver larger amount of DOX into the cells due to the active targeting effect of boronic acid group. Furthermore, PBA-CS-DOX NPs displayed a deeper penetration in MCS and better growth inhibition to MCS than CS-DOX NPs. Drug distribution and NIRF imaging revealed that PBA-CS NPs could accumulate more drug in tumor area than CS NPs. In vivo antitumor examination demonstrated that the PBA-CS-DOX NPs have superior efficacy in restricting tumor growth of tumor-bearing mice than free DOX and CS-DOX NPs.
Abbreviations
EPR: enhanced permeation and retention; CS: chitosan; ECM: extracellular matrix; 3-D: three-dimensional; 2-D: two-dimensional; MCS: multicellular spheroids; CS NPs: chitosan nanoparticles; PBA-CS NPs: phenylboronic acid-decorated nanoparticles; DOX: doxorubicin; CPBA: 4-carboxyphenylboronic acid; FITC: fluorescein isothiocyanate; polyHEMA: poly(2-hydroxyethyl methacrylate); NHS: N-hydroxysuccinimide; TEM: Transmission electron microscopy; EDC×HCl: 1-(3-Dimethylaminopropyl)-3-ethylcarbodiimide hydrochloride; DLC: drug loading content; CS-DOX NPs: DOX-loaded CS NPs; MTT: 1-(4,5-dimethylthiazol-2-yl)-3,5-diphenyl-formazan; PBA-CS-DOX NPs: DOX-loaded PBA-CS nanoparticles; DLE: drug loading efficiency; CLSM: confocal laser scanning microscope; NIRF: near infrared fluorenscence; BSA: bovine serum albumin; MCR: multicellular resistance; RES: the reticuloendothelial system; TGI: tumor growth inhibition.
Supplementary Material
Table S1, Figure S1-S6.
Acknowledgements
This work was supported by the Natural Science Foundation of China (No. 21474045, 51273090 and 51422303), Specialized Research Fund for the Doctoral Program of Higher Education and the Program for Changjiang Scholars and Innovative Research Team in University.
Competing Interests
The authors have no competing interests.
References
1. Alexis F, Pridgen EM, Langer R, Farokhzad OC. Nanoparticle technologies for cancer therapy. Drug Delivery: Springer. 2010;197:55-86
2. Zhang L, Chan JM, Gu FX, Rhee J-W, Wang AZ, Radovic-Moreno AF. et al. Self-assembled lipid-polymer hybrid nanoparticles: a robust drug delivery platform. ACS Nano. 2008;2:1696-702
3. Gref R, Minamitake Y, Peracchia MT, Trubetskoy V, Torchilin V, Langer R. Biodegradable long-circulating polymeric nanospheres. Science. 1994;263:1600-3
4. Farokhzad OC, Langer R. Impact of Nanotechnology on Drug Delivery. ACS Nano. 2009;3:16-20
5. Youan B-BC. Impact of nanoscience and nanotechnology on controlled drug delivery. Nanomedicine (Lond). 2008;3:401-6
6. Radovic-Moreno AF, Lu TK, Puscasu VA, Yoon CJ, Langer R, Farokhzad OC. Surface charge-switching polymeric nanoparticles for bacterial cell wall-targeted delivery of antibiotics. ACS Nano. 2012;6:4279-87
7. Kim JH, Kim YS, Park K, Kang E, Lee S, Nam HY. et al. Self-assembled glycol chitosan nanoparticles for the sustained and prolonged delivery of antiangiogenic small peptide drugs in cancer therapy. Biomaterials. 2008;29:1920-30
8. Liu F, Qi H, Huang L, Liu D. Factors controlling the efficiency of cationic lipid-mediated transfection in vivo via intravenous administration. Gene Ther. 1997;4:517-23
9. Regnstrom K, Ragnarsson EGE, Fryknas M, Koping-Hoggard M, Artursson P. Gene expression profiles in mouse lung tissue after administration of two cationic polymers used for nonviral gene delivery. Pharm Res. 2006;23:475-82
10. Li S, Tseng WC, Stolz DB, Wu SP, Watkins SC, Huang L. Dynamic changes in the characteristics of cationic lipidic vectors after exposure to mouse serum: implications for intravenous lipofection. Gene Ther. 1999;6:585-94
11. Goodman TT, Ng CP, Pun SH. 3-D Tissue Culture Systems for the Evaluation and Optimization of Nanoparticle-Based Drug Carriers. Bioconjug Chem. 2008;19:1951-9
12. Kim B, Han G, Toley BJ, Kim Ck, Rotello VM, Forbes NS. Tuning payload delivery in tumour cylindroids using gold nanoparticles. Nat Nanotechnol. 2010;5:465-72
13. Gu F, Zhang L, Teply BA, Mann N, Wang A, Radovic-Moreno AF. et al. Precise engineering of targeted nanoparticles by using self-assembled biointegrated block copolymers. Proc Natl Acad Sci U S A. 2008;105:2586-91
14. Xiao Z, Levy-Nissenbaum E, Alexis F, Lupták A, Teply BA, Chan JM. et al. Engineering of targeted nanoparticles for cancer therapy using internalizing aptamers isolated by cell-uptake selection. ACS Nano. 2012;6:696-704
15. Sengupta S, Eavarone D, Capila I, Zhao G, Watson N, Kiziltepe T. et al. Temporal targeting of tumour cells and neovasculature with a nanoscale delivery system. Nature. 2005;436:568-72
16. Petros RA, DeSimone JM. Strategies in the design of nanoparticles for therapeutic applications. Nat Rev Drug Discov. 2010;9:615-27
17. Wang X, Li J, Wang Y, Cho KJ, Kim G, Gjyrezi A. et al. HFT-T, a Targeting Nanoparticle, Enhances Specific Delivery of Paclitaxel to Folate Receptor-Positive Tumors. ACS Nano. 2009;3:3165-74
18. Moghimi SM, Hunter AC, Murray JC. Long-circulating and target-specific nanoparticles: Theory to practice. Pharmacol Rev. 2001;53:283-318
19. Byrne JD, Betancourt T, Brannon-Peppas L. Active targeting schemes for nanoparticle systems in cancer therapeutics. Adv Drug Deliv Rev. 2008;60:1615-26
20. Simberg D, Duza T, Park JH, Essler M, Pilch J, Zhang L. et al. Biomimetic amplification of nanoparticle homing to tumors. Proc Natl Acad Sci U S A. 2007;104:932-6
21. Wang J, Wu W, Jiang X. Nanoscaled boron-containing delivery systems and therapeutic agents for cancer treatment. Nanomedicine (Lond). 2015;10:1149-63
22. Peng Q, Chen F, Zhong Z, Zhuo R. Enhanced gene transfection capability of polyethylenimine by incorporating boronic acid groups. Chem Commun (Camb). 2010;46:5888-90
23. He C, Hu Y, Yin L, Tang C, Yin C. Effects of particle size and surface charge on cellular uptake and biodistribution of polymeric nanoparticles. Biomaterials. 2010;31:3657-66
24. Wang J, Zhang Z, Wang X, Wu W, Jiang X. Size- and pathotropism-driven targeting and washout-resistant effects of boronic acid-rich protein nanoparticles for liver cancer regression. J Control Release. 2013;168:1-9
25. Wang J, Wu W, Zhang Y, Wang X, Qian H, Liu B. et al. The combined effects of size and surface chemistry on the accumulation of boronic acid-rich protein nanoparticles in tumors. Biomaterials. 2014;35:866-78
26. Zhang L, Lin Y, Wang J, Yao W, Wu W, Jiang X. A Facile Strategy for Constructing Boron-Rich Polymer Nanoparticles via a Boronic Acid-Related Reaction. Macromol Rapid Commun. 2011;32:534-9
27. Wang X, Yang C, Zhang Y, Zhen X, Wu W, Jiang X. Delivery of platinum(IV) drug to subcutaneous tumor and lung metastasis using bradykinin-potentiating peptide-decorated chitosan nanoparticles. Biomaterials. 2014;35:6439-53
28. Wang X, Zhen X, Wang J, Zhang J, Wu W, Jiang X. Doxorubicin delivery to 3D multicellular spheroids and tumors based on boronic acid-rich chitosan nanoparticles. Biomaterials. 2013;34:4667-79
29. Hamilton G. Multicellular spheroids as an in vitro tumor model. Cancer Lett. 1998;131:29-34
30. Ivascu A, Kubbies M. Rapid generation of single-tumor spheroids for high-throughput cell function and toxicity analysis. J Biomol Screen. 2006;11:922-32
31. Chen R, Wang X, Yao X, Zheng X, Wang J, Jiang X. Near-IR-triggered photothermal/photodynamic dual-modality therapy system via chitosan hybrid nanospheres. Biomaterials. 2013;34:8314-22
32. Guo R, Zhang L, Zhu Z, Jiang X. Direct facile approach to the fabrication of chitosan-gold hybrid nanospheres. Langmuir. 2008;24:3459-64
Author contact
![]() Corresponding author: Email: jiangxedu.cn.
Corresponding author: Email: jiangxedu.cn.
Citation styles
APA
Wang, X., Tang, H., Wang, C., Zhang, J., Wu, W., Jiang, X. (2016). Phenylboronic Acid-Mediated Tumor Targeting of Chitosan Nanoparticles. Theranostics, 6(9), 1378-1392. https://doi.org/10.7150/thno.15156.
ACS
Wang, X.; Tang, H.; Wang, C.; Zhang, J.; Wu, W.; Jiang, X. Phenylboronic Acid-Mediated Tumor Targeting of Chitosan Nanoparticles. Theranostics 2016, 6 (9), 1378-1392. DOI: 10.7150/thno.15156.
NLM
Wang X, Tang H, Wang C, Zhang J, Wu W, Jiang X. Phenylboronic Acid-Mediated Tumor Targeting of Chitosan Nanoparticles. Theranostics 2016; 6(9):1378-1392. doi:10.7150/thno.15156. https://www.thno.org/v06p1378.htm
CSE
Wang X, Tang H, Wang C, Zhang J, Wu W, Jiang X. 2016. Phenylboronic Acid-Mediated Tumor Targeting of Chitosan Nanoparticles. Theranostics. 6(9):1378-1392.
This is an open access article distributed under the terms of the Creative Commons Attribution (CC BY-NC) License. See http://ivyspring.com/terms for full terms and conditions.