Theranostics
13.3
Impact Factor
- Current Issue
- Advance Articles
- Volume 16; 2026
- Volume 15; 2025
- Volume 14; 2024
- Volume 13; 2023
- Volume 12; 2022
- Archive
- Cover Images
- Cover Suggestion
- Special Issues
Top
Introduction
Experimental section
Results
Discussion
Conclusion
Abbreviations
Supplementary Material
Acknowledgements
References
Introduction
Experimental section
Results
Discussion
Conclusion
Abbreviations
Supplementary Material
Acknowledgements
References
International Journal of Biological Sciences
International Journal of Medical Sciences
 Global reach, higher impact

Theranostics 2016; 6(2):167-176. doi:10.7150/thno.13653 This issue Cite
Research Paper
Indocyanine Green Liposomes for Diagnosis and Therapeutic Monitoring of Cerebral Malaria
Emma Portnoy1,3, Natalia Vakruk1,2, Ameer Bishara1, Miriam Shmuel1, Shlomo Magdassi3, Jacob Golenser2,*, ![]() , Sara Eyal1*
, Sara Eyal1*
1. The Institute for Drug Research, School of Pharmacy, Faculty of Medicine, The Hebrew university of Jerusalem 91120, Israel.
2. The Kuvin Center for the Study of Infectious and Tropical Diseases, Department of Microbiology and Molecular Genetics, Faculty of Medicine, The Hebrew University, Jerusalem, Israel.
3. Casali Center for Applied Chemistry, Institute of Chemistry and Center for Nanoscience and Nanotechnology, The Hebrew University of Jerusalem, Jerusalem, Israel.
*Equal contribution
Received 2015-8-25; Accepted 2015-10-12; Published 2016-1-1
Citation:
Portnoy E, Vakruk N, Bishara A, Shmuel M, Magdassi S, Golenser J, Eyal S. Indocyanine Green Liposomes for Diagnosis and Therapeutic Monitoring of Cerebral Malaria. Theranostics 2016; 6(2):167-176. doi:10.7150/thno.13653. https://www.thno.org/v06p0167.htm
Other stylesAbstract

Cerebral malaria (CM) is a major cause of death of Plasmodium falciparum infection. Misdiagnosis of CM often leads to treatment delay and mortality. Conventional brain imaging technologies are rarely applicable in endemic areas. Here we address the unmet need for a simple, non-invasive imaging methodology for early diagnosis of CM. This study presents the diagnostic and therapeutic monitoring using liposomes containing the FDA-approved fluorescent dye indocyanine green (ICG) in a CM murine model. Increased emission intensity of liposomal ICG was demonstrated in comparison with free ICG. The Liposomal ICG's emission was greater in the brains of the infected mice compared to naïve mice and drug treated mice (where CM was prevented). Histological analyses suggest that the accumulation of liposomal ICG in the cerebral vasculature is due to extensive uptake mediated by activated phagocytes. Overall, liposomal ICG offers a valuable diagnostic tool and a biomarker for effectiveness of CM treatment, as well as other diseases that involve inflammation and blood vessel occlusion.
Keywords: cerebral malaria, imaging, indocyanine green, liposomes, diagnosis
Introduction
Malaria is a devastating infectious disease caused by a protozoan of the genus Plasmodium. Approximately half of the world's population is at risk of malaria. In 2013 there were about 198 million cases of malaria and an estimated 584,000 deaths, mostly among African children [1]. Cerebral malaria (CM), a diffuse encephalopathy caused by Plasmodium falciparum is a severe neurological manifestation of malaria, characterized by fever, impaired consciousness and coma. It is associated with a 15-30% of malaria deaths [2]. Surviving patients have an increased risk of neurological and cognitive deficits, making CM a leading cause of childhood neurodisability in Sub-Saharan Africa [3, 4]. CM is diagnosed by detection of P. falciparum in blood smears, fever and neurological dysfunction. However, CM may occur when parasitemia is too low to detect [5] and the symptoms may resemble those of other diseases [6] ; therefore, misdiagnosis is common [6].
Various conventional imaging methodologies, including magnetic resonance imaging (MRI) [7-10], computed tomography [9], and positron emission tomography (PET) [11] were suggested for CM diagnosis. Yet, these methods were only partially discriminative, and obviously just a few MRI and PET units (expensive and technically complicated) are available in endemic areas [8]. More recently, optical imaging methodologies have been developed for simple, safe and sensitive diagnosis and monitoring of tumors and other diseases [12, 13]. Optical imaging of the eye fundus has also been suggested as a diagnostic tool for CM-related retinopathy in humans [14]. In mouse models (experimental cerebral malaria, ECM), optical imaging has been used to study the pathophysiology by infection with transgenic P. berghei expressing luciferase [15-17] and intravital microscopy [18-22]. In this study we evaluated near infrared (NIR) imaging and liposomes containing non-covalently bound indocyanine green (ICG), as a tool for diagnosis and monitoring of CM therapy. NIR is characterized by relatively deep tissue penetration and high signal to noise ratio, due to the low autofluorescence and absorbance in its wavelength range [12, 23]. ICG, a water soluble tricarbocyanine dye is the only US Food and Drug Administration (FDA)- and European Medicines Agency- approved NIR molecule [24]. ICG is widely used in the clinic for determination of cardiac output, hepatic function and liver blood flow, inspection of retinal and choroidal vessels [25], and diagnosis of burn depth [26]. We have previously described the advantages of a formulation in which ICG is passively adsorbed by liposomes over free ICG [27, 28]. The ICG-liposomes are expected to be uptaken by vascular and perivascular activated phagocytes that are prominent in cerebral malaria [19, 29, 30]. In the current work we show that ICG-liposomes accumulate in brains of mice depicting CM and provide a convenient mean of CM diagnosis. A reference drug, artemisone, which is effective against ECM [31], diminished the fluorescence of ICG-liposomes in the brains of infected mice, highlighting the potential of liposomal ICG for therapeutic monitoring. The experimental methodology was also used to evaluate CM mechanism: ICG-liposomes accumulated in infected mice brains due to preferable uptake by activated phagocytes and modified pharmacokinetics; aspects relevant to induction of CM and treatment.
Experimental section
Materials
Phospholipon S75 and PE 18:0/18:0-polyethylene glycol (PEG) 2000 (N-(carbonyl-methoxypolyethyleneglycol-2000)-1,2-distearoyl-sn-glycero-3-phosphoethanolamine, sodium salt) were purchased from Lipoid (Ludwigshafen, Germany). 18:1 Liss Rhod PE (1,2-dioleoyl-sn-glycero-3-phosphoethanolamine-N-(lissamine rhodamine B sulfonyl) (ammonium salt) was purchased from Avanti Polar Lipids, Inc. (Alabaster, AL,USA). ICG was purchased from Acros Organics (Geel, Belgium). Artemisone was donated by Cipla LTD (Mumbai, India). Cell culture reagents were from Biological Industries (Beit Haemek, Israel). Rabbit anti mouse Iba1 was purchased from Wako (Richmond. VA, USA), rat anti mouse CD31 was from Dianova GmbH (Hamburg, Germany), goat anti rat Alexa 488 antibody was from Molecular Probes (Eugene, OR, USA), goat anti rabbit Alexa 647 antibody was from Jackson ImmunoResearch (Baltimore Pike, PA, USA). 4',6-Diamidino-2-phenylindole (DAPI) was from Vector Laboratories (Burlingame, CA, USA). All other reagents were purchased from Sigma-Aldrich (Rehovot, Israel).
Cell culture
RAW 264.7 cells (from Dr. Boaz Tirosh, The Hebrew University) were grown in RPMI 1640 medium supplemented with 10 % fetal bovine serum, L-glutamine (2 mM), sodium pyruvate (1 mM), non-essential amino acids, penicillin (100 Units/mL), and streptomycin (100 μg/mL).
Parasites
Plasmodium berghei ANKA (PbA) strain (MRA-311, CDC, Atlanta, GA, USA) was maintained in vivo by serial transfer of parasitized erythrocytes from infective to naive mice. To avoid loss of virulence, infection was renewed every three months by using frozen stabilates. Parasites that were continuously passed in mice for about a year were used as a control less-virulent strain that did not induce CM (but still caused severe anemic malaria).
Animals
The animal study protocol was approved by the Hebrew University Institutional Animal Care and Use Committee (protocol No. MD-12-13183-5) and the procedures followed were in accordance with institutional guidelines. Male C67 Black mice (7-8 week old) were purchased from Harlan Laboratories (Rehovot, Israel). The mice had free access to a standard diet and water, and they were maintained on a 12/12-h automatically timed light/dark cycle.
Liposome preparation, ICG binding and characterization
Liposomes from Phospholipon S75 were prepared by extrusion method. Briefly, Phospholipon S75 (270 mg) and cholesterol (30 mg) were solubilized in methanol-chloroform solution (10 mL; 1:1). The solvent was evaporated by rotary evaporator Rotavapor Buchi, R 114 (Flawil, Switzerland) at 40 oC. The lipid film was hydrated by sucrose phosphate buffer (5 mL; pH 7, 2 mM, and sucrose 9.3 % w/w) and mixed by magnetic stirring under argon. The dispersion was extruded 20 times by Avanti Polar Lipids syringe extruder (Alabaster, AL, USA) through 100 nm membrane. Rhodamine B-labeled or PEGylated liposomes were prepared similarly with minor modifications. For rhodamine B-labeled liposomes, 18:1 Liss Rhod PE (0.7 mg) in chloroform (700 µL) was added to lipids solubilized in methanol-chloroform solvent. To produce PEGylated liposomes, PE 18:0/18:0-PEG 2000 (50 mg) was added to a mixture of dry lipids. For ICG binding, ICG solution in double distilled water (6 mM, 1/6) was added to the liposomal dispersion and mixed at 4oC. The liposome size and zeta potential was measured by Zetasizer Nano-S (Malvern, UK) in sucrose phosphate buffer (pH 7, 2mM, and sucrose 9.3% w/w). Free ICG solution was prepared similarly in sucrose phosphate buffer.
The liposome morphology was viewed by transmission electron microscope Tecnai T12 G2 Spirit (Cryo-TEM) (FEI, Hillsboro, Oregon, USA). ICG-liposomes were diluted to 1% w/w and prepared as described previously [27].
Induction of CM
The validity of the CM model in mice has been demonstrated previously [32, 33]. Mice were infected with 80,000 parasitized erythrocytes (leads to CM in the majority of cases, above 90%). Parasitemia was monitored every other day by blood smears prepared from tail vain, stained with Giemsa and examined by light microscopy. Mice were monitored for clinical signs of neuropathology that appear a few days before death of CM (coat staring, hunching, wobbly gait etc.) [31]. Mice that developed further neurological symptoms such as ataxia, paralysis and coma, drastic weight reduction and body temperature of 34oC or below, followed by death when parasitemia was below 20%, were considered to have died of CM. Death occurred at day 8-9 post infection. This assumption was confirmed by brain histological sections [30, 34]. Mice which did not die of CM died of severe anemia related to high parasitemia, one to two weeks later [35].
In vivo imaging
Mice were shaved under isoflurane (1-2%, v/v) anesthesia and underwent baseline scan using an IVIS Kinetic in vivo imaging system (Caliper Life Sciences, Hopkinton, MA, USA). Two hundred µL of ICG-liposomes or the free compound (8 mg/kg) in sucrose buffer (2 mM phosphate buffer pH 7.0, with 9.3 % sucrose) were injected into the tail vein and the mice were repetitively scanned. Image analysis was performed using Living Image (Caliper Life Sciences, Hopkinton, MA, USA).
Ex vivo imaging
Mice were sacrificed four hours post injection unless otherwise stated. Cardiac blood was collected in heparinized 96-well plates and tissues were harvested. Along the collection procedure, tissue and blood samples were protected from light and kept on ice. Immediately thereafter, blood and tissues were scanned by Typhoon FLA 9500 biomolecular imager. Image analysis was performed by the NIH's open source software Image J.
Effect of anti-malarial treatment on imaging
Artemisone was dissolved in DMSO (1.25 mg/mL). Mice were treated with of artemisone solution (2.5 mg/kg, injected intraperitoneally) two times a day, seven hours apart or with DMSO (40 µL), on days 3 to 5 post infection. Six days post infection, the mice were injected with ICG-liposomes (200 µL, 8 mg/kg, intraperitoneally). Mice were imaged by IVIS (n=5 for each group).
PEGylated vs non PEGylated liposomes
Naïve mice (n=5) and infected mice (n= 6) were injected with ICG-liposomes; naïve mice (n=6) and infected mice (n=7) were injected with PEG-ICG-liposomes as indicated above. Mice were sacrificed 4 hours post injection. Organs were harvested and examined as described above.
Histology studies
Naïve or infected mice were injected intravenously with ICG-rhodamine liposomes (n=3). Four hours after the injection the mice were deeply anaesthetized using pentobarbital sodium and perfused trans-cardially with cold phosphate buffered saline (PBS, pH 7.4), followed by chilled paraformaldehyde (PFA; 4%) in PBS. The brains were removed, post fixed overnight in PFA (4%) in PBS at 4°C, immersed for seven days in 30% sucrose in PBS for cryoprotection, and stored at -80°C until processed.
Serial coronal sections (10 μm) of the brains were cut in a cryostat. Series of slides, containing four brain sections each (Bregma -1.5, -1.7, -1.8 and -1.9 mm), were prepared. The sections were incubated with blocking solution (bovine serum albumin - BSA 5% and goat serum 5% in PBS) at room temperature for one hour, and then incubated with the primary antibodies, rabbit anti mouse Iba1 (1:100) and rat anti mouse CD31 (1:30) in blocking solution, overnight at 4°C. The sections were washed three times with PBS, co-incubated for one hour at room temperature with corresponding secondary antibodies conjugated to Alexa 488 (1:100) and Alexa 647 (1:150) dyes in PBS, and covered with DAPI-containing mounting medium. Images were captured by Fluorview fv10i laser scanning Olympus confocal microscope (Tokyo, Japan). Image processing was performed by built in FV10-ASW 2.0 viewer (Olympus Tokyo, Japan)
Uptake studies
RAW 264.7 cells (40,000) were seeded in 96-well plates. After 24 hours, at different time points ICG-rhodamine liposomes (40 µg/well) were added. 22 hours later cells were washed three times with ice cold PBS and emission was measured by Typhoon FLA 9500 biomolecular imager (GE Healthcare Life Sciences, Piscataway Township, NJ, USA).
Monocyte migration studies
Utilization of RAW 264.7 cells for targeting inflammation in the mouse brain has been previously demonstrated [36]. Similarly, RAW 246.7 cells were seeded in 25 cm2 flasks (5 x 10⁵ cells/flask). Forty eight hours later the cells were incubated overnight with ICG-rhodamine liposomes (1.3 mg/mL; total 8 mg liposomes/flask). At the end of the incubation, the cells were washed three times with PBS, scraped from the plate and counted. Ninety five percent viability was determined by trypan blue exclusion. Cells labeled with ICG-liposomes (non-PEGylated; 5 x 10⁶) were injected into the tail vein of naïve (n=4) or infected mice (n=6), six days post infection. Organs were harvested and examined as described above.
Statistical analysis
The Mann Whitney test or the Kruskal-Wallis test followed by Dunn's post-test, as appropriate, was used for comparisons of sequential variables (InStat; GraphPad, La Jolla, CA, USA). Results are reported as mean ± standard deviation, unless otherwise indicated. P value ≤ 0.05 was considered significant.
Results
ICG liposome kinetics in vivo and in vitro
Liposomes were prepared by extrusion method and its size and zeta potential were characterized by dynamic light scattering. The liposome size was about 200 nm and 155 nm in the absence and the presence of rhodamine B, respectively, and the mean zeta potential ranged between -20 and -32 mV (Table 1). The size measured by zeta sizer was in good correlation with Cryo-TEM results (Supplementary Material: Figure S1).
Free ICG or ICG-liposomes were injected to C57Black male naïve mice. Mice were screened by an in vivo imaging system (IVIS) (Figure 1). ICG's whole body and cerebral emission intensity was greater for liposomal than free ICG (Figure 1A, B). As a quantitative parameter of ICG's cerebral exposure we used the net (brain-ear) area under the emission intensity-time curve from 0.2 hours to 3.0 hours after injection (AUC9-180 min brain-ear). The AUC values were 10×109 and 4.4×10⁹ minutes photons-1 second-1 steradian-1 microwatt-1 (min p s-1 sr-1 mW-1) in ICG treated mice, versus 12.7×10⁹, 15.1×10⁹, and 14.1×10⁹ min p s-1 sr-1 mW-1 in ICG-liposomes treated mice. The apparent half life values were 118.5 and 127.7 min for ICG treated mice; 193.3, 195.7 and 153.2 min for ICG-liposomes treated mice. These values indicate slower clearance of liposomal ICG compared to the free compound. Four hours after injection the mice were sacrificed and organs were ex-vivo imaged by a biomolecular imager. Image analysis demonstrated higher emission of liposomal- compared to free ICG in the blood, brain, liver, spleen and muscle (Figure 1C). These results indicate the advantage of using ICG-liposomes for in vivo optical imaging.
Relationship of emission intensity and day post infection
Organ emission intensity of PbA-infected mice was evaluated as a function of the day post infection (Figure 2). ICG-liposomes were injected to naïve and infected mice that were sacrificed four hours later. The organs were harvested and ex vivo imaged. Whereas the blood intensity was persistent throughout the experiment, the brain emission intensity ratio on days six and seven was significantly higher, compared to the previous days. Increased emission intensity was also observed in the liver and kidneys towards the latest stage of CM (Figure 2A). These finding are in correlation with the pathological changes characteristic of these organs at a late stage of infection [37].
Based on these findings, mice that developed CM were compared for relative emission intensity with malaria-infected mice that did not develop CM. In contrast to the profound brain emission intensity in mice with CM (Figure 2B), in infected mice that did not develop CM, the emission intensity was similar to that of naïve controls (Figure 2C). Liver and kidney emission was significantly increased in mice demonstrating CM or anemic malaria compared to naïve mice.
Table 1
Size and Zeta potential of liposomes used in the study.
| Preparation | Size [nm] | Polydispersity index | Zeta potential [mV] | |||
|---|---|---|---|---|---|---|
| w/o ICG | ICG | w/o ICG | ICG | w/o ICG | ICG | |
| Liposomes | 191.7±4 | 196.5±3 | 0.09-0.12 | 0.13-0.15 | -31.7±0.6 | -32.6±0.5 |
| Liposomes-PEG | 192.7±11 | 200.2±3 | 0.06-0.10 | 0.09-0.10 | -22.5±1.3 | -22.6±1.4 |
| Liposomes-rhodamine-B | 155.9±1 | 155.3±0.5 | 0.07-0.12 | 0.08-0.12 | -29.5±1.4 | -30.5±0.4 |
w/o, without; ICG, indocyanine green.
Figure 1
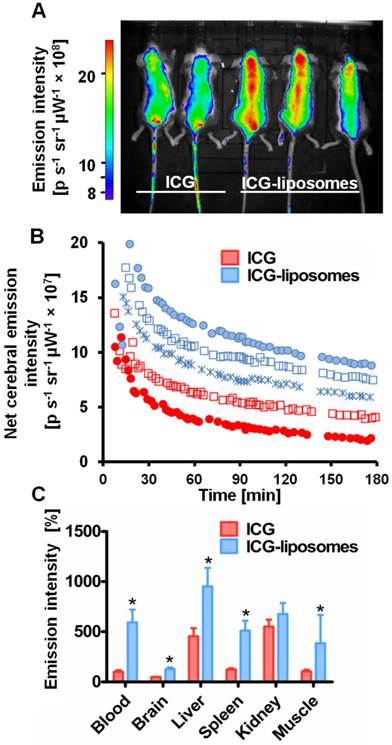
The kinetics of ICG-liposomes compared to free ICG in naïve mice. Liposomes containing ICG or free ICG (both 8 mg/kg; in phosphate buffer pH 7, with 9.3 % sucrose) were injected into the tail vein. A. In vivo image of ICG and ICG-liposomes emission. Image was obtained one hour after injection. Mice treated with the ICG-liposomes show greater emission intensity compared to control mice (indicated by yellow and red colors). B. In vivo cerebral ICG emission intensity as a function of time; n=2 for free ICG and n=3 for ICG-liposomes. Values indicate brain-ear emission of individual mice. C. Ex vivo emission intensity of organs from mice (percent of mean ICG blood intensity). Organs were obtained 4 hours after injection of free ICG (n=6) or ICG-liposomes (n=6). Results are presented as mean ± SD, *p < 0.01, Mann-Whitney test.
Figure 2
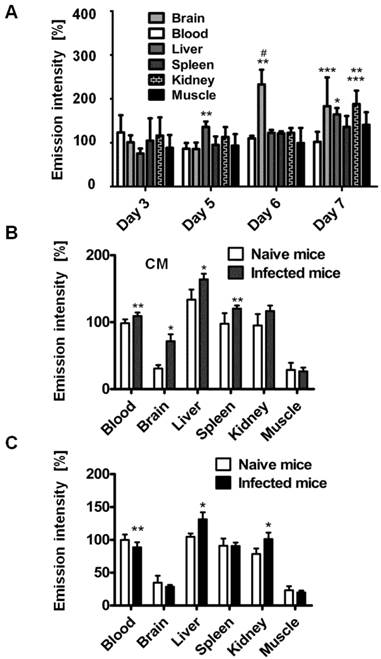
Kinetics of ICG-liposomes in infected mice. A. Time course of emission of ICG-liposomes in mice with ECM. Naïve or infected mice were treated intravenously with ICG-liposomes (200 µL, 8 mg/kg, n=6 per group) on day 3, 5, 6 or 7 post infection with PbA. Organs were imaged ex vivo four hours after marker injection. Shown are infected/naïve mice organ emission intensity ratios. Mean ± SD, *p < 0.01 and **p < 0.05 compared to day 3, respectively, #p < 0.01 and ***p < 0.05 compared to day 5 of the corresponding organ, Kruskal-Wallis Test. B. Ex vivo emission intensity of organs from ICG-liposomes-treated naïve mice and mice with ECM on day 6 post infection. Organs were collected 4 hours after injection of ICG-liposomes to naïve (n=6) or infected mice (n=6). Organ values are percent of mean blood intensity of mice treated with ICG-liposomes. *p<0.01, **p<0.05, Mann-Whitney test. C. Ex vivo emission intensity of ICG-liposomes treated naïve mice and mice with anemic malaria (non-ECM) on day 6 post infection. Organs were collected 4 hours after injection of ICG-liposomes to naïve (n=8) or infected mice (n=7). Values are percent of mean blood intensity of naïve mice. *p<0.01, **p<0.05, Mann-Whitney test.
Therapeutic monitoring
ICG-liposome fluorescence was evaluated as a marker for monitoring therapy effectiveness. Artemisone was chosen as a reference anti-malarial drug, capable of preventing CM [31]. The mice treated with the vehicle presented early signs of CM, ruffled coat and hunching. In contrast, the artemisone-treated mice did not develop these typical neurological symptoms and in their blood smears there were no detectable parasites. Imaging with ICG-liposomes revealed high emission intensity in the brains of control infected mice compared to the drug-treated mice (Figure 3A,B). Accordingly, the AUC values of untreated mice were higher compared to those of the treated mice (n=5 for each group) (Figure 3C).
Figure 3
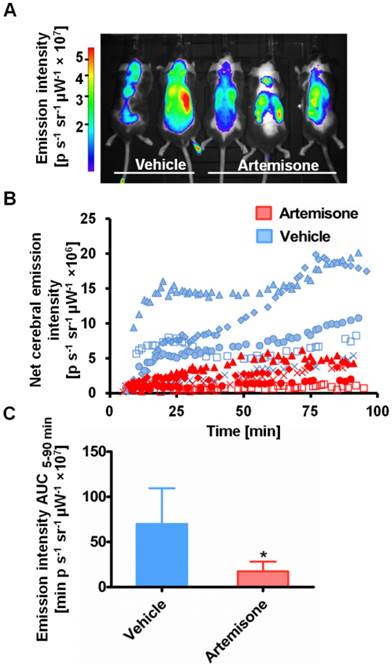
Emission intensity of ICG-liposomes in artemisone- and vehicle-treated mice infected with PbA on day 6 post infection. A. A representative in vivo image acquired ten minutes after injection of ICG-liposomes. B. In vivo emission of ICG-liposomes as a function of time in the brains of the mice shown in A (n=5). C. Net brain (brain-ear) area under the emission intensity-time curve values of artemisone-treated and vehicle-treated mice (n=5 per group), over 5-90 minutes after ICG-liposome injection. *p < 0.05, Mann-Whitney test.
Role of phagocytes in accumulation of liposomes in CM
Histology and immunohistochemistry
The localization of the ICG-liposomes within the brain tissue was evaluated by confocal microscopy (Figure 4). Brains of PbA-infected mice depicted by vessels occluded by phagocytes, as shown by co-localization of the monocyte marker Iba1 and the endothelial marker CD31 (Figure 4B,F). In addition, activated phagocytes with amoeboid-like appearance were extensively stained with Iba1 (Figure 4B,D,F). Rhodamine B-associated fluorescence was seen in monocytes (Figure 4B), in perivascular phagocytes (Figure 4D,F), and, to a lesser extent, in proximity to endothelial cells (Supplementary Material: Figure S2). The rhodamine B fluorescence and pathologic findings were not seen in the corresponding brain regions of naïve mice (Figure 4A,C,E). Similar findings were observed in other areas of the brain of the sick mice (data not shown).
In vitro uptake of dually labeled liposomes by phagocytic cells
Liposome uptake was characterized in vitro using the murine monocyte cell line RAW 264.7. Cells were incubated with liposomes dually labeled by covalently bound rhodamine B and by passively adsorbed ICG. The emission intensity of both fluorescent markers was measured by a biomolecular imager. Liposomes were rapidly uptaken by the cells and achieving saturation at approximately 4 hours (Supplementary Material: Figure S3). The uptake profile was similar for both markers.
Monocyte migration
In order to understand whether the labeled liposomes are carried by peripheral monocytes towards the inflamed brain, we used liposome-loaded RAW 246.7 cells. The cells were injected into the tail vein of naïve and PbA-infected mice six days post infection. Four hours after liposome injection the mice were sacrificed and brains were ex vivo imaged. The emission intensity was higher in the infected mice than in controls in all tissues except for the kidneys (Figure 5A). The results suggest increased migration of phagocytes to affected organs.
The effect of liposome PEGylation on imaging outcome
To further study the mechanism of ICG-liposome accumulation in the brain, PEGylated (PEG-ICG-liposomes) or non-PEGylated liposomes (ICG-liposomes) were injected to naïve and infected mice. Non-PEGylated liposomes, unlike PEGylated ones enable distinguishment of CM using ICG emission. The differences that were observed in the brains were not detected in the blood of infected and naïve mice (Figure 5B). Hence, PEGylation interferes with CM detection.
Discussion
Pathophysiologic changes characteristic of CM include disruption of the blood-brain barrier (BBB) [37, 38] and reduced cerebral blood flow due to occlusion by parasitized erythrocytes, various leucocytes and platelets. These add to inflammatory responses mediated by different endothelial cell surface receptors [30, 37, 39, 40], and increased phagocytic activity within the CNS [19, 29, 30]. We utilized some of these changes to provide a proof of concept for the detectability of CM by NIR imaging of ICG-liposomes. In particular, monocytes are known for their ability to internalize foreign matter, thereby providing an attractive target for liposome-based therapeutic approaches for a variety of clinical conditions [41].
In experimental models, cerebral complications develop gradually during the first week post infection, in parallel with BBB impairment [42, 43]. A cascade of physiological, biochemical and immunological events is responsible for the increased severity of the cerebral syndrome. Our findings of elevated emission using the ICG-liposomes as a marker for CM, are in correlation with the chronological changes. In man, CM-related clinical deterioration usually develops 3-7 days after fever onset, although there have been rare reports of nonimmune patients dying within 24 hours of developing symptoms [44]. Due to similarity of symptoms in malaria and other diseases [6] patients harboring malaria may be misdiagnosed. CM is diagnosed by the existence of P. falciparum and functional changes. There is no biological test available to confirm human CM [45].
Figure 4
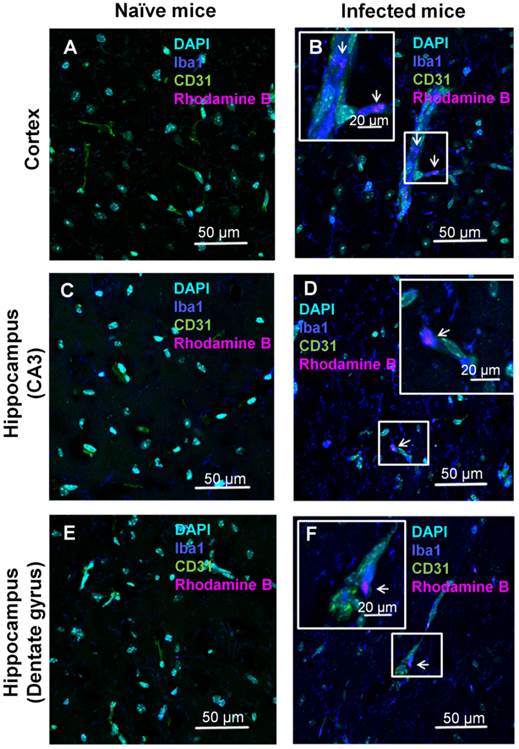
Confocal microscopy analyses of brain localization of intravenously injected ICG-liposomes. Naive or PbA-infected mice were intravenously treated with ICG-rhodamine B liposomes (200 µL; 8 mg/kg, n=3) on day six post infection. Brains were collected four hours after injection. Shown is the florescence of DAPI (a nuclei marker), Iba1 (a phagocyte marker), CD31 (an endothelial cell marker) and the liposomal rhodamine B. Brain regions studied were the barrel field cortex (A,B), hippocampal CA3 (C,D), and hippocampal dentate gyrus (E,F) of naïve (A,C,E) and CM depicting mice (B,D,F). Phagocytes-occluded vessels (as shown by co-localization Iba1 and CD31) were observed in infected (B,F) but not control mice. In infected mice, rhodamine B-associated fluorescence was detected within monocytes (B) and perivascular phagocytes (D,F). Magnification x 60. The boxed areas were digitally enlarged. The arrows point at activated phagocyte Iba1 stain co-localizing with rhodamine-B.
Figure 5
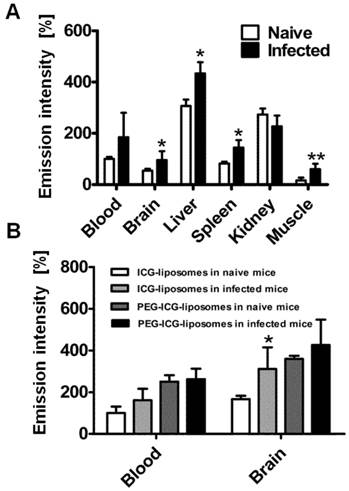
Role of phagocytes in accumulation of liposomes in CM. All mice were treated with liposomes (200 µL; 8 mg/kg ICG). Tissues were scanned ex vivo four hours after liposome injection. The emission intensity values represent percent of organ emission in relation to mean blood intensity of ICG-liposomes-treated naïve mice. A. Ex vivo emission intensity of naïve and infected mouse organs injected intravenously with RAW 264.7 cells. (naïve mice, n=4; infected mice, n=6). Mean ± SD, *p < 0.01,**p < 0.05, Mann-Whitney test. B. Ex vivo emission of organs from naïve and infected mice treated with PEGylated (PEG-ICG-liposomes) and non-PEGylated (ICG-liposomes) liposomes. Naïve and infected mice were treated intraperitoneally with ICG-liposomes or with ICG-PEG-liposomes (n=5 for the naïve mice treated with ICG-liposomes; n=6 for each of the other three groups). Mean ± SD, * p < 0.05 compared to naïve mice treated with ICG-liposomes, Mann-Whitney Test.
Our results from both the in vivo and ex vivo experiments, in a reliable model of CM [33], indicate modified pharmacokinetics, higher emission intensity and consequently preferable imaging properties of ICG-liposomes compared to those of free ICG. Similar quantities of ICG as a free marker or adsorbed to the liposomes were injected. However, throughout the in vivo experiment, the resulting emission intensity in the brain was higher in mice injected with the liposomal agent. The difference might be explained by modified clearance of liposomal ICG compared to free ICG, in accordance with increased half life of the liposomal ICG and with the established extended circulation time of liposomal preparations [46]. The emission decline over time might be due to both clearance, and leakage from the liposomes. In addition, the difference in emission in different organs (ex vivo) might be due to increased phagocytosis in these organs, even in naïve mice. This difference intensifies in infected mice (Figure 2B and Supplementary Material: Figure S4). The results also demonstrate that liposomal ICG provides an effective indicator for successful treatment of CM, as demonstrated by the higher brain emission intensity in vehicle-treated - compared to artemisone - treated mice.
Histological analyses of the brains were performed to validate the hypothesis that the improved detection is due to extensive phagocytosis. CM lesions are widely spread over the brain. Using liposomal ICG we could demonstrate in representative brain areas of the hippocampus and the cortex, changes characteristic of CM pathology, that were not found in the naïve mice. The vascular sequestration by phagocytes is in line with previously reported findings [19, 29, 30]. The activated phagocytes in proximity of blood vessels might be perivascular macrophages or microglia with amoeboid-like appearance with extensive Iba1 staining that were redistributed towards inflamed blood vessels [29, 47] or perivascular macrophages [19] that share the same antigens. Some liposomes labeled with rhodamine B were clearly associated with monocytes because Iba1 staining was limited to the vascular space. Microglia could interact with ICG-liposomes leaking through compromised blood vessels [37, 38]. The higher uptake of particles by phagocytes during inflammation in contrast with healthy volunteers has been reported previously [48]. The phagocytosis might be enhanced through induction of encoded pattern recognition receptors [49] which mediate phagocytosis [50]. It has been suggested that monocytes migrating to the brain vasculature in infected mice participate in CM induction [22, 51] . As blood monocytes are continuously recruited to sites of inflammation, this homing property might be utilized for theranostics [52]. Similarly, both human and experimental cerebral malaria are associated with recruitment of large number of activated macrophages [19, 53]. This mechanism was exploited as a Trojan horse to deliver drugs and imaging agents to the disease site [52]. The rhodamine B fluorescence observed in association with capillaries may also be representative of blood vessel occlusion or material phagocytized by endothelial cells. All those findings were seen exclusively in infected mice.
To evaluate the possibility of uptake of liposomes by peripheral phagocytes, RAW 264.7 cells loaded with ICG-liposomes were injected to infected mice on day six post infection. The accumulation of the labeled liposomes in the brains of the infected mice support the hypothesis of liposome uptake and transport to the brain, mediated by monocytes. This assumption was further supported by using PEGylated versus non-PEGylated liposomal ICG (the latter is the one used throughout all other experiments) where the non-PEGylated liposomes accumulation in brains of infected mice was more pronounced. In general, PEGylation of liposomes decreases phagocytosis [54] in accordance with diminished difference between infected and naïve mice.
Besides brain injury, malaria causes multi organ dysfunction [37, 55]. The liver and the spleen are enlarged in both humans and murine models of malaria [37, 56]. Organ enlargement is due to congestion with parasitic pigment (hemozoin) and enhanced recruitment of monocytes and lymphocytes [37]. Hence, the higher emission of ICG-liposomes in both liver and spleen that was observed in our study is likely due to increased phagocyte activity in these organs. Apparently, these changes occur in malaria that is caused by other species of plasmodium as well [57] and therefore only the emission changes in the brain are indicative of CM.
NIR imaging is limited by the depth of signal penetration (normally a few millimeters) [12, 13]. However, because CM is a diffuse brain disease, superficial brain regions or the retina may be monitored by simple devices placed on the patient's head, that are currently being used or evaluated for other CNS-related applications [14, 58]. ICG may be released from the liposomal bilayer and bind to plasma proteins as a function of its membrane/medium partition coefficient [59]. Using more stable liposome formulations may prevent the leakage. Alternatively, more accurate results could be achieved by applying hydrophilic dyes with low non-specific binding and rapid clearance, entrapped in the aqueous compartment of liposomes. Nevertheless, our results using liposomal ICG for CM detection provide a proof of concept for this methodology. In addition, a main advantage of this system is that all its components are FDA-approved for medical application.
Conclusion
Profound accumulation of liposomal ICG in brains of mice depicting CM may provide a new tool for differential diagnosis of CM. The technology could also be valuable for monitoring the efficacy of antimalarial therapy in CM. Increased ICG emission is likely due to uptake of the labeled liposomes by phagocytes through the disrupted BBB that accompanies CM. In addition to the potential of the ICG-liposomes in improving CM diagnosis and therapeutic monitoring, the results support the notion that migrating phagocytes have a role in induction of CM. We expect that the presented approach will be applicable also for other diseases that are characterized by inflammation and blood vessel occlusion.
Abbreviations
AUC: area under the concentration-time curve; BBB: blood-brain barrier; CM: cerebral malaria; DAPI: 4',6-Diamidino-2-phenylindole; ECM: experimental cerebral malaria; ICG: indocyanine green; IVIS: in vivo imaging system; MRI: magnetic resonance imaging; NIR: near infrared; PbA: Plasmodium berghei ANKA; PBS: phosphate buffered saline; PET: positron emission tomography; PEG: polyethylene glycol; PFA: paraformaldehyde.
Supplementary Material
Figures S1- S4.
Acknowledgements
We thank Cipla for the kind donation of artemisone. Dr. Boaz Tirosh is acknowledged for the RAW 246.7 cells. We thank Ms. Lola Weiss and Dr. Yael Kalisman for excellent technical help. This work was supported by a research grant from GIP-DFG to Jacob Golenser.
This work is submitted in partial fulfillment of the requirements of the Hebrew University towards the Ph.D. degree of Emma Portnoy.
S. Eyal is affiliated with the David R. Bloom Centre for Pharmacy and Dr. Adolf and Klara Brettler Centre for Research in Molecular Pharmacology and Therapeutics at The Hebrew University.
Competing Interests
The authors have declared that no competing interest exists.
References
1. WHO. Malaria. 2015.
2. Marsh K, Snow RW. Malaria transmission and morbidity. Parassitologia. 1999;41:241-6
3. Malaguarnera L, Musumeci S. The immune response to Plasmodium falciparum malaria. Lancet Infect Dis. 2002;2:472-8
4. Idro R, Marsh K, John CC, Newton CR. Cerebral malaria: mechanisms of brain injury and strategies for improved neurocognitive outcome. Pediatr Res. 2010;68:267-74
5. Tangpukdee N, Krudsood S, Kano S, Wilairatana P. Falciparum malaria parasitemia index for predicting severe malaria. Int J Lab Hematol. 2012;34:320-7
6. Pasvol G. The treatment of complicated and severe malaria. Br Med Bull. 2005;75-76:29-47
7. Rasalkar DD, Paunipagar BK, Sanghvi D, Sonawane BD, Loniker P. Magnetic resonance imaging in cerebral malaria: a report of four cases. Br J Radiol. 2011;84:380-5
8. Looareesuwan S, Laothamatas J, Brown TR, Brittenham GM. Cerebral malaria: a new way forward with magnetic resonance imaging (MRI). Am J Trop Med Hyg. 2009;81:545-7
9. Patankar TF, Karnad DR, Shetty PG, Desai AP, Prasad SR. Adult cerebral malaria: prognostic importance of imaging findings and correlation with postmortem findings. Radiology. 2002;224:811-6
10. Potchen MJ, Kampondeni SD, Seydel KB, Birbeck GL, Hammond CA, Bradley WG. et al. Acute brain MRI findings in 120 Malawian children with cerebral malaria: new insights into an ancient disease. AJNR Am J Neuroradiol. 2012;33:1740-6
11. Sugiyama M, Ikeda E, Kawai S, Higuchi T, Zhang H, Khan N. et al. Cerebral metabolic reduction in severe malaria: fluorodeoxyglucose-positron emission tomography imaging in a primate model of severe human malaria with cerebral involvement. Am J Trop Med Hyg. 2004;71:542-5
12. James ML, Gambhir SS. A molecular imaging primer: modalities, imaging agents, and applications. Physiol Rev. 2012;92:897-965
13. Mann A, Semenenko I, Meir M, Eyal S. Molecular imaging of membrane transporters' activity in cancer: a picture is worth a thousand tubes. AAPS J. 2015
14. Zhao Y, MacCormick IJ, Parry DG, Beare NA, Harding SP, Zheng Y. Automated Detection of Vessel Abnormalities on Fluorescein Angiogram in Malarial Retinopathy. Sci Rep. 2015;5:11154
15. Ploemen IH, Prudencio M, Douradinha BG, Ramesar J, Fonager J, van Gemert GJ. et al. Visualisation and quantitative analysis of the rodent malaria liver stage by real time imaging. PLoS One. 2009;4:e7881
16. Baptista FG, Pamplona A, Pena AC, Mota MM, Pied S, Vigario AM. Accumulation of Plasmodium berghei-infected red blood cells in the brain is crucial for the development of cerebral malaria in mice. Infect Immun. 2010;78:4033-9
17. Franke-Fayard B, Janse CJ, Cunha-Rodrigues M, Ramesar J, Buscher P, Que I. et al. Murine malaria parasite sequestration: CD36 is the major receptor, but cerebral pathology is unlinked to sequestration. Proc Natl Acad Sci U S A. 2005;102:11468-73
18. Baer K, Klotz C, Kappe SH, Schnieder T, Frevert U. Release of hepatic Plasmodium yoelii merozoites into the pulmonary microvasculature. PLoS Pathog. 2007;3:e171
19. Nacer A, Movila A, Sohet F, Girgis NM, Gundra UM, Loke P. et al. Experimental cerebral malaria pathogenesis-hemodynamics at the blood brain barrier. PLoS Pathog. 2014;10:e1004528
20. Cabrales P, Zanini GM, Meays D, Frangos JA, Carvalho LJ. Murine cerebral malaria is associated with a vasospasm-like microcirculatory dysfunction, and survival upon rescue treatment is markedly increased by nimodipine. Am J Pathol. 2010;176:1306-15
21. Frevert U, Engelmann S, Zougbede S, Stange J, Ng B, Matuschewski K. et al. Intravital observation of Plasmodium berghei sporozoite infection of the liver. PLoS Biol. 2005;3:e192
22. Pai S, Qin J, Cavanagh L, Mitchell A, El-Assaad F, Jain R. et al. Real-time imaging reveals the dynamics of leukocyte behaviour during experimental cerebral malaria pathogenesis. PLoS Pathog. 2014;10:e1004236
23. Luo S, Zhang E, Su Y, Cheng T, Shi C. A review of NIR dyes in cancer targeting and imaging. Biomaterials. 2011;32:7127-38
24. Nguyen QT, Tsien RY. Fluorescence-guided surgery with live molecular navigation-a new cutting edge. Nat Rev Cancer. 2013;13:653-62
25. Dzurinko VL, Gurwood AS, Price JR. Intravenous and indocyanine green angiography. Optometry. 2004;75:743-55
26. Still JM, Law EJ, Klavuhn KG, Island TC, Holtz JZ. Diagnosis of burn depth using laser-induced indocyanine green fluorescence: a preliminary clinical trial. Burns. 2001;27:364-71
27. Portnoy E, Lecht S, Lazarovici P, Danino D, Magdassi S. Cetuximab-labeled liposomes containing near-infrared probe for in vivo imaging. Nanomedicine. 2011;7:480-8
28. Portnoy E, Nizri E, Golenser J, Shmuel M, Magdassi S, Eyal S. Imaging the urinary pathways in mice by liposomal indocyanine green. Nanomedicine Epub Mar 16. 2015
29. Jennings VM, Lal AA, Hunter RL. Evidence for multiple pathologic and protective mechanisms of murine cerebral malaria. Infect Immun. 1998;66:5972-9
30. Hearn J, Rayment N, Landon DN, Katz DR, de Souza JB. Immunopathology of cerebral malaria: morphological evidence of parasite sequestration in murine brain microvasculature. Infect Immun. 2000;68:5364-76
31. Waknine-Grinberg JH, Hunt N, Bentura-Marciano A, McQuillan JA, Chan HW, Chan WC. et al. Artemisone effective against murine cerebral malaria. Malar J. 2010;9:227
32. Martins YC, Smith MJ, Pelajo-Machado M, Werneck GL, Lenzi HL, Daniel-Ribeiro CT. et al. Characterization of cerebral malaria in the outbred Swiss Webster mouse infected by Plasmodium berghei ANKA. Int J Exp Pathol. 2009;90:119-30
33. Hunt NH, Grau GE, Engwerda C, Barnum SR, van der Heyde H, Hansen DS. et al. Murine cerebral malaria: the whole story. Trends Parasitol. 2010;26:272-4
34. Waknine-Grinberg JH, Even-Chen S, Avichzer J, Turjeman K, Bentura-Marciano A, Haynes RK. et al. Glucocorticosteroids in nano-sterically stabilized liposomes are efficacious for elimination of the acute symptoms of experimental cerebral malaria. PLoS One. 2013;8:e72722
35. Curfs JH, Hermsen CC, Meuwissen JH, Eling WM. Immunization against cerebral pathology in Plasmodium berghei-infected mice. Parasitology. 1992;105( Pt 1):7-14
36. Brynskikh AM, Zhao Y, Mosley RL, Li S, Boska MD, Klyachko NL. et al. Macrophage delivery of therapeutic nanozymes in a murine model of Parkinson's disease. Nanomedicine (Lond). 2010;5:379-96
37. Medana IM, Chaudhri G, Chan-Ling T, Hunt NH. Central nervous system in cerebral malaria: 'Innocent bystander' or active participant in the induction of immunopathology? Immunol Cell Biol. 2001;79:101-20
38. Renia L, Howland SW, Claser C, Charlotte Gruner A, Suwanarusk R, Hui Teo T. et al. Cerebral malaria: mysteries at the blood-brain barrier. Virulence. 2012;3:193-201
39. Hunt NH, Golenser J, Chan-Ling T, Parekh S, Rae C, Potter S. et al. Immunopathogenesis of cerebral malaria. Int J Parasitol. 2006;36:569-82
40. Pino P, Taoufiq Z, Nitcheu J, Vouldoukis I, Mazier D. Blood-brain barrier breakdown during cerebral malaria: suicide or murder? Thromb Haemost. 2005;94:336-40
41. Ahsan F, Rivas IP, Khan MA, Torres Suarez AI. Targeting to macrophages: role of physicochemical properties of particulate carriers-liposomes and microspheres-on the phagocytosis by macrophages. J Control Release. 2002;79:29-40
42. Sanni LA, Rae C, Maitland A, Stocker R, Hunt NH. Is ischemia involved in the pathogenesis of murine cerebral malaria? Am J Pathol. 2001;159:1105-12
43. Guo J, Waknine-Grinberg JH, Mitchell AJ, Barenholz Y, Golenser J. Reduction of experimental cerebral malaria and its related proinflammatory responses by the novel liposome-based beta-methasone nanodrug. Biomed Res Int. 2014;2014:292471
44. Trampuz A, Jereb M, Muzlovic I, Prabhu RM. Clinical review: Severe malaria. Crit Care. 2003;7:315-23
45. Canavese M, Spaccapelo R. Protective or pathogenic effects of vascular endothelial growth factor (VEGF) as potential biomarker in cerebral malaria. Pathog Glob Health. 2014;108:67-75
46. Drummond DC, Meyer O, Hong K, Kirpotin DB, Papahadjopoulos D. Optimizing liposomes for delivery of chemotherapeutic agents to solid tumors. Pharmacol Rev. 1999;51:691-743
47. Desruisseaux MS, Gulinello M, Smith DN, Lee SC, Tsuji M, Weiss LM. et al. Cognitive dysfunction in mice infected with Plasmodium berghei strain ANKA. J Infect Dis. 2008;197:1621-7
48. Lay JC, Alexis NE, Zeman KL, Peden DB, Bennett WD. In vivo uptake of inhaled particles by airway phagocytes is enhanced in patients with mild asthma compared with normal volunteers. Thorax. 2009;64:313-20
49. Mantovani A, Sica A, Sozzani S, Allavena P, Vecchi A, Locati M. The chemokine system in diverse forms of macrophage activation and polarization. Trends Immunol. 2004;25:677-86
50. Kerrigan AM, Brown GD. C-type lectins and phagocytosis. Immunobiology. 2009;214:562-75
51. Mac-Daniel L, Menard R. Plasmodium and mononuclear phagocytes. Microb Pathog. 2015;78:43-51
52. Patel SK, Janjic JM. Macrophage targeted theranostics as personalized nanomedicine strategies for inflammatory diseases. Theranostics. 2015;5:150-72
53. Medana IM, Turner GD. Human cerebral malaria and the blood-brain barrier. Int J Parasitol. 2006;36:555-68
54. Harris JM, Martin NE, Modi M. Pegylation: a novel process for modifying pharmacokinetics. Clin Pharmacokinet. 2001;40:539-51
55. Yeo TW, Lampah DA, Kenangalem E, Tjitra E, Price RN, Anstey NM. Impaired skeletal muscle microvascular function and increased skeletal muscle oxygen consumption in severe falciparum malaria. J Infect Dis. 2013;207:528-36
56. Basir R, Rahiman SF, Hasballah K, Chong W, Talib H, Yam M. et al. Plasmodium berghei ANKA Infection in ICR Mice as a Model of Cerebral Malaria. Iran J Parasitol. 2012;7:62-74
57. Stevenson MM, Kraal G. Histological changes in the spleen and liver of C57BL/6 and A/J mice during Plasmodium chabaudi AS infection. Exp Mol Pathol. 1989;51:80-95
58. Obrig H. NIRS in clinical neurology - a 'promising' tool? Neuroimage. 2014;85:535-46
59. Barenholz Y. Doxil®-the first FDA-approved nano-drug: lessons learned. J Control Release. 2012;160:117-34
Author contact
![]() Corresponding author: Jacob Golenser, Department of Microbiology and Molecular Genetics, Faculty of Medicine, The Hebrew University of Jerusalem, Jerusalem, 91120, Israel. E-mail: golenserhuji.ac.il
Corresponding author: Jacob Golenser, Department of Microbiology and Molecular Genetics, Faculty of Medicine, The Hebrew University of Jerusalem, Jerusalem, 91120, Israel. E-mail: golenserhuji.ac.il
Citation styles
APA
Portnoy, E., Vakruk, N., Bishara, A., Shmuel, M., Magdassi, S., Golenser, J., Eyal, S. (2016). Indocyanine Green Liposomes for Diagnosis and Therapeutic Monitoring of Cerebral Malaria. Theranostics, 6(2), 167-176. https://doi.org/10.7150/thno.13653.
ACS
Portnoy, E.; Vakruk, N.; Bishara, A.; Shmuel, M.; Magdassi, S.; Golenser, J.; Eyal, S. Indocyanine Green Liposomes for Diagnosis and Therapeutic Monitoring of Cerebral Malaria. Theranostics 2016, 6 (2), 167-176. DOI: 10.7150/thno.13653.
NLM
Portnoy E, Vakruk N, Bishara A, Shmuel M, Magdassi S, Golenser J, Eyal S. Indocyanine Green Liposomes for Diagnosis and Therapeutic Monitoring of Cerebral Malaria. Theranostics 2016; 6(2):167-176. doi:10.7150/thno.13653. https://www.thno.org/v06p0167.htm
CSE
Portnoy E, Vakruk N, Bishara A, Shmuel M, Magdassi S, Golenser J, Eyal S. 2016. Indocyanine Green Liposomes for Diagnosis and Therapeutic Monitoring of Cerebral Malaria. Theranostics. 6(2):167-176.
This is an open access article distributed under the terms of the Creative Commons Attribution (CC BY-NC) License. See http://ivyspring.com/terms for full terms and conditions.