Theranostics
13.3
Impact Factor
- Current Issue
- Advance Articles
- Volume 16; 2026
- Volume 15; 2025
- Volume 14; 2024
- Volume 13; 2023
- Volume 12; 2022
- Archive
- Cover Images
- Cover Suggestion
- Special Issues
Top
Introduction
Materials and Methods
Results
Discussion
Conclusion
Supplementary Material
Abbreviation
Acknowledgements
References
Introduction
Materials and Methods
Results
Discussion
Conclusion
Supplementary Material
Abbreviation
Acknowledgements
References
International Journal of Biological Sciences
International Journal of Medical Sciences
 Global reach, higher impact

Theranostics 2015; 5(7):733-745. doi:10.7150/thno.10305 This issue Cite
Research Paper
Circulating MiR-16-5p and MiR-19b-3p as Two Novel Potential Biomarkers to Indicate Progression of Gastric Cancer
Jingpu Zhang1*, Yang Song2*, Chunlei Zhang1, Xiao Zhi1, Hualin Fu1,3, Yue Ma1, Yunsheng Chen1, Fei Pan1,3, Kan Wang1, Jian Ni1,3, Weilin Jin1,3, Xianli He2 ![]() , Haichuan Su2
, Haichuan Su2 ![]() , Daxiang Cui1,3
, Daxiang Cui1,3 ![]()
1. Institute of Nano Biomedicine and Engineering, Key Laboratory for Thin Film and Microfabrication of the Ministry of Education, Department of Instrument Science and Engineering, School of Electronic Information and Electrical Engineering, Shanghai Jiao Tong University, 800 Dongchuan Road, Shanghai, 200240, P. R. China
2. Gastrointestinal Division, Tangdu Hospital, Fourth Military Medical University, 569 Xinsi Road, Xi'an, 710038, P. R. China
3. National Center for Translational Medicine, Shanghai Jiao Tong University, 800 Dongchuan Road, Shanghai, 200240, P. R. China
* Identical contribution to this paper.
Received 2014-8-9; Accepted 2015-2-26; Published 2015-4-5
Citation:
Zhang J, Song Y, Zhang C, Zhi X, Fu H, Ma Y, Chen Y, Pan F, Wang K, Ni J, Jin W, He X, Su H, Cui D. Circulating MiR-16-5p and MiR-19b-3p as Two Novel Potential Biomarkers to Indicate Progression of Gastric Cancer. Theranostics 2015; 5(7):733-745. doi:10.7150/thno.10305. https://www.thno.org/v05p0733.htm
Other stylesAbstract

Gastric cancer (GC) is the second most common cancer in China and the second leading cause of cancer-related death in the world. Identifying circulating biomarkers is helpful to improve theranostics of gastric cancer. Herein, we are for the first time to report miR-16-5p and miR-19b-3p were identified to be the novel potential plasma biomarkers to detect gastric cancer. Differentially expressed miRNAs were initially screened out by genome-wide miRNA profiling microarrays between 16 plasma samples of gastric cancer and 18 matched normal controls, and then were quantified and validated by quantitative reverse transcription-PCR method between 155 gastric cancer cases and 111 normal controls. Additionally, 30 plasma samples from precancerous lesions and 18 paired samples from gastric cancer patients with gastrectomy were further detected. Results showed that based on two normalization methods, miR-16-5p and miR-19b-3p in plasma were found to be capable of distinguishing normal population from GC cases with different TNM stages and differentiation grades, particularly including the early cancer cases (P<0.05). And the two miRNAs were down-regulated in GC cases (FC<0.5). Especially, the down-regulation degree was correlated with the progression of the GC cases from the early stage to the advanced stage (0.2< rs<0.3, P<0.01). And the same weak down-regulation of the two biomarkers as the early GC occurred initially in the precancerous diseases (P<0.05). The corresponding performance of the two miRNAs to detect GC in ROC analysis gradually performed better with the disease progression from the earlier stages or lower grades to the advanced stages (TNM Ⅳ stage: AUC=0.832 for miR-16-5p; TNM Ⅲ stage: AUC=0.822 for miR-19b-3p) or high grade (Poorly differentiated: AUC=0.801, 0.791 respectively for miR-16-5p and miR-19b-3p). Additionally, miR-19b-3p remained down-regulated in patient plasma within 9 days after gastrectomy. In conclusion, miR-19b-3p and miR-16-5p maybe prospective biomarkers to detect gastric cancer and indicate its progression, and thus may own great potential in applications such as early screening and progression evaluation of gastric cancer in the near future.
Keywords: miR-16-5p, miR-19b-3p, circulating microRNA biomarker, gastric cancer, miRNA profiling microarray, quantitative reverse transcription-PCR
Introduction
Gastric cancer (GC) is currently the fourth most common cancer and the second leading cause for cancer-related deaths worldwide [1]. According to the annual report on status of cancer in China in 2010 [2], GC was ranked as the second among the most common cancers and the third leading causes of death in China. No typical symptoms suggestive of gastric cancer exist until the cancer is advanced [3], leading to a great difficulty in early gastric cancer diagnosis. And the limited treatment modalities for current clinical applications make GC a very poor prognosis with 5-year survivals below 24% [4]. In general, it is imperative to develop rational approaches for diagnosis and prognosis of gastric cancer to improve gastric cancer's detection and treatment. Tumor circulation biomarkers including serological markers undoubtedly provide a noninvasive and highly practical method to assess GC, etc. [5]. However, the currently known tumor biomarkers either in the sera (CEA, CA19.9, CA72.4, CA50) or in the gastric juice (CEA, CA19.9, fetal sulfoglycoprotein) have been found to exhibit low sensitivity and specificity in gastric cancer diagnosis [3, 6]. Therefore, more studies need to be conducted to screen out other alternative tumor biomarkers [5], and circulating miRNA biomarkers have recently emerged as novel diagnostic and prognostic biomarkers in oncology [7, 8].
MicroRNAs (miRNAs) are endogenous non-coding RNAs with a length of ~22 nt [9, 10], degrading mRNA through precisely complementary pairing or repressing its translation through non-precisely complementary pairing. It is proposed that miRNAs contribute to oncogenesis as tumour suppressors or oncogenes [11]. And miRNAs have been shown to exist not only in frozen and paraffin-embedded tissues [12] or cultured cell-lines [13], but also in human blood (including whole blood, plasma and serum) in a remarkably stable form [14]. Additionally, compared to mRNA expression profiles, miRNA profiles were claimed to be more accurate in cancer classification [15]. All these characteristics strongly push forward miRNA biomarker screening from experimental study into clinical application [8, 16].
Up to date, plenty of circulating miRNA biomarkers have been screened out for diagnosis and prognosis of various kinds of cancers including lung, colorectal, ovarian, pancreatic and other cancers [17]. As for gastric cancer, a number of circulation miRNAs have been found to be dysregulated in GC patients by Solexa sequencing or microarray profiling. And some of them have been identified by quantitative reverse transcription polymerase chain reaction (qRT-PCR) as biomarkers to detect GC, such as miR-106b, let-7a [18], miR-451 and miR-486 [19] in plasma, five-miRNA signatures (miR-1, miR20a miR-27a, miR-34 and miR-423-5p) [20] and miR-378 [21] in serum. However, most of these studies failed to determine at which point in a cancer's evolution these miRNA biomarkers can be detected in the bloodstream, whereas an optimal circulating miRNA biomarker should be able to differentiate different courses in cancer's development [22]. In addition, since different data normalization methods for qRT-PCR were adopted in different assays, which affect the final selection of differentially expressed miRNAs [23], a reliable data normalization method for circulating miRNA study should be explored.
In our current study, with the aim of searching for the novel reliable miRNA biomarkers for GC diagnosis and exploring their relations to the progression of GC, plasma samples from 171 GC patients, 18 paired GC cases with gastrectomy, 30 precancerous (Prec) lesions and 129 normal (N) controls were collected and screened by genome-wide profiling microarray analysis followed by qRT-PCR analysis. Meanwhile, in order to evaluate the stability and validity of the reference miRNAs for data normalization, the expression levels of these miRNAs were analyzed.
Materials and Methods
Sample collection and experimental design
The study was conducted according to the Reporting Recommendations for Tumor Marker Prognostic Studies (REMARK) guidelines [24]. All the plasma samples were collected from Tangdu Hospital (Xi'an, China). In this study, a total of 171 pre-operative patients with gastric cancer (GC) were enrolled from December 6, 2012 to September 23, 2013. Additionally, 18 paired samples for gastric cancer patients with gastrectomy were included from September 28, 2013 to January 7, 2014, and the time interval between pre-operation and post-operation was 1-9 days. Informed consent was obtained from patients in accordance with the guidelines for conduction of clinical research at the Fourth Military Medical University and Tangdu Hospital. All investigational protocols were approved by their Institutional Review Boards. Gastroscopy was done in all patients to obtain the tissue samples. Primary histological examination was performed at the Department of Pathology, Tangdu Hospital. Histological tumor slides were reevaluated by two pathologists, respectively. Before surgery, no patients had received chemotherapy or radiotherapy. Plasma samples were collected one day before surgery. Tumors were staged according to the tumor-node-metastasis staging system of the International Union against Cancer [6, 25]. Histological grade was assessed according to the World Health Organization (WHO) criteria [6]. Most of the GC participants in our study belonged to adenocarcinoma type, in consistency with the epidemiology statistics that this type possesses an overwhelming majority of GC patients [20]. And a group of 129 normal controls (N) collected from January 23, 2013 to September 27, 2013 were recruited from a large pool of people seeking a routine health check-up at Tangdu Hospital. People who were found without any stomach diseases by gastroscopy and detected without abnormal tumor marker levels were selected as GC-free control subjects. Moreover, 30 samples from patients with precancerous lesions (Prec) were added including 20 chronic gastritis individuals, 4 acute gastritis and 6 gastric ulcer cases collected from November 27, 2014 to January 15, 2015.
Figure 1
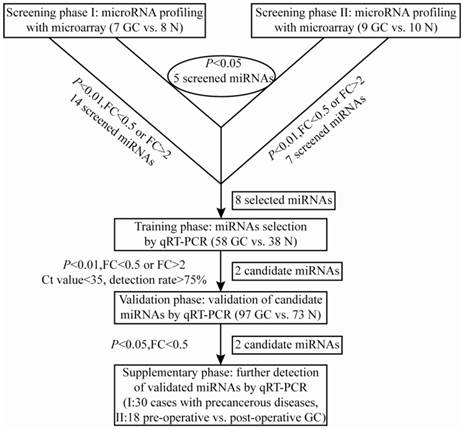
A flow chart of the study design
A multi-stage, case-control study was designed to identify a panel of plasma miRNA biomarkers for gastric cancer. The work flowchart of the study is shown in Fig. 1. The whole study was composed of four phases: screening phase, training phase, validation phase and supplementary phase. In the screening phase, two sets of genome-wide miRNA profilings were conducted by microarrays, which separately contained probes for 1887 human miRNAs in set I (7 GC cases and 8 N controls), and probes for 2007 human miRNAs in set II (9 GC cases and 10 N controls). And a total of 8 differentially expressed miRNAs were selected from microarray analysis for the following evaluation by qRT-PCR. In the initial training phase by qRT-PCR, the selected 8 candidate miRNAs were tested using a pioneering cohort of independent plasma samples including 40 GC patients and 29 N controls. And 2 miRNAs (miR-3940-5p and miR-4298) were found to be undetectable in plasma samples, and the other 6 miRNAs were detectable, of which only miR-16-5p and miR-19b-3p had significantly different expression levels between the GC and control groups. The expression profile of the two individual miRNAs was further evaluated by qRT-PCR on another cohort of 18 GC and 9 N plasma samples. And the combined cohort including 58 GC patients and 38 N controls was employed as the training data set. After that, the consequent 2 miRNAs were further verified by qRT-PCR in the validation phase, which collected plasma samples from 97 GC patients and 73 N controls. Both of the two miRNAs were validated statistically significant between the two groups by Mann-Whitney U test. Finally, in the supplementary phase, the validated 2 miRNAs were tested via qRT-PCR in two independent cohorts of plasma samples from 30 Prec individuals and 18 paired samples from GC patients before and after gastrectomy within 9 days.
Screening miRNAs by Microarray
Human miRNA microarrays (8*60K) V18.0 and V19.0 (Agilent technologies, USA) were separately used in this study for two batches of profiling. The former microarray which contains 1887 human miRNAs probes profiled samples from set I (Fig.1), and the subsequent microarray which contains 2007 human miRNAs probes profiled an independent cohort of set II (Fig.1). A detailed microarray analysis is described in the Supplementary Material.
Plasma preparation, RNA isolation and qRT-PCR assay of screened miRNAs
2-4 mL of peripheral blood from each participant was collected. Total RNA was isolated from 200 μL plasma using mirVana Paris Kit (Ambion, USA) following the manufacturer's protocol. The quantification of miRNA was performed using Taqman probes (Applied Biosystems, USA) and GoTaq Probe qPCR Master Mix (Promega, USA) according to the manufacture's introduction. A detailed experimental protocol is described in the Supplementary Material.
Data normalization and statistical analysis
For qRT-PCR assay, two normalization methods were applied to verify the expression levels of miRNAs. Raw Ct values of each miRNA were processed using either the combined exogenous and endogenous normalization or the single exogenous normalization. Combining the exogenous reference miRNA (spiked-in cel-miR-39) with the endogenous reference miRNA (miR-16-5p), the exogenous and endogenous normalization was done by subtracting the mean Ct value of the two reference miRNAs (ave(c39,h16)) from that of the targeted miRNAs for each subject. And the exogenous normalization was performed by subtracting the Ct value of cel-miR-39 from that of the targeted miRNAs. And the relative expression levels of miRNAs were calculated by the comparative 2-△△Ct method as described previously [26, 27].
Mann-Whitney U test was used for the analysis of differential miRNAs expression between GC and N groups, and Wilcoxon signed rank test was employed for the paired plasma samples before and after gastrectomy. The difference was regarded as significant at the P<0.05 level. Receiver-operating characteristic (ROC) curves and the area under the ROC curve (AUC) were used to assess the performance of the selected miRNAs as biomarkers for GC diagnosis. The optimal cutoff point was determined by Youden index. Spearman rank correlation analysis was conducted to evaluate the relation of miRNA biomarkers to the progression of GC. The statistical analysis herein was applied identically for the two normalization methods described above. SPSS (version 21.0, IBM, USA) software was used to perform all the above statistical analysis.
Results
Characteristics of the subjects
The characteristics of the clinical participants are listed in Table 1. There were a total of 189 GC patients, 129 N controls and 30 Prec individuals in our study. No significant difference was found in the distribution of age and sex among the GC patients in the four phases (screening, training, validation and supplementary phase) or among the N controls in the three phases (screening, training, and validation phase). And in each phase, the distribution of sex was well balanced between GC patients and N controls as well as between Prec individuals and N controls. The number of the male GC patients was nearly twice as large as the female, which was consistent with the global demographic statistics [28]. However, the GC cohort was slightly older than the N controls in each phase due to restrictions in the sampling of healthy participants. The distributions of TNM stages and differentiation grades were respectively similar for participants in the training and validation phases, and those in the screening and supplementary phases.
Table 1
Characteristics of the clinical participants
| Number of GC Clinical and N Participants | ||||||||
|---|---|---|---|---|---|---|---|---|
| Screening phase (16GC vs.18N) | Training phase (58GC vs. 38N) | Validation phase (97GC vs. 73N) | Supplementary phase (18 pre vs. pos) | |||||
| P value | P value | P value | P value | |||||
| GC | ||||||||
| Sex | 0.681a1 0.595a2 | 0.197a1 0.595a2 | 0.453a1 0.595a2 | 0.595a2 | ||||
| male | 10 | 41 | 69 | 15 | ||||
| female | 6 | 17 | 28 | 3 | ||||
| Age: medium (range),y | 58 (38~71) | 0.012b1 0.209b2 | 56 (32~79) | 0.023b1 0.209b2 | 57 (22~81) | 0.000b1 0.209b2 | 61.5 (38~87) | 0.209b2 |
| TNM stage | 0.016c 0.008c 0.548c | 0.016c 0.690 c 0.056 c | 0.008c 0.690 c 0.008 c | 0.548c 0.056 c 0.008 c | ||||
| Ⅰ | 3 | 18 | 15 | 4 | ||||
| Ⅱ | 1 | 10 | 16 | 1 | ||||
| Ⅲ | 9 | 17 | 42 | 5 | ||||
| Ⅳ | 1 | 10 | 15 | 6 | ||||
| unknown | 2 | 3 | 9 | 2 | ||||
| Differentiation grade | 0.057c 0.029 c 0.686c | 0.057c 0.343 c 0.114c | 0.029 c 0.343 c 0.029 c | 0.686c 0.114 c 0.029 c | ||||
| well | 1 | 5 | 12 | 1 | ||||
| moderate | 5 | 24 | 34 | 5 | ||||
| poor | 4 | 22 | 42 | 7 | ||||
| unknown | 6 | 7 | 9 | 5 | ||||
| N | Prec | |||||||
| sex | 0.599a2 | 0.599a2 | 0.599a2 | 0.104a3 | ||||
| male | 10 | 22 | 48 | 14 | ||||
| female | 8 | 16 | 25 | 16 | ||||
| Age: medium (range),y | 53 (25~65) | 0.292b2 | 50 (29~85) | 0.292b2 | 46 (28~71) | 0.292b2 | 58 (18~84) | 0.063b3 |
a1 Two-sided χ2 test of sex between GC and N; a2 Two-sided χ2 test of sex among GC cases in the four phases or N controls in the three phases; a3 Two-sided χ2 test of sex between Prec and N; b1 Student's-t test of age between GC and N; b2 One-way analysis of variance (ANOVA) test of age among GC cases in the four phases or N controls in the three phases; b3 Student's-t test of age between Prec and N; c Mann-Whitney U test between each of the two phases among the training, validation and supplementary phases.
Values in bold type are statistically significant (P<0.05).
Figure 2
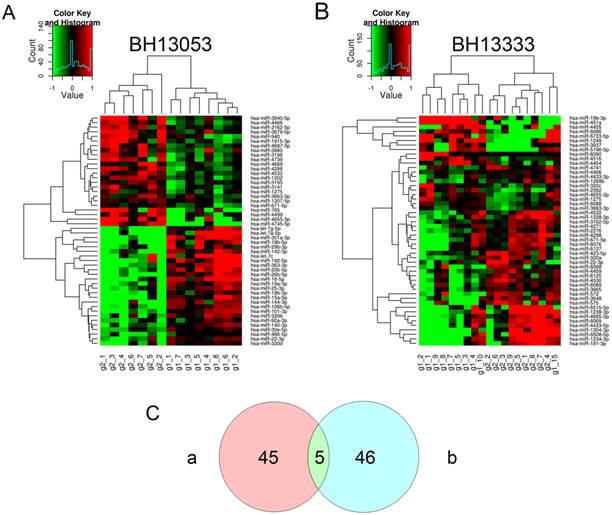
Differentially expressed miRNAs from two sets of microarray profiling. Unsupervised hierarchical cluster analysis for differentially expressed miRNAs identified as significant by t-test (P<0.05) provided by microarray profiling: (A) Set 1 (No., BH13053) comprised of 7 GC cases and 8 normal controls and (B) Set 2 (No., BH13333) comprised of 9 GC cases and 10 normal controls. Samples are shown in columns and miRNAs in rows. The insets are color keys indicating the range of normalized log2-based signals and the histograms of the signals. (C) Two-way Venn diagram indicating the numbers of differentially expressed miRNAs (P<0.05) in Set 1 (a) and Set 2 (b).
Selecting differentially expressed miRNAs in the screening phase by microarray
To initially discover a group of miRNAs from genome-wide profiling of currently published human miRNAs, two batches of microarray assays were conducted with the rapid development of miRBase and the corresponding microarray chip. The hierarchical clusterings of the differentially expressed miRNAs (P<0.05) between GC and N groups from the two sets of microarray analysis were illustrated in Fig. 2. Both of the assays divided the cohorts into two groups, which was generally in consistency with the original GC and N groups. In the two assays 50 and 51 miRNAs were respectively identified with statistical significance at the level of P<0.05. And Venn diagram showed that merely 5 identical miRNAs were identified by both of the two sets (Supplementary Material: Table S2). We can see that the single hsa-miR-19b-3p was down-regulated in GC cases, and the other four miRNAs including hsa-miR-671-5p were up-regulated. To enlarge the candidate miRNAs for qRT-PCR validation, the differentially expressed miRNAs from the independent microarray assays at the level of P<0.01 and FC>2 or <0.5 were included. As shown in Supplementary Material: Table S3, 14 miRNAs were identified as differentially expressed miRNAs in the set of BH13053, while 7 miRNAs were explored in BH13333. Most of the differential miRNAs from BH13053 microarray were previously studied, particularly, let-7a and miR-106b have been identified by Tsujiura as biomarkers in plasma for GC diagnosis [18]. However, a majority of the differentially expressed miRNAs from BH13333 microarray were sequenced as newly identified ones according to miRBase. Although miR-451 was shown to be decreased in gastric and colorectal cancer versus non-tumor tissues [29] and increased in plasma samples from GC patients [19], current reports showed little correlation of the rest of miRNAs discovered by BH13333 with GC or other diseases. Finally, considering the purpose to screen some novel biomarkers based on the steady expression levels of miRNAs in plasma, 6 miRNAs independently discovered by BH13053, and 1 down-regulated miRNA and 1 up-regulated miRNA collectively discovered by BH13053 and BH13333 were selected for the following quantification (Table 2).
Evaluating reference miRNAs in the training and validation phases by qRT-PCR
In order to quantify the level of miRNAs using qRT-PCR, we needed to choose reference miRNAs for the normalization of the expression data. Cel-miR39 and miR-16-5p have been proposed to be used as exogenous or endogenous miRNA controls [14, 17]. To verify whether the two miRNAs was adaptable to be reference miRNAs in our system, we analyzed their expression levels as well as the targeted miRNAs' in the training and validation phases. As shown in Fig. 3A, there were no significant differences of cel-miR-39 and ave(c39, h16) between GC and N groups in the total two phases, indicating that both of the two values would be invariant and available for data normalization [30]. However, the expression levels of miR-16-5p, the commonly-used reference miRNA [17], were significantly different between GC and N cohorts (P<0.01). Therefore, the spiked-in cel-miR-39 and the combined cel-miR-39 and miR-16-5p were applied for further data normalization.
Identifying two candidate miRNA biomarkers in the training and validation phases by qRT-PCR
After the quantification of selected miRNAs from microarray analysis by qRT-PCR in the training and validation phases, two miRNAs were identified differentially expressed. As shown in Fig. 3B and C, whatever the data normalization was adopted, the expression levels of miR-16-5p and miR-19b-3p between GC and N groups were both statistically significant with P<0.01. And the two miRNAs normalized to cel-miR-39 in the GC samples were decreased to 0.423 and 0.372 folds, respectively (Table 3). Furthermore, ROC curves in Fig. 4 showed that the AUC for the two miRNAs kept around 0.75, indicating a moderate performance to distinguish GC from N samples. And based on the Youden index, it seems that miR-16-5p was shown to have a higher specificity to detect GC (sensitivity=0.490, specificity=0.910), while miR-19b-3p exhibited a better sensitivity (sensitivity=0.813, specificity=0.586) (Table 5).
Table 2
Selected differentially expressed miRNAs in the screening phase from two sets of microarray profiling.
| Name | Accession | Regulation | BH13053 | BH13333 | ||
|---|---|---|---|---|---|---|
| P value | FC | P value | FC | |||
| hsa-miR-101-3p | MIMAT0000099 | down | 0.00043 | 0.37955 | ||
| hsa-miR-144-3p | MIMAT0000436 | down | 0.00149 | 0.34186 | ||
| hsa-miR-15a-5p | MIMAT0000068 | down | 0.00189 | 0.27576 | ||
| hsa-miR-16-5p | MIMAT0000069 | down | 0.00103 | 0.23233 | ||
| hsa-miR-19b-3p | MIMAT0000074 | down | 0.00330 | 0.43930 | 0.03311 | 0.24004 |
| hsa-miR-671-5p | MIMAT0003880 | up | 0.02281 | 1.28475 | 0.00831 | 1.93090 |
| hsa-miR-3940-5p | MIMAT0019229 | up | 0.00498 | 2.09019 | ||
| hsa-miR-4298 | MIMAT0016852 | up | 0.00358 | 2.31278 | ||
Table 3
The expression levels of miR-16-5p and miR-19b-3p normalized to the exogenous miRNA in the total training and validation phases.
| h16c39 | h19bc39 | |||||||
|---|---|---|---|---|---|---|---|---|
| aveΔCt | Sd | 2-ave△△Ct | P value | aveΔCt | Sd | 2-ave△△Ct | P value | |
| T1 | 7.811 | 1.062 | 0.560 | 0.001 | 12.265 | 1.415 | 0.601 | 0.020 |
| T2 | 8.260 | 1.134 | 0.410 | <0.001 | 12.763 | 1.386 | 0.425 | 0.001 |
| T3 | 8.398 | 1.002 | 0.373 | <0.001 | 13.482 | 1.676 | 0.258 | <0.001 |
| T4 | 8.500 | 0.941 | 0.347 | <0.001 | 13.238 | 1.056 | 0.306 | <0.001 |
| G1 | 8.171 | 0.760 | 0.436 | <0.001 | 12.650 | 1.282 | 0.460 | 0.011 |
| G2 | 8.114 | 1.267 | 0.454 | <0.001 | 12.785 | 1.507 | 0.419 | <0.001 |
| G3 | 8.338 | 0.980 | 0.389 | <0.001 | 13.248 | 1.668 | 0.304 | <0.001 |
| GC | 8.217 | 1.088 | 0.423 | <0.001 | 12.957 | 1.589 | 0.372 | <0.001 |
| N | 6.975 | 1.301 | 1 | 11.530 | 1.570 | 1 | ||
aveΔCt, the mean value of the normalized Ct values of the miRNA for each cohort in the specific phase; Sd, the corresponding standard deviation to aveΔCt; 2-ave△△Ct, the ratio of the average expression level of the miRNA for the special GC cohort to that for the N cohort; T1-4, the GC cohort with different TNM stages respectively from Ⅰ(T1), Ⅱ(T2), Ⅲ(T3) to Ⅳ(T4); G1-3, the GC cohort with different differentiation grades respectively from well(G1), moderately(G2), to poorly(G3) differentiated tumors. h16c39 and h19bc39 denote the normalized Ct value by subtracting the Ct value of cel-miR-39 from that of miR-16-5p and miR-19b-3p. Mann-Whitney U test was used to determine statistical significance at the level of P<0.05.
Table 4
Correlation analysis between the two biomarkers and TNM stages or differentiation grades of GC cases in the total training and validation phases.
| h16c39 | h19bc39 | h19bavec39h16 | ||
|---|---|---|---|---|
| TNM stage | rs* | 0.228 | 0.278 | 0.226 |
| P value | 0.006 | 0.001 | 0.007 | |
| Differentiation grade | rs* | 0.083 | 0.159 | 0.215 |
| P value | 0.330 | 0.062 | 0.011 |
*Spearman's rank correlation coefficient.
Figure 3
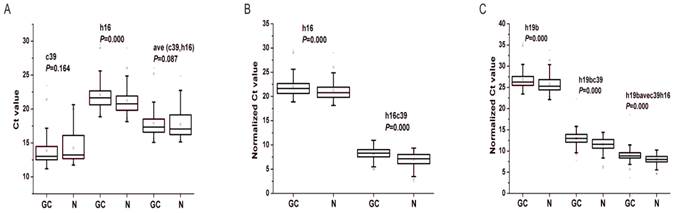
Differential expression levels of reference miRNAs (A), miR-16-5p (B) and miR-19b-3p (C) in the total training and validation phases. c39, h16 and h19b denote the raw Ct value of cel-miR-39, miR-16-5p and miR-19b-3p; ave(c39, h16) denotes the mean Ct value of cel-miR-39 and miR-16-5p; h16c39 and h19bc39 denote the normalized Ct value by subtracting the Ct value of cel-miR-39 from that of miR-16-5p and miR-19b-3p; h19bavec39h16 denotes the normalized Ct value by subtracting the Ct value of ave(c39,h16) from that of miR-19b-3p. Mann-Whitney U test was used to determine statistical significance at the level of P<0.05.
Figure 4
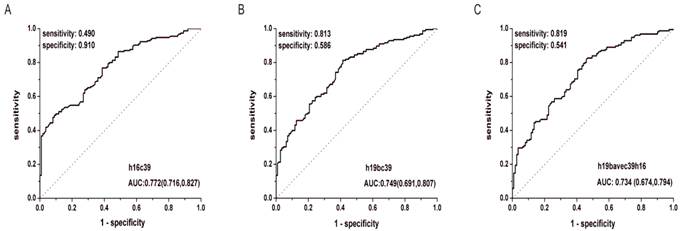
ROC curves for miR-16-5p (A), miR-19b-3p (B) normalized to the exogenous miRNA and miR-19b-3p normalized to two reference miRNAs (C) to distinguish GC cases from N controls in the total training and validation phases. h16c39, h19bc39 and h19bavec39h16 were stated as in Fig. 3.
Table 5
Performance of miR-16-5p and miR-19b-3p normalized to the exogenous miRNA in the differential diagnosis of GC cases with different TNM stages and differentiation grades from N controls in the total training and validation phases.
| h16c39 | h19bc39 | |||||||
|---|---|---|---|---|---|---|---|---|
| AUC (95%CI) | Cutoff | Sensitivity | Specificity | AUC (95%CI) | Cutoff | Sensitivity | Specificity | |
| T1 | 0.687 (0.583,0.792) | 7.335 | 0.788 | 0.532 | 0.634 (0.525,0.744) | 12.053 | 0.636 | 0.613 |
| T* | 0.648 (0.547,0.749) | 8.393 | 0.545 | 0.697 | 0.682 (0.579,0.785) | 12.275 | 0.755 | 0.515 |
| T2 | 0.761 (0.662,0.860) | 7.168 | 0.923 | 0.514 | 0.714 (0.606,0.823) | 11.903 | 0.769 | 0.586 |
| T3 | 0.815 (0.747,0.884) | 8.425 | 0.576 | 0.919 | 0.822 (0.759,0.886) | 11.863 | 0.915 | 0.586 |
| T4 | 0.832 (0.742,0.922) | 8.570 | 0.560 | 0.964 | 0.821 (0.738,0.904) | 11.878 | 0.920 | 0.586 |
| G1 | 0.777 (0.674, 0.880) | 7.543 | 0.941 | 0.613 | 0.692 (0.578,0.805) | 11.785 | 0.824 | 0.568 |
| G2 | 0.733 (0.650,0.816) | 8.425 | 0.500 | 0.919 | 0.719 (0.635,0.802) | 12.863 | 0.569 | 0.793 |
| G3 | 0.801 (0.734, 0.869) | 8.195 | 0.594 | 0.847 | 0.791 (0.723,0.859) | 11.903 | 0.859 | 0.586 |
| GC | 0.772 (0.716,0.827) | 8.368 | 0.490 | 0.910 | 0.749 (0.691,0.807) | 11.863 | 0.813 | 0.586 |
Two candidate miRNA biomarkers distinguishing gastric cancer cases with different TNM stages and differentiation grades
To evaluate the probability of the differentially expressed miRNAs to diagnose early gastric cancer patients, we further analyzed the expression levels of miR-16-5p and miR-19b-3p in GC patients with different TNM stages and differentiation grades in the total training and validation phases.
There was significant difference of the two miRNAs for all the four TNM stages compared with N controls (P<0.05) (Fig. 5A, B). And it can be seen that the Ct value of the normalized miR-16-5p (h16c39) increased stepwisely with the TNM stage ranging from Ⅰ to Ⅳ(Fig. 5A and Table 3), while miR-19b-3p normalized to the exogenous miRNA (h19bc39) moderately increased to the peak in TNM Ⅲ stage , and then decreased in Ⅳ stage (Fig. 5B and Table 3). The case for miR-19b-3p normalized to the two reference miRNAs (h19bavec39h16) was similar with h19bc39 (Supplementary Material: Fig. S2A and Table S4). Correspondingly, FC between GC and N groups reached the minimum for GC cases in TNM Ⅲ or Ⅳ stage, which was 0.347 for h16c39, 0.258 for h19bc39 and 0.414 for h19bavec39h16, respectively (Table 3 and Supplementary Material: Table S4). It should be noted that miR-16-5p and miR-19b-3p in TNM Ⅰ stage were found significantly different from the other three stages (P<0.05) (Fig. 5E, F and Supplementary Material: Fig. S2C). More importantly, the expression level of the two miRNA biomarkers correlated with TNM stage of GC cases (0.2 <rs<0.3, P<0.01) (Table 4). Summarily, the results revealed that with the progression of the GC cases from the early stage to the advanced stage, the down-regulation of miR-16-5p and miR-19b-3p became more and more prominent.
As for the differentiation grades of the tumor, the values of h16c39 and h19bc39 were significantly different between N controls and the GC cohorts at all the three levels (P<0.05) (Fig. 5C, D). Using the alternative normalization method, h19bavec39h16 still performed the same as h19bc39 except in the well differentiated tumors (Supplementary Material: Fig. S2B). In general, the normalized values of miR-19b-3p increased weakly with the GC progression from well differentiation (Grade 1) to poor differentiation (Grade 3), while miR-16-5p fluctuated within the three grades (Table 3 and Supplementary Material: Table S4). Only h19bavec39h16 was shown to be capable of distinguishing well differentiated tumors from the others (P<0.05) (Supplementary Material: Fig. S2D). And as shown in Table 4, Spearman correlation revealed the same conclusion that little rank correlation existed between h16c39 or h19bc39 and the differentiation grades of GC with the exception of h19bavec39h16.
In addition, performance analyses of miR-19b-3p and miR-16-5p by ROC curves were conducted in Fig.6 and Supplementary Material: Fig.S3. It can be seen from Table 5 and Supplementary Material: Table S5 that GC cases with Ⅲ or Ⅳ stages or those with poor differentiated tumors (Grade 3) showed the maximal AUC in all the TNM stages or differentiation grades (h16c39, AUC=0.832, 0.801 for T4, G3; h19bc39, AUC=0.822, 0.791 for T3, G3; h19bavec39h16, AUC=0.811, 0.788 for T3, G3, respectively). The results indicated that the diagnosis performance of the two miRNAs gradually performed better when the diseases progressed from the earlier stages or lower grades to the advanced stages or high grade.
Figure 5
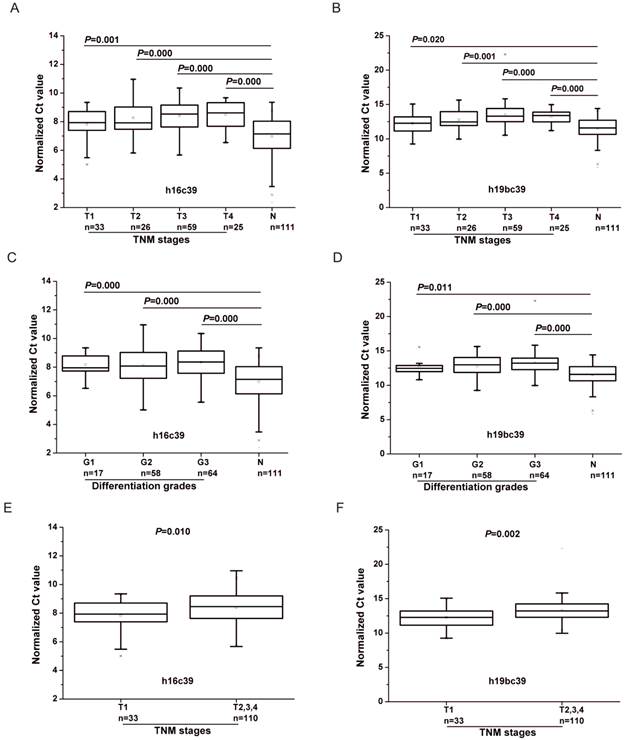
Differential expression levels of miR-16-5p (A, C, E) and miR-19b-3p (B, D, F) normalized to the exogenous miRNA in the total training and validation phases. (A, B) Boxcharts respectively between GC cases with different TNM stages and N controls. (C, D) Boxcharts respectively between GC cases with different differentiation grades and N controls. (E, F) Boxcharts between GC cases with T1 stage and those with the others. T1-4 and G1-3, as stated in Table 3; h16c39 and h19bc39, as stated in Fig. 3. Mann-Whitney U test was used to determine statistical significance at the level of P<0.05.
Figure 6
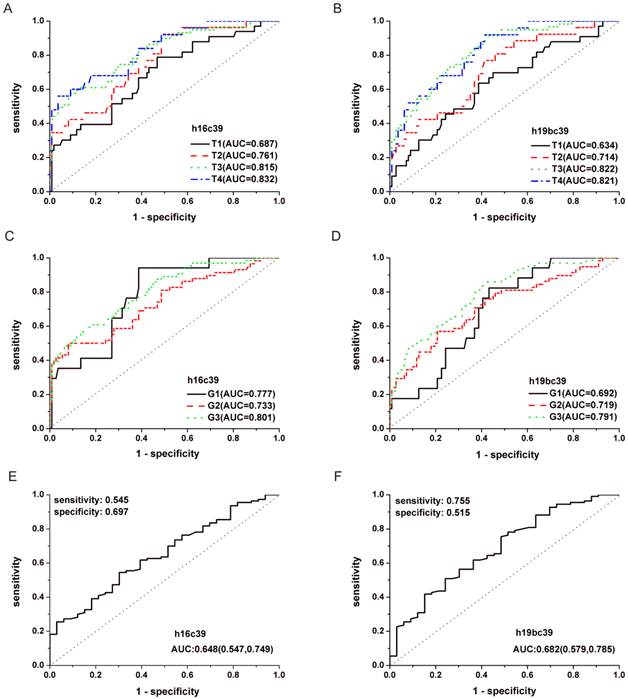
ROC curves for miR-16-5p (A, C, E) and miR-19b-3p (B, D, F) normalized to the exogenous miRNA in the total training and validation phases. (A, B) Curves to respectively distinguish GC cases with different TNM stages from N controls. (C, D) Curves to respectively distinguish GC cases with different differentiation grades from N controls. (E, F) Curve to distinguish GC cases with T1 stage from those with the others. T1-4 and G1-3, as stated in Table 3; h16c39 and h19bc39, as stated in Fig. 3.
Table 6
The expression levels of miR-16-5p and miR-19b-3p in the supplementary phase I.
| aveΔCt | Sd | 2-ave△△Ct | P value | |
|---|---|---|---|---|
| h16c39 | ||||
| N | 6.975 | 1.301 | 1.826 | 0.011 |
| Prec | 7.844 | 1.513 | 1 | |
| T1 | 7.811 | 1.062 | 1.023 | 0.891 |
| T2-4 | 8.389 | 1.016 | 0.685 | 0.039 |
| h19bc39 | ||||
| N | 11.530 | 1.570 | 1.619 | 0.029 |
| Prec | 12.225 | 1.410 | 1 | |
| T1 | 12.265 | 1.415 | 0.973 | 0.891 |
| T2-4 | 13.256 | 1.505 | 0.489 | 0.002 |
| h19bavec39h16 | ||||
| N | 8.042 | 0.983 | 1.198 | 0.098 |
| Prec | 8.303 | 1.095 | 1 | |
| T1 | 8.525 | 0.872 | 0.857 | 0.752 |
| T2-4 | 9.110 | 1.271 | 0.572 | 0.002 |
2-ave△△Ct, the ratio of the average expression level of the miRNA for the special cohort to that for the Prec cohort. aveΔCt and Sd, as stated in Table 3; h16c39, h19bc39 and h19bavec39h16, as stated in Fig. 3. Mann-Whitney U test was used to determine statistical significance at the level of P<0.05.
Two candidate miRNA biomarkers in the supplementary phase by qRT-PCR
Based on the validated difference of miR-16-5p and miR-19b-3p between GC and N population, another two cohorts were added to the study including 30 Prec individuals and 18 paired samples from GC patients with gastrectomy to explore their expression during the primary onset and extending post-operation of GC.
As shown in Fig.7, the expressions of the two biomarkers were statistically different between the Prec cases and GC with T2, 3 and 4 (P<0.05). Except for h19bavec39h16 (P=0.098), h19bc39 and h16c39 were found differentially expressed between the Prec cases and N ones (P<0.05). And there was no statistical difference of the two miRNAs between the Prec cases and GC ones with T1 stage. Moreover, compared to their expression in Prec cases, the two biomarkers were gradually down-regulated from the N cohort to the Prec and T1 cases, and finally reached the minimum in the cohort of T2, 3 and 4 (Table 6). It can be concluded that the weak down-regulation of the two biomarkers occurred initially in the precancerous diseases as well as the early GC.
Between the pre-operative patients and the post-operative identical ones the differential expression was found statistically significant solely for miR-19b-3p. As depicted in Fig. 8A, there was significant difference of miR-19b-3p under two normalization methods both by Mann-Whitney U test and Wilcoxon test at the level of P<0.05. And the Ct values of miR-19b-3p for most of the participants increased after operation (Fig. 8B, C) with 0.630 and 0.560 folds of down-regulation respectively for h19bc39 and h19bavec39h16 (Supplementary Material: Table S6).
Figure 7
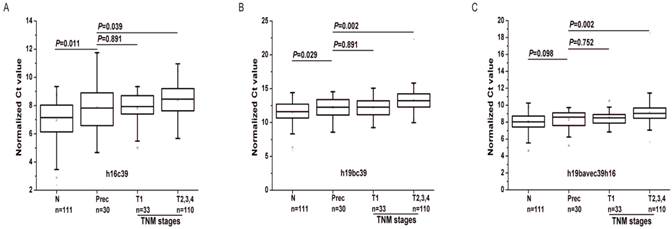
Differential expression levels of miR-16-5p (A) and miR-19b-3p (B, C) in the supplementary phase Ⅰ. T1-4, as stated in Table 3; h16c39 and h19bc39 and h19bavec39h16 as stated in Fig. 3. Mann-Whitney U test was used to determine statistical significance at the level of P<0.05.
Figure 8
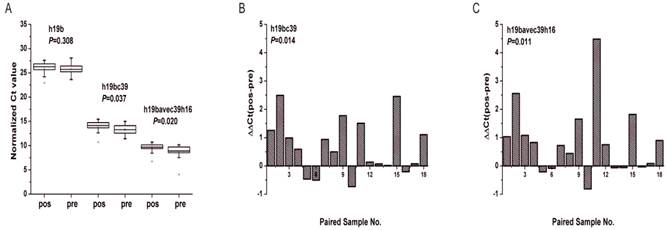
Expression levels of miR-19b-3p in the supplementary phase Ⅱ. (A) Boxcharts of the expression levels of miR-19b-3p. Mann-Whitney U test was used to determine statistical significance at the level of P<0.05. (B, C) Column charts of the differential expression levels of miR-19b-3p between pre-operative gastric cancer patients (pre) and post-operative ones (pos). ΔΔCt(pos-pre) denotes the difference of the normalized Ct value. Paired Wilcoxon test was used to determine statistical significance at the level of P<0.05. h19b, h16c39, h19bc39 and h19bavec39h16 were stated as in Fig.3.
Discussion
Recently a great deal of efforts have been devoted to tumor-related miRNA biomarker screening, however, many variables would challenge us including the selection of source materials, the extraction quality of RNA, the inconsistency of detection platforms and methods, the different data normalization methods of qRT-PCR, and so on [17, 31]. The platforms we used herein were microarray profiling and qRT-PCR. Out of dozens of differentially expressed miRNAs screened by microarray, only miR-19b-3p and miR-16-5p were validated as down-regulated markers in GC patients by the following qRT-PCR, indicating the big difference between the data from microarray to qRT-PCR [17]. The microarray methods which hybridize all the target miRNAs or cDNAs to the probes under the same condition, are prone to cross-hybridization, thus resulting in a large number of false positives or negatives [32]. Therefore, the microarray analysis must be further validated by qRT-PCR, which is recognized as the golden standard for miRNA quantification with high specificity [33].
For the following validation by qRT-PCR, the primary challenge was the option of proper reference miRNAs for data normalization. It is suggested that the candidate reference miRNAs should belong to different functional classes, which significantly reduce the possibility of confounding co-regulation [23]. On the other hand, the expression levels of reference miRNAs should be detectable in all samples, and show low dispersion and no association with disease [33]. MiR-16-5p has been found expressed at similar levels in most tissues [17] and was commonly used as an endogenous control in tissues or even serum and plasma [34-36]. In particular, Song recommended that miR-16-5p could be served as one of the suitable reference genes in serum for gastric cancer [37]. However, the microarray analysis in our study screened miR-16-5p as differentially expressed miRNA. To ascertain the contradictory, we analyzed the expression of miR-16-5p by further qRT-PCR method and found that it was inconsistent between GC and N groups in the total training and validation phases. Moreover, it was reported that the expression level of miR-16-5p could exhibit individual variances [19] because of its easy affection by the hemolysis in blood samples, and was not recommended as an ideal internal control [38]. Anyway, miR-16-5p may not be the perfect endogenous miRNA in plasma for data normalization. Instead, it might be a biomarker in plasma for gastric cancer.
Additionally, three known synthetic non-mammalian miRNAs (cel-miR-39, cel-miR-54 and cel-miR-238) as exogenous controls, mainly derived from Caenorhabditis elegans, were introduced by Mitchell's group and then widely promoted to give quality control of the RNA extracted from the source material [14, 39, 40]. It can't be denied that the single exogenous miRNA may not be enough to reflect the landscape within the source material [30]. Therefore, the integrating use of different normalization methods was strongly recommended, preferably the use of both endogenous and exogenous controls [33]. In our study, the relative quantification with cel-miR-39 and miR-16-5p respectively as exogenous and endogenous reference miRNA was simultaneously adopted and tried for data process in order to monitor RNA quality in the whole extraction process as well as embody and diminish the biological variability [30]. MiR-19b-3p normalized to the mean value of cel-miR-39 and miR-16-5p remained down-regulated in spite of the same down-regulation expression of miR-16-5p in GC patients, which suggests that miR-19b-3p should be a solid down-regulation biomarker for GC diagnosis.
Compared to the previously identified circulating miRNA biomarkers of GC, no identical biomarkers were further validated in the present study, and miR-16-5p and miR-19b-3p were the first time to be reported as the indicators of the gastric cancer progression. In fact, our initial microarray analysis identified the down-regulation of let-7a in GC cases similar with Tsujiura's study [18]. However, contradictory to the up-regulated hsa-miR-106b in their study, the miRNA was found down-regulated in our experiments. The different ethnic group and size of the plasma sample may be one of the sources in the variance [31]. In addition, the effect of different data normalization methods on the final results can't be ignored [37]. Admittedly, considerable confounding factors involved in the pre-analytical variables and the whole analytical process may contribute to the discrepancy between research on the same disease when exploring circulating miRNA biomarkers [31, 41]. And the standard protocol should be established to compare the difference between them.
Actually, now few miRNAs have been demonstrated as biomarkers for early detection of GC. Although a five-miRNA signatures in serum has been identified by Liu to distinguish the earlier stage (Ⅰ and Ⅱ) from advanced stage (Ⅲ and Ⅳ), there were no further elaboration of the change and performance of the miRNA signature with different TNM stages [20]. While miR-378 was claimed as a serum biomarker for early detection of gastric cancer, there was no data to support the ROC performance of this miRNA to discriminate early cancer [21]. Similarly, in spite of the added 20 patients with gastric precancerous diseases in Li's study, it lacked the detailed analysis of the relationship of miR-199a-3p with the progression of GC [42]. In our study based on the detailed sample characteristics on TNM stage and differentiation level, we explored the trend of the down-regulation of miR-16-5p and miR-19b-3p with the severe progression of GC, and concluded that GC cases with the early stage (Ⅰ) can be moderately distinguished from the advanced ones (Ⅱ, Ⅲ and Ⅳ) by the two miRNAs with AUC>0.6. Furthermore, the same as the early GC, the precancerous diseases initially showed the weak down-regulation of the two biomarkers, indicating their potential for early diagnosis of GC. And it was inferred that the dysregulation of the two miRNAs can be triggered by the inflammatory and other risk factors in the premalignant environment, and the factors altogether successively lead to the disease's progression into GC[3, 6]. Admittedly, the two individual miRNAs performed weakly in discriminating early GC (AUC=0.6-0.8), but moderately in advanced GC (AUC=0.7-0.9). A miRNA panel including more biomarkers remains to be established to enhance the performance for diagnosis [43, 44].
The circulating miRNAs are declared to originate from the cell-derived microvesicles, exosomes, apoptotic vesicles and/or senescent bodies and other unknown pathway little associated with vesicles [17, 43]. A wide range of miRNAs correlated with physiologic and pathologic events would be selectively loaded into the vesicles, making more complex the relations of the miRNA levels between the tissues and circulation system [17]. MiR-19b-3p and miR-16-5p were identified as the down-regulation markers in our study. Herein, miR-19b-3p was previously found to be one member of the miR-17-92 cluster (miR-17-3p, miR-17-5p, miR-18, miR-19a, miR-19b-3p, miR-20a, and miR-92a) frequently recognized as an onco-miR in cell or tissue [45], while miR-16-5p combined with miR-15a is regularly thought as tumor suppressors [46]. MiR-16-5p has been reported to be down-regulated and to act as a tumor suppressor in different cancer types [47]. Thus, it is logical to understand that the same decrease occurred in plasma due to the positive correlation of plasma with tissues. However, miR-19a/b was found to be over-expressed in gastric cancer tissues and significantly associated with the patients' metastasis of gastric cancer [48], and the discrepancy of decreasing miR-19b-3p in our study seemed to confuse the origin and change of circulating miRNAs. In fact, miR-19 was also found to be decreased in clinical tissues of GC [49], suggesting that the exact role of miR-17-92 cluster remains to be investigated [50]. Additionally, Tanaka was confronted with the same result that miR-92a in the miR-17-92 cluster was found to be decreased in plasma of leukemic patients [51], and he explained that the contradictory may be caused by active uptake by the cells from blood, or the selective digestion of miRNAs in blood [17]. Nevertheless, in the complex network, the phenomenon of secretion and incorporation of miRNAs seems to be a general biological event for organisms, and the tumor microenvironment could be remarkably molded to their own advantage [52]. The complete picture of the location and source of miRNAs in the circulation system awaits further clarification.
Another key issue in our study was that the fold change for the down-regulation of miR-19b-3p or miR-16-5p between GC and N groups was generally around two fold, which was a relative smaller change. It has been reported that 10-20-fold differences in miRNA expression levels was found to be important in papillary thyroid carcinomas [11]. However, the view was shared that much smaller changes (less than two fold) could also lead to significant biologic effect [11] because of the complex interactions between miRNA and mRNA.
Finally, in our study miR-19b-3p and miR-16-5p after the operation were not found increased as expected. However, it should be noted that the conventional interval time for blood collecting was 1-2 months [18, 19]. Herein, paired patients within 9 days intervals before and after gastrectomy might be too short to judge whether a biomarker can be used for prognosis. Especially for the circulating biomarkers, a responding process which transfers the change from the tissue to the circulating system was complex. Therefore, further study on prolonged interval after the gastrectomy and the correlations for circulating miRNAs and tissue miRNAs were needed to determine whether and why the two miRNAs could be used as biomarkers for prognosis.
Conclusion
In conclusion, based on the two normalization methods, miR-19b-3p and miR-16-5p in plasma were found to be capable of distinguishing normal population from GC cases with different TNM stages and differentiation grades, particularly including the population with early gastric cancer. Both of the two miRNAs were down-regulated in GC cases. Especially, the weak down-regulation trend became more and more prominent with the progression of GC from the early stage to the advanced stage (0.2< rs<0.3, P<0.01), and the same weak down-regulation of the two biomarkers as the early GC occurred initially in the precancerous diseases. Correspondingly, the two miRNAs to detect GC in ROC analysis gradually performed better when the diseases progressed from the earlier stages or lower grades to the advanced stages or high grade. In addition, miR-19b-3p remained down-regulated within 9 days after the gastrectomy. Summarily, miR-16-5p and miR-19b-3p were identified as prospective biomarkers in plasma to detect GC and the significant down-regulation of the two miRNAs may be a solid indicator of the severe progression of gastric cancer. However, the potential clinical value of the two biomarkers still needs further verification. And further work will focus on investigating the prognosis value of miR-19b-3p and miR-16-5p and the early diagnosis capability of other potential miRNAs based on a larger number of clinical samples.
Supplementary Material
Supplementary Figures and Tables.
Abbreviation
GC: gastric cancer; N: Normal; Prec: precancerous lesions/diseases; pre: pre-operation; pos: post-operation; qRT-PCR: quantitative reverse transcription polymerase chain reaction; RT: reverse transcription; FC: fold change; ROC curves: receiver operating characteristic curves; AUC: area under the curve; CI: confidence interval.
Acknowledgements
This work is supported by the National Key Basic Research Program (973 Project) (No.2010CB933902 and 2015CB931802), National Natural Scientific Fund (No.81225010, 81327002, and 31100717), 863 Project of China (2012AA022703 and 2014AA020700), Shanghai Science and Technology Fund (No.13NM1401500), Shanghai Jiao Tong University Innovation Fund for Postgraduates (No. AE340011).
Competing Interests
The authors have declared that no competing interest exists.
References
1. Ferlay J, Shin HR, Bray F. et al. Estimates of worldwide burden of cancer in 2008: Globocan 2008. Int J Cancer. 2010;127:2893-2917
2. Chen WQ, Zheng RS, Zhang SW. et al. Annual report on status of cancer in china, 2010. Chinese J Cancer Res. 2014;26:48-58
3. Hartgrink HH, Jansen EPM, van Grieken NCT. et al. Gastric cancer. The Lancet. 2009;374:477-490
4. Wang J, Yu JC, Kang WM. et al. Treatment strategy for early gastric cancer. Surg Oncol. 2012;21:119-123
5. Taback B, Hoon DSB. Circulating nucleic acids in plasma and serum: past, present and future. Curr Opin Mol Ther. 2004;6:273-278
6. Catalano V, Labianca R, Beretta GD. et al. Gastric cancer. Crit Rev Oncol Hemat. 2009;71:127-64
7. Thiel A, Ristimaki A. Gastric cancer: basic aspects. Helicobacter. 2012;17:26-29
8. Berger F, Reiser MF. MicroRNAs as potential new molecular biomarkers in oncology: have they reached relevance for the clinical imaging sciences? Theranostics. 2013;3:943-952
9. Bartel DP. MicroRNAs: genomics, biogenesis, mechanism, and function. Cell. 2004;116:281-297
10. Paulmurugan R. MicroRNAs - a new generation molecular targets for treating cellular diseases. Theranostics. 2013;3:927-929
11. Calin GA, Croce CM. MicroRNA signatures in human cancers. Nat Rev Cancer. 2006;6:857-66
12. Iorio MV, Croce CM. MicroRNA dysregulation in cancer: diagnostics, monitoring and therapeutics. A comprehensive review. Embo Mol Med. 2012;4:143-159
13. Kim DN, Chae HS, Oh ST. et al. Expression of viral microRNAs in epstein-barr virus-associated gastric carcinoma. J Virol. 2007;81:1033-1036
14. Mitchell. Circulating microRNAs as stable blood-based markers for cancer detection. P Natl Acad Sci USA. 2008;105:10513
15. Lu J, Getz G, Miska EA. et al. MicroRNA expression profiles classify human cancers. Nature. 2005;435:834-838
16. Srinivasan S, Selvan ST, Archunan G. et al. MicroRNAs -the next generation therapeutic targets in human diseases. Theranostics. 2013;3:930-942
17. Reid G, Kirschner MB, van Zandwijk N. Circulating microRNAs: association with disease and potential use as biomarkers. Crit Rev Oncol Hemat. 2011;80:193-208
18. Tsujiura M, Ichikawa D, Komatsu S. et al. Circulating microRNAs in plasma of patients with gastric cancers. Brit J Cancer. 2010;102:1174-1179
19. Konishi H, Ichikawa D, Komatsu S. et al. Detection of gastric cancer-associated microRNAs on microRNA microarray comparing pre- and post-operative plasma. Brit J Cancer. 2012;106:740-747
20. Liu R, Zhang CN, Hu ZB. et al. A five-microRNA signature identified from genome-wide serum microRNA expression profiling serves as a fingerprint for gastric cancer diagnosis. Eur J Cancer. 2011;47:784-791
21. Liu HS, Zhu L, Liu BY. et al. Genome-wide microRNA profiles identify miR-378 as a serum biomarker for early detection of gastric cancer. Cancer Lett. 2012;316:196-203
22. Cortez MA, Calin GA. MicroRNA identification in plasma and serum: a new tool to diagnose and monitor diseases. Expert Opin Biol Th. 2009;9:703-711
23. Mestdagh P, Van Vlierberghe P, De Weer A. et al. A novel and universal method for microRNA RT-qPCR data normalization. Genome Biol. 2009;10:R64
24. McShane LM, Hayes DF. Publication of tumor marker research results: the necessity for complete and transparent reporting. J Clin Oncol. 2012;30:4223-4232
25. Hermanek P. The superiority of the new international union against cancer and American joint committee on cancer TNM staging of gastric carcinoma. Cancer. 2000;88:1763-1765
26. Livak KJ, Schmittgen TD. Analysis of relative gene expression data using real-time quantitative PCR and the 2-△△Ct method. Methods. 2001;25:402-408
27. Pfaffl MW. A new mathematical model for relative quantification in real-time RT-PCR. Nucleic Acids Res. 2001;29:e45
28. Jemal A, Bray F, Center MM. et al. Global cancer statistics. CA: Cancer J Clin. 2011;61:69-90
29. Bandres E, Bitarte N, Arias F. et al. MicroRNA-451 regulates macrophage migration inhibitory factor production and proliferation of gastrointestinal cancer cells. Clin Cancer Res. 2009;15:2281-2290
30. Kroh EM, Parkin RK, Mitchell PS. et al. Analysis of circulating microRNA biomarkers in plasma and serum using quantitative reverse transcription-PCR (qRT-PCR). Methods. 2010;50:298-301
31. De Guire V, Robitaille R, Tetreault N. et al. Circulating miRNAs as sensitive and specific biomarkers for the diagnosis and monitoring of human diseases: promises and challenges. Clin Biochem. 2013;46:846-860
32. Koshiol J, Wang E, Zhao Y. et al. Strengths and limitations of laboratory procedures for microRNA detection. Cancer Epidem Biomar. 2010;19:907-911
33. Zampetaki A, Mayr M. Analytical challenges and technical limitations in assessing circulating miRNAs. Thromb Haemostasis. 2012;108:592-598
34. Heneghan HM, Miller N, Lowery AJ. et al. Circulating microRNAs as novel minimally invasive biomarkers for breast cancer. Ann Surg. 2010;251:499-505
35. Lawrie CH, Gal S, Dunlop HM. et al. Detection of elevated levels of tumour-associated microRNAs in serum of patients with diffuse large B-cell lymphoma. Brit J Haematol. 2008;141:672-675
36. Huang ZH, Huang D, Ni SJA. et al. Plasma microRNAs are promising novel biomarkers for early detection of colorectal cancer. Int J Cancer. 2010;127:118-126
37. Song J, Bai Z, Han W. et al. Identification of suitable reference genes for qPCR analysis of serum microRNA in gastric cancer patients. Dig Dis Sci. 2012;57:897-904
38. McDonald JS, Milosevic D, Reddi HV. et al. Analysis of circulating microRNA: preanalytical and analytical challenges. Clin Chem. 2011;57:833-840
39. Song MY, Pan KF, Su HJ. et al. Identification of serum microRNAs as novel non-invasive biomarkers for early detection of gastric cancer. PLoS One. 2012;7:e33608
40. Cai H, Yuan Y, Hao YF. et al. Plasma microRNAs serve as novel potential biomarkers for early detection of gastric cancer. Med Oncol. 2013;30:452
41. Becker N, Lockwood CM. Pre-analytical variables in miRNA analysis. Clin Biochem. 2013;46:861-868
42. Li C, Li JF, Cai Q. et al. MiRNA-199a-3p in plasma as a potential diagnostic biomarker for gastric cancer. Ann Surg Oncol. 2013;20:S397-S405
43. Zen K, Zhang CY. Circulating microRNAs: a novel class of biomarkers to diagnose and monitor human cancers. Med Res Rev. 2012;32:326-348
44. Schultz NA, Dehlendorff C, Jensen BV. et al. MicroRNA biomarkers in whole blood for detection of pancreatic cancer. J Am Med Assoc. 2014;311:392-404
45. Mo MH, Chen L, Fu Y. et al. Cell-free circulating miRNA biomarkers in cancer. J Cancer. 2012;3:432-448
46. Kent OA, Mendell JT. A small piece in the cancer puzzle: microRNAs as tumor suppressors and oncogenes. Oncogene. 2006;25:6188-6196
47. Ma QY, Wang XY, Li Z. et al. MicroRNA-16 represses colorectal cancer cell growth in vitro by regulating the p53/survivin signaling pathway. Oncol Rep. 2013;29:1652-1658
48. Wu Q, Yang Z, An Y. et al. MiR-19a/b modulate the metastasis of gastric cancer cells by targeting the tumour suppressor MXD1. Cell Death Dis. 2014;5:e1144
49. Yang O, Huang JH, Lin S. Regulatory effects of miRNA on gastric cancer cells. Oncol Lett. 2014;8:651-656
50. Ranji N, Sadeghizadeh M, Shokrgozar MA. et al. MiR-17-92 cluster: an apoptosis inducer or proliferation enhancer. Mol Cell Biochem. 2013;380:229-238
51. Tanaka M, Oikawa K, Takanashi M. et al. Down-regulation of miR-92 in human plasma is a novel marker for acute leukemia patients. Plos One. 2009;4:e5532
52. Kosaka N, Iguchi H, Ochiya T. Circulating microRNA in body fluid: a new potential biomarker for cancer diagnosis and prognosis. Cancer Sci. 2010;101:2087-2092
Author contact
![]() Corresponding authors: suhcedu.cn or wangheedu.cn or dxcuiedu.cn
Corresponding authors: suhcedu.cn or wangheedu.cn or dxcuiedu.cn
Citation styles
APA
Zhang, J., Song, Y., Zhang, C., Zhi, X., Fu, H., Ma, Y., Chen, Y., Pan, F., Wang, K., Ni, J., Jin, W., He, X., Su, H., Cui, D. (2015). Circulating MiR-16-5p and MiR-19b-3p as Two Novel Potential Biomarkers to Indicate Progression of Gastric Cancer. Theranostics, 5(7), 733-745. https://doi.org/10.7150/thno.10305.
ACS
Zhang, J.; Song, Y.; Zhang, C.; Zhi, X.; Fu, H.; Ma, Y.; Chen, Y.; Pan, F.; Wang, K.; Ni, J.; Jin, W.; He, X.; Su, H.; Cui, D. Circulating MiR-16-5p and MiR-19b-3p as Two Novel Potential Biomarkers to Indicate Progression of Gastric Cancer. Theranostics 2015, 5 (7), 733-745. DOI: 10.7150/thno.10305.
NLM
Zhang J, Song Y, Zhang C, Zhi X, Fu H, Ma Y, Chen Y, Pan F, Wang K, Ni J, Jin W, He X, Su H, Cui D. Circulating MiR-16-5p and MiR-19b-3p as Two Novel Potential Biomarkers to Indicate Progression of Gastric Cancer. Theranostics 2015; 5(7):733-745. doi:10.7150/thno.10305. https://www.thno.org/v05p0733.htm
CSE
Zhang J, Song Y, Zhang C, Zhi X, Fu H, Ma Y, Chen Y, Pan F, Wang K, Ni J, Jin W, He X, Su H, Cui D. 2015. Circulating MiR-16-5p and MiR-19b-3p as Two Novel Potential Biomarkers to Indicate Progression of Gastric Cancer. Theranostics. 5(7):733-745.
This is an open access article distributed under the terms of the Creative Commons Attribution (CC BY-NC) License. See http://ivyspring.com/terms for full terms and conditions.