Theranostics
13.3
Impact Factor
- Current Issue
- Advance Articles
- Volume 16; 2026
- Volume 15; 2025
- Volume 14; 2024
- Volume 13; 2023
- Volume 12; 2022
- Archive
- Cover Images
- Cover Suggestion
- Special Issues
Top
Introduction
Materials and Methods
Results
Discussion
Conclusion
Supplementary Material
Acknowledgements
References
Introduction
Materials and Methods
Results
Discussion
Conclusion
Supplementary Material
Acknowledgements
References
International Journal of Biological Sciences
International Journal of Medical Sciences
 Global reach, higher impact

Theranostics 2015; 5(6):631-642. doi:10.7150/thno.11389 This issue Cite
Research Paper
Theranostic Mesoporous Silica Nanoparticles Biodegrade after Pro-Survival Drug Delivery and Ultrasound/Magnetic Resonance Imaging of Stem Cells
Paul J. Kempen1,2*, Sarah Greasley4, Kelly A. Parker2, Jos L. Campbell1#, Huan-Yu Chang1, Julian R. Jones4, Robert Sinclair3, Sanjiv S. Gambhir1,2,3, Jesse V. Jokerst1† ![]()
1. Molecular Imaging Program at Stanford (MIPS), Department of Radiology, 318 Campus Drive, Stanford University School of Medicine, Stanford, CA 94305-5427;
2. Materials Science & Engineering, Stanford University, Stanford, CA 94305;
3. Bioengineering, Bio-X, Stanford University, Stanford, CA 94305;
4. Department of Materials, Imperial College London, Exhibition Road, London, UK SW7 2AZ.
* New address: Department of Micro- and Nanotechnology, Technical University of Denmark, 2800 Kgs. Lyngby, Denmark.
# New address: NanoBiotechnology Research Laboratory (NBRL), School of Applied Sciences, RMIT University, GPO Box 2476 V, Melbourne, VIC 3001, Australia
† This author's address effective July 2015: Department of NanoEngineering, University of California, San Diego.
Received 2014-12-18; Accepted 2015-2-2; Published 2015-3-1
Citation:
Kempen PJ, Greasley S, Parker KA, Campbell JL, Chang HY, Jones JR, Sinclair R, Gambhir SS, Jokerst JV. Theranostic Mesoporous Silica Nanoparticles Biodegrade after Pro-Survival Drug Delivery and Ultrasound/Magnetic Resonance Imaging of Stem Cells. Theranostics 2015; 5(6):631-642. doi:10.7150/thno.11389. https://www.thno.org/v05p0631.htm
Other stylesAbstract

Increasing cell survival in stem cell therapy is an important challenge for the field of regenerative medicine. Here, we report theranostic mesoporous silica nanoparticles that can increase cell survival through both diagnostic and therapeutic approaches. First, the nanoparticle offers ultrasound and MRI signal to guide implantation into the peri-infarct zone and away from the most necrotic tissue. Second, the nanoparticle serves as a slow release reservoir of insulin-like growth factor (IGF)—a protein shown to increase cell survival. Mesenchymal stem cells labeled with these nanoparticles had detection limits near 9000 cells with no cytotoxicity at the 250 µg/mL concentration required for labeling. We also studied the degradation of the nanoparticles and showed that they clear from cells in approximately 3 weeks. The presence of IGF increased cell survival up to 40% (p<0.05) versus unlabeled cells under in vitro serum-free culture conditions.
Keywords: Stem Cell Therapy, Theranostic, Pro-survival, Mesoporous Silica Nanoparticles.
Introduction
Cardiac stem cell therapy has shown encouraging initial results in treating heart disease [1-3], yet is plagued by poor long-term efficacy because of rapid cell death after implantation [2, 4]. This is attributed to two fundamental challenges—1) ischemia and inflammation in the treated area [4] and 2) mis-injection or implant into highly fibrotic tissue [5, 6]. Because of these barriers, less than 2% of implanted stem cells remain viable after 4-8 weeks [6] with cells mis-injected in 50% of patients [7]. To combat ischemia and inflammation, pro-survival cocktails have been shown to increase stem cell proliferation[8], yet this work is limited by the short half-lives and poor bioavailability of these agents. Echocardiography can be used to avoid implantation into fibrotic tissue, but cellular imaging for surgical guidance is limited by the lack of available contrast agents. Here we propose a mesoporous silica nanoparticle that solves both of these major limitations through a combined therapeutic and diagnostic—“theranostic”—approach.
Ultrasound is a promising tool for real-time imaging of cell delivery because of its high spatial/temporal resolution and its many centimeters of imaging depth. Ultrasound is already routinely used in echocardiography and images the catheter used to deliver stem cells. Contrast agents for ultrasound molecular imaging are primarily composed of perfluorocarbons—both gaseous micrometer-sized bubbles [9-12] and liquid droplets [13]. However, these probes are limited by the micron size of the bubble as well as its short life time (<30 minutes)—challenges that can be overcome with nanotechnology [14, 15].
Recently, we [16] and others [17-21] have reported that silica-based nanoparticles offer contrast for ultrasound imaging. Just as the interface between tissue and the gaseous microbubbles offer an impedance mismatch, so too does the interface between tissue and the rigid silica particles. These nanoparticles can be used for real time stem cell imaging and quantitation with ultrasound to avoid delivery into fibrotic tissue [16, 22]. The nanoparticles are loaded inside of cells rather than co-injection with microbubbles [5, 23] or surface-bound microbubbles [12, 24]. This ensures that the nanoparticle reporter corresponds to the cell of interest. Our previous work used Stöber silica nanoparticles, but these probes have a very long biodegradation time due to their dense silicate network and low dissociation constant of silica and cannot deliver pro-survival agents to increase the survival of stem cells.
Thus, this work transitions to mesoporous silica nanoparticles (MSNs)[25-30], which offer high surface area (~1000 m2/g)[31] due to micelle-templated pores with tunable sizes and charges through a variety of silane chemistry techniques [31]. While many groups have used MSNs for drug delivery related to cancer [32], we hypothesized that they could also be used to deliver pro-survival agents to stem cells while also serving as a contrast agent. A second goal was to use the high surface area to facilitate biodegradation and clearance from living systems.
Here, we report the construction and validation of mesoporous silica nanoparticles as a theranostic tool for stem cell therapy. We used insulin-like growth factor (IGF) as a model pro-survival agent because of its established role in cardiac stem cell therapy [33, 34]. This report presents concurrent ultrasound/magnetic resonance imaging as well as drug delivery with MSNs. The ultrasound is useful for image-guided delivery and quantitation, the MRI offers higher resolution follow-up studies, and the drug delivery prevents stem cell death. This approach may offer important advantages for cardiac stem cell therapy as well as abdominal applications of regenerative medicine amenable to ultrasound imaging.
Materials and Methods
Reagents. Mesoporous silica nanoparticles were purchased from Sigma with a nominal diameter of 200 nm and a 4 nm pore size (p/n 748161). Aminopropyl-trimethoxysilane (APTES), gadolinium chloride, fluorescein isothiocyanate were also purchased from Sigma. A N-hydroxysuccinimide NHS derivative of 1,4,7,10-tetraaza-cyclododecane-1,4,7,10-tetraacetic acid (DOTA) was purchased from Macrocyclics.
Nanoparticle Synthesis. An amino-silane conjugate of fluorescein was first made by adding 5.25 mg fluorescein isothiocyanate to 73 μL of 3-aminopropyltrimethoxysilane (APTES) in 1 mL ethanol total volume with overnight rotation. Next, MSNs (1 g) were dissolved in 100 mL of ethanol and bath sonicated for 20 minutes to completely disperse any aggregates. Then, 3 mL of APTES was added and the solution gently refluxed for 90 minutes with stirring. The solution was further stirred overnight at room temperature, and the next day 500 µL of the fluorescein product was added for an additional hour of stirring. The product was washed thrice with ethanol, twice with a 1:1 mixture of ethanol/PBS, and twice with PBS. Then 50 mg of NHS-DOTA was added and the solution stirred at room temperature for 1 hour and then washed thrice with PBS. Then, 300 mg GdCl3 was added and the solution was incubated for 2 hours in a 50oC water bath. The final product was washed again with water and dialyzed overnight versus constantly regenerated water.
Nanoparticle Characterization. Dynamic light scattering was performed with a Malvern Zetasizer. All transmission electron microscopy (TEM) and energy-dispersive x-ray spectroscopy (EDS) was performed with a Tecnai G2 X-Twin (FEI Co.) instrument operating at 200 kV. MSNs were dissolved in 10 M NaOH with sonication for 1 hour, then neutralized and diluted with 5% nitric acid for Inductively Coupled Plasma-Optical Emission Spectroscopy (ICP) analysis on an ICAP 6300 system (Thermo Scientific) using 1 and 10 ppm solutions of Gd and Si as standards (Fluka). All absorbance and fluorescence measurements used a plate reader from Biotek.
Degradation Experiments. We used a modified open system dissolution apparatus to study the decay of MSNs [35]. This home built system consisted of a peristaltic pump moving 0.1X PBS at 0.5 mL/min into a 300 mL sintered glass funnel serviced by overhead stirring. After equilibration and collection of some initial fractions to measure background silica content, 22 mg of MSNs were added and fractions then collected daily. The “eluent” drained into a 4 L plastic beaker and fractions were collected periodically for elemental analysis. Samples (200 µL) from the retentate were periodically removed, centrifuged, and imaged with TEM.
To study degradation inside cells, MSCs were labeled with MSNs and then re-plated at 5000 cells/cm2 and grown for 1, 2, or 3 weeks. Aliquots of media were removed periodically for ICP analysis. At the end of the 1, 2, or 3 weeks cells were detached from the culture flask and prepared for TEM. This sample preparation has been described previously [22]. Briefly, the samples were stained en bloc with osmium tetroxide and uranyl acetate. Dehydrated samples were sectioned and placed on copper grids (Ted Pella).
Ultrasound and Magnetic Resonance Imaging. We used a Vevo2100 system from Visualsonics for the ultrasound imaging at 40 MHz (M550 transducer) and 16 MHz (M250 transducer). We used imaging parameters determined empirically including 100% power, 20 dB gain, 65 dB dynamic range, and 21 and 40 MHz center frequencies. The sample was 1 cm from the transducer. MRI utilized a 1 T magnet from Bruker with auto-shimming. The pulse sequence was T1 FLASH at 3.5 cm field-of-view, an echo time of 6.3 ms, repetition time of 120 ms, flip angle of 80o, a 256 x 256 matrix (13.7 µm/pixel), 8 excitations, auto gain calibration, and vertical frequency directions. Five 1.25 mm slices were collected with 1.5 mm between slices.
Cell Culture, Labeling, and Proliferation Assays. Human bone marrow mesenchymal stem cells (MSCs) were acquired from Lonza (p/n PT-2501) and seeded at 5000 cells/cm2 in media from Lonza (PT-3001). For survival studies, we used the same media, but without the BSA and L-glutamine that were present in complete media. Cell labeling was done without transfection agents and introduced MSNs in fresh cell culture media. The cells were incubated under standard conditions and then washed thrice to ensure only the MSNs endocytosed by cells were remaining in the plate. Cells were detached with TrypLE Express (Life Technologies). For proliferation assays, labeled (250 µg/mL) and unlabeled cells were plated at 1000 cell/well in each well of a 96 well plate. The cell number was measured with a (3-(4,5-dimethylthiazol-2-yl)-5-(3-carboxymethoxyphenyl)-2-(4-sulfophenyl)-2H-tetrazolium) (MTS) assay. Here, 20 μL of MTS solution was added to each well and the plate incubated for 3 hours followed by absorbance measurement at 490 nm. Confocal microscopy used a Leica confocal microscope (TCS SP5) with a 20x APO objective (p/n 506147) seated on a Virbraplane air table. For z-stacking experiments, 20 slices were collected over ~ 50 µm. Videos were made by compiling the individual TIFF files into an .avi file. Epifluorescence microscopy used an Evos microscope (Life Technologies) and 2-(4-amidinophenyl)-1H -indole-6-carboxamidine (DAPI) for nuclear staining.
Toxicity Assays. In addition to the MTS assay, we also used the resazurin (Alamar Blue; Invitrogen) assay. Cells with increasing amount of MSNs were treated with 100 μL of reszurin and allowed to incubate under standard conditions for 3 hours followed by fluorescence measurements at 570 nm excitation and 590 nm emissions. The EthD-III assay (Biotium) also used plated cells and tested for disrupted cell membranes in necrotic or apoptotic cells. After 4 hours of treatment with MSNs, MSCs were labeled with 4 µM EthD-III, and then the fluorescence signal at 530 nm excitation and 620 nm emissions were measured. Metabolic activity was also measured with an ATP/luciferase assay (Promega) according the manufacturer's instructions. Green channel bioluminescence was collected for 1 minute 20 minutes after adding the luciferin and luciferase. For all toxicity controls, we used a positive control of 15 μL of 2 mg/mL cetyltrimethylammonium bromide (CTAB) in PBS that was added concurrently with the MSNs. Reactive oxygen species (ROS) were measured with 2′,7′-dichlorodihydrofluorescein diacetate (DCFH-DA) in Hank's buffer. This reagent was added to the cells at 25 µM and incubated for 1 hour followed by washing. Then, increasing concentrations of MSNs were added as well as 10% hydrogen peroxide (positive control). The cells were incubated for another hour followed by fluorescence measurements with standard fluorescein optical settings.
Pro-Survival Agents. The MSNs were loaded with drug as described previously [26, 27]. Briefly, MSNs were dissolved in PBS at 2 mg/mL and then recombinant IGF-1 (Peprotech) to 23 µg/mL working concentration was added with rotation in the cold room. Four hours later, the material was washed with PBS three times. To monitor the loading, we used a bicinchoninic acid (BCA) assay (Thermo) according to the manufacturer's instructions. The samples pre- and post-loading and standards from 2 - 30 µg/mL IGF were measured with the bicinchoninic acid assay.
We also used a Dylight 680-labled analogue of the IGF protein (IGF-680). This construct was prepared by adding 100 µg of IGF to 50 µg (~16-fold molar ratio dye:IGF) of Dylight680-NHS ester for 1 hour. The product was cleaned with size exclusion chromatography and confirmed by mass spectrometry. Release of IGF from the MSNs was monitored with fluorescence. Here, 1.5 mg of MSNs loaded with IGF-680 was placed in 500 µL of PBS. The sample was periodically centrifuged and the fluorescence of the supernatant measured to estimate release of the IGF-680 from the MSN.
In Vivo Imaging. All animal work was conducted in accordance with the Administrative Panel on Laboratory Animal Care at Stanford University. MSNs were labeled at 250 µg/mL in media for 4 hours and then washed 3 times to remove unbound MSNs. The cells were then detached from the flask and counted. Cell pellets were resuspended in 100 µL of 50:50 media:matrigel and implanted into the left ventricle wall of nude mice under ultrasound guidance with a custom-made 30 gauge catheter. Imaging conditions include a 40 MHz transducer at 300 frames per second.
Statistical Analysis. Unless stated otherwise, all experiments use 3 replicates. Data means and standard deviation were computed in Microsoft Excel 2007. The standard error of measurement was calculated from the standard deviation and n (number of independent trials). We used a two-tailed Student's t test for significance and considered p values <0.05 to be significant. Limits of detection were calculated at 3 standard deviations above the background mean.
Results
Our goal is a “theranostic” nanoparticle that increases cell survival both through diagnostic imaging and therapeutic drug delivery (Fig. 1A). The ultrasound signal will allow intra-cardiac delivery away from fibrotic tissue, and the delivery of growth factors will increase cell survival after the trauma of ischemia and cell transplantation. Below we describe the synthesis and characterization of theranostic MSNs, their utility in cell imaging, and their performance as drug delivery vehicles for IGF.
Nanoparticle Characterization and Degradation. Our first step was to characterize the material. Fractions were dried to completeness and weighed to determine a working concentration of 22.1 ± 0.2 mg/mL. We then diluted the material to an optical density of 0.1 and dried 2 µL on a formvar grid overnight for TEM (Fig. 1B, C). We collected over 20 fields-of-view with an average of 15 MSNs per image. The average size by TEM was 384 ± 134 nm (Fig. 1E). We used TEM and line profiling to study the pore size and found the pore size was 4.1 ± 1.1 nm (Fig. 1D), which agreed well with the manufacturer's reported pore size. The EDS analysis showed obvious peaks from silicon and oxygen as well as small but characteristic gadolinium peaks near 927, 6030, and 6730 meV (Fig. 1F). Dynamic light scattering studies of freshly suspended particles had a peak near 2000 nm and PDI values over 0.6 indicating a lack of colloidal stability and agglomeration. After one hour of settling on the bench, we could obtain the data in Figure 1E with a peak at 255 nm and a PDI value of ~0.3. We used ICP and measured 3.1 x 10⁶ Gd atoms per MSN. We estimated the average weight per MSN to be 2.2 x 10⁻¹⁴ g by measuring the number of particles per volume with a Nanosight instrument and converting with the known mgs of MSN per volume, i.e. 22.1 mg/mL in stock concentration diluted 10,000-fold for Nanosight measurement. Using the 2.2 g/cm3 density of silica, this average particle weight corresponds to a nanoparticle porosity of approximately 50%.
Figure 1
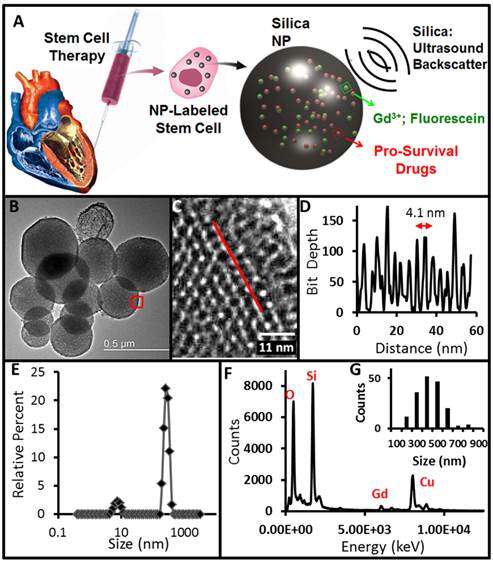
Experimental Design and Physical Characterization. A) MSNs have impedance mismatch to backscatter ultrasound, MRI signal via Gd3+ and optical signal from fluorescein. The same nanoparticles offer sustained release of IGF to increase MSC survival. B) TEM images show mesoporous particles with 4.1 nm pores (C) determined by line profiling (D). Red box in B indicates area imaged at higher magnification in C. Line in C is representative of profile used to construct D. Panel E is DLS data of the MSNs. Further characterization by EDS shows expected peaks for silicon and oxygen as well as gadolinium from the secondary tag (F). Copper signal in F is from the TEM grid. Panel G is a histogram of MSN sizes from the TEM data in nm.
Figure 2
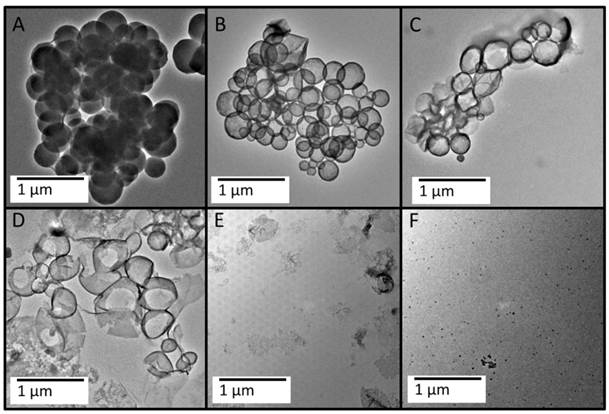
Biodegradation of the MSNs in vitro. A 200 mL sample of 0.22 mg/mL MSNs was exposed to dynamic 0.1X PBS and stirred in a sintered glass funnel (see Additional File 1: Fig. S2). The retentate was collected and imaged with TEM at the following time points: 30 minutes (A), 7 days (B), 12 days (C), 15 days (D), 18 days (E), and 24 days (F). The MSNs appear to be degrading from the inside out with a hollow morphology appearing over time (B, C), which finally collapses upon itself (D, E).
We next serially diluted the product and measured the ultrasound and MRI signaling capacity of the product (Additional File 1: Fig. S1). The calculated limit of detection via ultrasound is 1.2 µg/mL and 15.6 µg/mL via MRI. This is 0.09 pM MSN by ultrasound and 1.2 pM by MRI. To assess whether any Gd3+ was dissociated from the MSNs and free in the solution, we also imaged the supernatant from 250 µL of 22.1 mg/mL of centrifuged MSNs. The MRI of the supernatant had T1-weighted signal identical to the water control. By ICP, the free Gd3+ in solution was 400-fold lower than the MSN solution.
The next goal was to understand nanoparticle degradation with an open dissolution system Additional File 1: Fig. S2A). We used ICP to measure Si and Gd in the eluate (Fig. S2B), and the retentate was studied with TEM (Fig. 2). The ICP data shows that the release of DOTA-chelated Gd is highest 48 hours after the beginning of the dissolution study, and the silicon has a maximum concentration 7 days into the study (Additional File 1: Fig. S2). To determine if the sintered glass funnel could be artificially inflating the Si concentration, we measured the Si concentration in buffer passed through the funnel, but with no MSNs. The average Si concentration in these samples was 11.5 ± 2.7 ppm Si—more than 80-fold lower than the even the lowest sample concentration measured (0.927 ppm on day 22 of the study).
We also recorded the volume of eluent at each time point and used the volume and concentration to calculate that the amount of Si present in all fractions was 8.38 mg of Si or 27.5 mg of SiO4-. This is 94.2% of the original 29.2 mg of sample that was added to the dissolution apparatus indicating nearly complete dissolution in 24 days and confirming the TEM data. As a control, we also studied the dissolution of Stöber nanoparticles. These materials show the same morphology after 24 days of dissolution testing (Fig. S2D) as they did at day 0 (Fig. S2C). While these materials did initially release some small amounts of Si in dissolution, the Si values are 5- to 10-fold lower (Fig. S2B) that of MSNs.
Nanoparticle Labeling, Fate, and Cytotoxicity. Next we studied the ability of the MSNs to label MSCs (Additional File 1: Fig. S3). We altered both the incubation time and concentration and measured the uptake with fluorescence. We noted a plateau in signal from 100 - 250 µg/mL indicating that further increases did not result in higher signal and suggesting that no more nanoparticles could be loaded inside of the cells (Fig. S3A). Similarly, 4 hours of incubation time was found to be optimal—more than 4 hours did not increase loading levels, but at 24 and 48 hours the cell viability decreased 10% and 15%, respectively. Thus, 4 hours of incubation at 250 µg/mL MSNs was used for all subsequent labeling. Epifluorescence microscopy indicated that the particles were localized to the cells with <1% of the MSN signal on the tissue culture flask suggesting low non-specific binding (Fig. S3C). TEM of the labeled cells confirms their localization in the cytosol (Fig. S4). We performed epifluoresence (Fig. 3D) and confocal (Fig. 3E and Additional File 2: Supplementary Video SV1) microscopy, which show punctate clusters of NPs on both the cell interior and periphery indicating endosomal uptake consistent with previous reports[36]. TEM imaging also illustrated the different locations within the MSC that the MSNs may be located (Figs. 3F, G, H). MSNs are seen both in the cytosol (Fig. 3G) and cell surface (Fig. 3H). This remains true even after 1 week of growth (Additional File 1: Fig. S4E). Increasing magnification with TEM clearly illustrates the MSN lattice inside the MSC (Fig. S4D). The mode size of endocytosed MSNs was 350 nm (Fig. S4F) similar to Fig. 1E. We dissolved MSCs labeled with MSNs in 10 M NaOH base and measured Si content to estimate 22,000 MSNs per MSCs. This volume is ~500 µm3 of MSN or approximately 3% of a typical 30 µm MSC.
With a defined labeling protocol in hand, we next tested the ability to image the cells with ultrasound and MRI. Cells labeled for 4 hours at 250 µg/mL were washed and detached from the tissue culture flask. Increasing numbers of cells from 0 to 700,000 were placed in replicate wells of a 384 well plate to serve as an imaging phantom. This was selected because the volume of each well is 112 µL, which is similar to the 100 µL injection volumes used in vivo [3]. Cells were imaged with both ultrasound (Fig. 3A) and T1-weighted MRI (Fig. 3B). The data show a linear relationship between the number of cells and imaging signal, which is important for quantitative applications (Fig. 3C). The R2 value for MRI was 0.995. The ultrasound data show some plateau effect perhaps due to shadowing at higher concentrations of cells [37], however the R2 values were 0.97 and 0.98 at 16 and 40 MHz, respectively for counts at and below 350,000. The limits of detection were 9,200 for 40 MHz ultrasound, 15,000 for 16 MHz ultrasound, and 85,000 for MRI.
These labeled cells were further studied to understand biodegradation inside of cells. MSCs labeled with the MSNs were imaged with TEM 1, 2, and 3 weeks after labeling (Fig. 4). At one week, many MSNs are still present in the cells (Fig. 4A). This was confirmed with EDS data—all 9 of 9 spots imaged had a robust silicon peak (Fig. 4E). However, by 2 weeks, the MSNs had less organized structures (Fig. 4B). By week 3 no MSNs could be seen, except for some extremely collapsed structures (Fig. 4C). Although some spherical objects were noted, EDS analysis indicated only osmium from the staining protocol and thus were not MSNs (only 3 of 9 spots imaged with EDS had Si peaks above background).
Figure 3
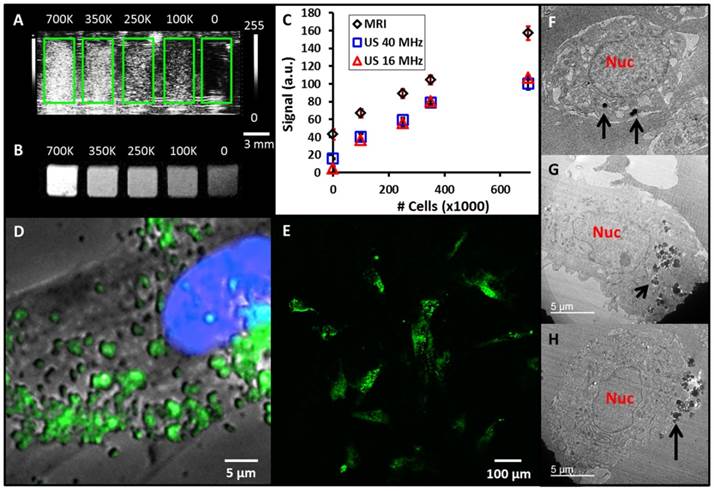
MSN-labeled MSCs. A) Coronal view of 40 MHz ultrasound imaging of decreasing number of MSN-labeled MSCs. Green boxes outline the boundaries of wells in the phantom. B) Transverse view from T1-weighted MRI of the same cell sample. Scale bar and intensity bar to the right of A apply to both panels. C) Dose response curves for increasing numbers of cells shows linear relationships at R2 >0.97 for both MRI and ultrasound (US). D) Epifluoresence microscopy with MSC nucleus in blue and MSNs fluorescently tagged in green. Punctate areas are seen indicating endosomal accumulation of MSNs. E) Confocal microscopy image indicating that the MSNs are located both on the cell periphery and interior. Panels F-H are three representative TEM images of MSCs labeled with MSNs. Note that the MSNs are located both on the cell periphery (F, H) and interior (G). Nuc: nucleus; Black arrows: MSNs.
Figure 4
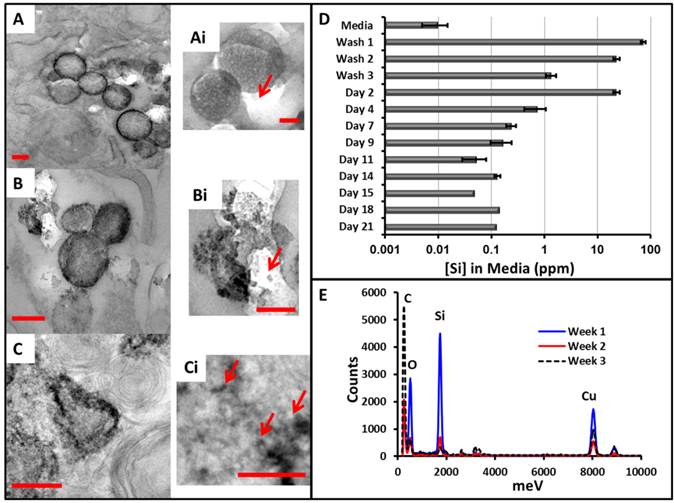
Biodegradation of the MSNs. MSCs were labeled with MSNs and cultured for 1 (A), 2 (B), or 3 (C) weeks and then analyzed with TEM. A similar change in morphology is seen as the in vitro experiments including a hollowing from the inside out and finally a collapse (C). The smaller panels (Ai, Bi, and Ci) show digital magnification to highlight the nanoparticle degradation. Arrows indicate smaller fragments of MSNs. During this experiment, media from the adherent cells was collected periodically and measured for Si with ICP (D). The three washes after labeling show decreasing Si content as free MSNs are removed. The concentration peaks at day 2 and then gradually decreases to baseline near day 11. (E) The EDS data of areas with nanoparticles shows decreasing Si and O signal as a function of time. Scale bars in A-C represent 250 nm, and those in Ai-Ci are 125 nm. Error bars in D represent the standard deviation of 3 replicates (up to day 7) and 2 replicates (days 9-14).
We also measured the amount of Si in the media at various time points (Fig. 4D), and this data again confirms that the MSNs were biodegrading intracellularly. During the washes, the concentration goes from nearly 100 ppm to 1 ppm. Interestingly, by day 2, this increases nearly 20-fold. This suggests degradation even inside of the cells with release of the silicic acid monomers into the media and not residual free MSNs from the labeling protocol. This concentration then continues to drop until approaches the background levels (<0.001 ppm Si) in fresh cell culture media (no MSNs).
The next goal was to determine whether cytotoxic effects were produced by labeling the cells with the MSNs. We used a variety of chemical tools to measure the cells' metabolism, viability, oxidative stress, and inflammatory status. We measured the effect of mitochondrial reductase (a well-known marker of cell metabolism) with both MTS (Fig. 5A) and resazurin (Fig. 5B)—both assays indicated no effect on cell metabolism. For MTS, the 500 μg/mL concentration of MSNs did show a 10% decrease, but it was not significant (p = 0.07). There was no statistically significant change even at levels up to 1000 μg/mL, the positive control of CTAB was 70% lower however and validated the assay. The endpoint of the MTS assay is an absorbance measurement, and we were concerned that absorbance from nanoparticles inside of the cells could artificially contribute to the optical density. Thus, we removed the media from all wells and plated it in a fresh plate. While the absolute value of the OD did decrease for all wells, the toxicity trends remained the same.
The release of ATP is another marker of cell count and viability and decreased ATP levels can correspond to toxicity [38]. An ATP assay using luciferase shows little change due to MSNs. The concentration decreased 25% due to treatment with ethanol as a positive control and actually increased 17% at 1000 μg/mL of MSNs (Fig. 5A). Additional assays such as the EthD-III assay showed no significant increase in cell signal versus baseline, except the positive control (34% increase) and the 500 μg/mL sample (64% increase; Fig. 5B). Measurement of ROS indicated that levels increased at a MSN concentration of 1000 µg/mL (Fig. 5C). Finally, we measured whether the presence of MSNs affected the growth kinetics of MSCs (Fig. 5D). Control cells and cells labeled with MSNs at 250 µg/mL were plated at 1000 cells/cm2 and monitored daily. There was no significant (p>0.05) change in their doubling time—2.46 days for unlabeled cells and 2.48 days for labeled cells. We also studied cells that had been labeled with MSNs 5 days prior to see if there was any delayed effects (Fig. 5D, Pos*). The doubling time of this population was again unchanged at 2.57 days.
Pro-survival Agent Loading and Utilization. Although IGF has been shown to promote cell survival in vivo[8, 33, 34], we briefly confirmed this observation here. To simulate necrotic regions within the heart, cells were grown in incomplete media, i.e., cell culture media with no fetal bovine serum or L-glutamine. This media was supplemented with increasing concentrations of IGF as a pro-survival factor. After 5 hours, we noted 25% increased viability in the cells grown with 200 ng/mL IGF (Fig. 6A). Next, we characterized the ability of the MSNs to incorporate IGF. To estimate the amount of IGF loaded into the MSNs we used a BCA assay. For samples with a starting concentration of 23.0 µg/mL IGF, the final concentration after 4 h incubation in samples without MSNs was 18.4 ± 1.2 µg/mL IGF and in samples with MSNs was 12.5 ± 0.1 µg/mL. This decrease was significant at p<0.01. Considering the reaction volume and 7.6 kDa molecular weight of IGF, this difference is 1.1 x 10¹⁴ IGF proteins loaded on the 3.2 mg of MSNs or 750 IGF proteins per MSN (500 µg protein/g MSN).
To monitor release of the IGF, we used a fluorescently tagged IGF and monitored its release into solution (Fig. 6B). In this experiment, we washed the nanoparticles three times after loading. The fluorescence of the third wash was 103 ± 13 a.u. Three hours later, this value increased to 202 ± 16 a.u. This indicates that IGF was diffusing out of the MSN pores and was not a result of incomplete washing. The IGF signal remained significantly (p<0.05) elevated during successive buffer exchanges for up to 48 hours (Fig. 6B).
We next plated cells at 5000 cells/cm2 and used the theranostic MSNs with MSCs and measured cell proliferation with a MTS assay over multiple days (Fig. 6C). Cells grown in complete media (CM) had viability that was 30-50% higher than those grown in serum free incomplete media (ICM). The difference between the complete media and incomplete media was significant at p<0.01. MSCs grown in media supplemented with free IGF (no MSNs) for 24 hours had viability that was 10% lower than complete media, but 10% higher than incomplete media. These differences were not significant (p>0.05). To test whether metabolism of the IGF protein was the mechanism of action, we also studied the proliferative effect of 200 ng/mL BSA—it had no statistically significant effect. This suggested that the IGF specifically encouraged cell survival, however this effect was short lived.
Figure 5
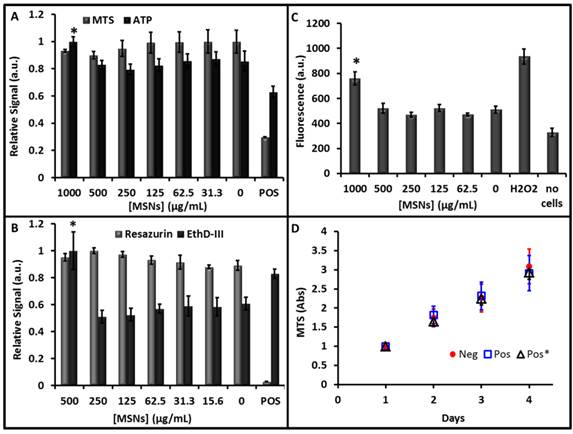
Cytotoxicity data. Increasing concentrations of particles were used to label MSCs for 4 hours followed by treatment with different markers of cytotoxicity. All experiments were validated with a positive control (POS). A) The MTS reagent measures cell metabolism and showed no decrease at any concentration studied. A luciferase assay indicates that ATP production increased 17% at 1000 µg/mL, but this does not indicate toxicity. B) The resazurin (Alamar Blue) assay showed no decrease in cell cellular metabolism at any concentration, however the EthD-III viability marker indicated an increase in apoptosis at 500 µg/mL. C) The DCFH-DA assay showed increased ROS generation in the hydrogen peroxide positive control and 1000 µg/mL concentration. D) The proliferation assay monitored growth of naïve cells (Neg), cells labeled with 250 µg/mL MSNs 4 hour prior (POS), and cells labeled with 250 µg/mL MSNs 5 days prior (Pos*). We found no change in the proliferation rate across these three samples. Error bars in all panels represent the standard deviation of at least 4 replicates.
Figure 6
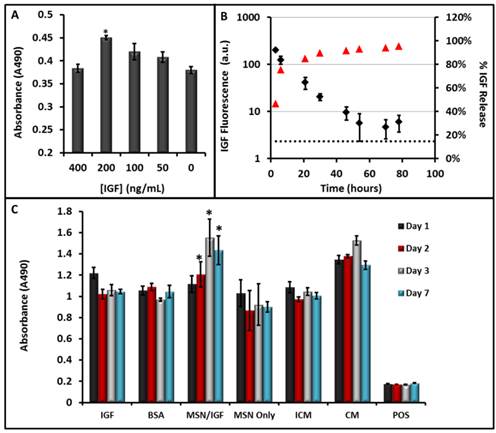
Pro-Survival Agents. A) The ability of IGF to increase cell survival under serum-free conditions was studied at increasing concentrations of IGF—values of 200 ng/mL were optimal and significantly (p<0.001) increased viability 25% relative to untreated cells. B) The release kinetics of IGF from the MSNs showed sustained release up to 48 hours. Here red triangles are the percent of total release (right axis) and the black diamonds are absolute fluorescence from free IGF. C) Sustained release of (IGF) from porous MSNs increases cell survival under serum-free media challenge as studied with MTS assay. The * indicates that the IGF-NPs had a statistically significant increase in viability versus incomplete media (p<0.05) and free IGF (p<0.05). IGF: Free IGF; BSA: Bovine Serum Albumin Control; MSN/IGF: MSNs loaded with IGF; ICM: Incomplete Media (serum-free); CM: Complete Media. Error bars represent the standard error.
By day 2, the IGF-NPs had a statistically significant increase in viability compared to incomplete media (p<0.05) and compared to free IGF (p<0.05). After one week of incubation in serum-free media, the MSCs with theranostic MSNs have viability that is 40% higher than MSCs grown in complete media (p<0.05). Other important controls included cells with MSNs only (no IGF). They had viability values similar to those in the incomplete media and suggested that there was no chemical interference with the MTS assay that may have artificially increased the MSN-IGF signal. A positive control that killed the cells with CTAB also validated the assay.
In a final study, we injected nude mice with MSN-labeled MSCs or vehicle control (Fig. 7; Additional File 3: Supplementary Video SV2). We noted a 2-fold increase in backscatter after implanting 500,000 MSCs and a 1.2-fold increase in backscatter after implanting vehicle only. The increase from the MSCs is due to their MSN label and the trauma of implant causes the 20% increase in backscatter from the vehicle. We estimated cell counts down to 100,000 should be detectable based on 3 standard deviations above the background.
Discussion
Our goal was to deploy the established utility of MSNs in both imaging and drug delivery to cardiac stem cell therapy (Fig. 1). Indeed, silica[39-41] and silicon-based[42, 43] mesoporous nanoparticles offer sustained release of drug in close proximity to the cells at high local concentrations with less off-site effects[44] and can markedly increase cell survival[45]. A further advantage of these designs is that imaging can be done through multimodal approaches including MRI [43, 46], optical, ultrasound [17, 19, 20] as well as multimodality approaches such as optical/PET [47], optical/MRI [48, 49], and ultrasound/gamma imaging [18]. Although MSNs can be made with a variety of aspect ratios [40, 50, 51] and pores sizes [52], we selected commercially available materials with 4 nm pore size because this dimension was well matched to IGF's hydrated radius of 3.5 nm [53]. The 350 nm size has been shown to backscatter ultrasound waves [16, 17]. These nanoparticles are not as monodisperse as gold nanoparticles or as colloidally stable as quantum dots, but these features contribute to their ultrasound echogenicity. We previously showed that agglomeration inside the cell actually increased the ultrasound backscatter [16]. Colloidal stability would be a much more important consideration if these particles were being injected intravenously, but because cell labeling is done ex vitro follow by in vivo implantation we are less concerned about the poor colloidal stability.
Figure 7
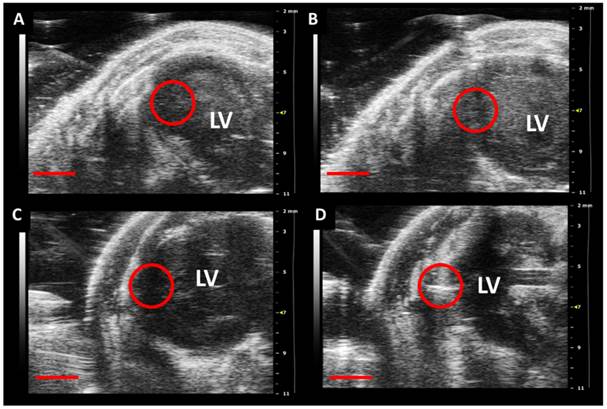
In vivo Implantation of MSN-Labeled MSCs. Panels A and C are pre-injection and panels B and D are post-injection of either vehicle (B) or 500,000 MSCs (D) into the left ventricle wall of nude mice. The red circle indicates the area of implantation and the increased echogenicity in D verus the pre-injection panel is clear. No such signal increase occurs for the control in B. Scale bar represents 2 mm. LV: Left Ventricle.
One consideration of using nanoparticles for drug delivery is clearance of the carrier from the body. Poly-lactic-co-glycolic acid and polyethylene glycol have established utility in drug delivery and renal clearance, but their impedance mismatch is insufficient to generate ultrasound signal. While silica sol-gel nanoparticles <10 nm can clear via urinary excretion [54], the sizes needed for ultrasound signal (>50 nm) are limited by long-term accumulation in the reticuloendothelial system. In contrast, we were happy to find that MSNs had both good ultrasound/MRI signaling capabilities and straightforward degradation both in vitro (Fig. 2) and inside MSCs (Fig. 4).
It was interesting that the nanoparticles seemed to degrade from the inside out. We noted a hollowing of the MSN after one week (Fig. 2B), and collapse of this shell during the third week of in vitro study (Fig. 2C, D). A similar pattern was noted with cells (Fig. 4C). This may be because lower solubility hydroxides form on the exterior of the MSN or re-precipitation of the silicic monomers. This may also be due to a denser amount of silica on the MSN surface as has been shown for aerosol generated nanoparticles [55]. Regardless, more study is needed to completely understand this observation. The 0.5 mL/min flow rate of PBS that the MSNs experienced during the in vitro experiments is a higher rate of aqueous exchange than the MSNs will experience in the intracellular environment, and this flow rate may have a significant effect on the rate of dissolution. Nevertheless, we still observed nearly complete degradation of these particles by one month in cells (Fig. 4). The degradation time is important because exogenous contrast agents must be stable enough to complete their imaging task, but not so stable that they are never cleared from the body. However, it is rare for cell tracking experiments to proceed beyond the 3-4 weeks demonstrated here. We could also use combination of mesoporous and Stober particles to fine tune the ultrasound imaging window.
Despite the fact that silica nanoparticles are already being used in humans [47] (clinicaltrials.gov NCT02106598), we wanted to confirm that the degradation products did not have any adverse effects. We studied the proliferation of cells labeled with MSNs. During the first 5 days of growth—when silicic acid concentration is the highest (Additional File 1: Fig. S2B)—there was no change in cell proliferation (Fig. 5D).
Labeling with 250 µg/mL MSNs offered both good ultrasound/MRI signal (Fig. 3) and no observable cytotoxicity (Fig. 5). At 250 µg/mL there was no decrease in metabolic activity (MTS and ATP assays) or increase in apoptosis (EthD-III) or ROS. At 500 µg/mL apoptosis increased 60% above control cells. We also noted increased generation of ROS at 1000 µg/mL via DCFH-DA. This concurs with a previous report that showed upregulated ROS generation at 1 mg/mL, but not 0.2 mg/mL of MSNs [56]. However, the 250 µg/mL concentration showed no toxicity and stem cell imaging with cell counts below 10,000 were achieved for ultrasound and below 100,000 for MRI. While this approach does not offer the single cell counting offered by micron-sized iron oxide particles and T2-weighted MRI[57], the detection limits are certainly suitable for the millions or tens of millions of cells used in human trials[2, 58]. These detection limits could also facilitate a strategy in which only a percentage of the cells are labeled.
The MSNs are located both on and inside the stem cells (Fig. 4 and S4) and thus can deliver IGF to the cell surface membrane where IGF receptors are located. We first validated the ability MSNs to sequester and offer sustained release of IGF. We noted release for up to 2 days, which is when 80% of MSCs have been shown to die in vivo [59]. Thus, this delivery may window may have important implications in prevent cell death in the left ventricle wall. Although MSCs with IGF-MSNs in serum-free media still had lower cell viability than those grown in complete media (Fig. 6), they were significantly (p<0.05) more viable than MSCs grow in serum-free media with free IGF. This suggests that the MSNs offer sustained release of IGF to promote cell survival even under serum-free conditions. This may have utility in human trials in which cells are implanted into necrotic and hypoxic regions of the heart. One question that is still unresolved is whether this approach will lead to greater cell survival in damaged myocardium in vivo. We are currently developing stem cells with stable reporter genes to answer this question.
Conclusion
We report a biodegradable MSN with ultrasound and MR imaging capabilities and have used it as a theranostic tool with mesenchymal stem cells. Key findings include: a) cell counting below 10,000 with no measureable cytotoxicity at labeling concentrations of 250 µg/mL, b) biodegradation within cells in under one month, and c) a 40% increase (p<0.05) in cell viability under serum-free conditions. By offering sustained release of IGF to MSCs, the MSNs may encourage cell survival despite transplantation into hypoxic or necrotic regions of the heart. One limitation of this work is that it is not a true marker of cell viability. That is, the MSN is always producing signal regardless of whether the cells is alive or dead. While not unique to MSN nanoparticle imaging agents, and this shortfall could be counteracted by systematically studying cells with both a nanoparticle imaging agent and a reporter gene [60]. Future work will evaluate alternative pro-survival agents such as pinacidil and evaluate the utility of this approach in animal models of human disease.
Supplementary Material
Additional File 1Fig. S1-S4
Supplementary Video SV1
Supplementary Video SV2
Acknowledgements
JVJ acknowledges support from NHLBI (HL117048) and the Burroughs Wellcome Fund (1011172). Instrumentation used in this work was supported by NIH grant S10-OD010344. Infrastructure and TEM imaging support also from NIH U54-CA151459 and P50-CA114747.
We also wish to thank the Victorian government of Australia for partial funding support of this work in the form of a Victorian Postdoctoral Research Fellowship (VPRF) awarded to JLC.
Competing Interests
The authors have declared that no competing interest exists.
References
1. George JC. Stem cell therapy in acute myocardial infarction: a review of clinical trials. Translational Research. 2010;155:10-9
2. Bolli R, Chugh AR, D'Amario D. et al. Cardiac stem cells in patients with ischaemic cardiomyopathy (SCIPIO): initial results of a randomised phase 1 trial. Lancet. 2011;378:1847-57
3. Chong JJ, Yang X, Don CW. et al. Human embryonic-stem-cell-derived cardiomyocytes regenerate non-human primate hearts. Nature. 2014;510:273-7
4. Nguyen PK, Lan F, Wang Y. et al. Imaging: guiding the clinical translation of cardiac stem cell therapy. Circ Res. 2011;109:962-79
5. Rodriguez-Porcel M, Gheysens O, Chen IY. et al. Image-guided cardiac cell delivery using high-resolution small-animal ultrasound. Mol Ther. 2005;12:1142-7
6. Vunjak-Novakovic G, Lui KO, Tandon N. et al. Bioengineering heart muscle: a paradigm for regenerative medicine. Annu Rev Biomed Eng. 2011;13:245-67
7. de Vries IJ, Lesterhuis WJ, Barentsz JO. et al. Magnetic resonance tracking of dendritic cells in melanoma patients for monitoring of cellular therapy. Nat Biotechnol. 2005;23:1407-13
8. Laflamme MA, Chen KY, Naumova AV. et al. Cardiomyocytes derived from human embryonic stem cells in pro-survival factors enhance function of infarcted rat hearts. Nat Biotechnol. 2007;25:1015-24
9. Villanueva FS, Jankowski RJ, Klibanov S. et al. Microbubbles targeted to intercellular adhesion molecule-1 bind to activated coronary artery endothelial cells. Circulation. 1998;98:1-5
10. Schutt EG, Klein DH, Mattrey RM. et al. Injectable microbubbles as contrast agents for diagnostic ultrasound imaging: the key role of perfluorochemicals. Angew Chemie Int Ed. 2003;42:3218-35
11. Klibanov AL. Ultrasound contrast materials in cardiovascular medicine: from perfusion assessment to molecular imaging. J Cardio Trans Res. 2013;6:729-39
12. Kuliszewski MA, Fujii H, Liao C. et al. Molecular imaging of endothelial progenitor cell engraftment using contrast-enhanced ultrasound and targeted microbubbles. Cardiovascular Res. 2009;83:653-62
13. Wilson K, Homan K, Emelianov S. Biomedical photoacoustics beyond thermal expansion using triggered nanodroplet vaporization for contrast-enhanced imaging. Nature Comm. 2012;3:618
14. Shapiro MG, Goodwill PW, Neogy A. et al. Biogenic gas nanostructures as ultrasonic molecular reporters. Nat Nanotechnol. 2014;9:311-6
15. Krupka TM, Solorio L, Wilson RE. et al. Formulation and Characterization of Echogenic Lipid- Pluronic Nanobubbles. Mol Pharm. 2009;7:49-59
16. Jokerst JV, Khademi C, Gambhir SS. Intracellular Aggregation of Multimodal Silica Nanoparticles for Ultrasound-Guided Stem Cell Implantation. Sci Trans Med. 2013;5:177ra35-ra35
17. Casciaro S, Conversano F, Ragusa A. et al. Optimal enhancement configuration of silica nanoparticles for ultrasound imaging and automatic detection at conventional diagnostic frequencies. Invest Radiol. 2012;45:715
18. Liberman A, Wu Z, Barback CV. et al. Color Doppler Ultrasound and Gamma Imaging of Intratumorally Injected 500 nm Iron-Silica Nanoshells. ACS Nano. 2013;7:6367-77
19. Liberman A, Martinez HP, Ta CN. et al. Hollow silica and silica-boron nano/microparticles for contrast-enhanced ultrasound to detect small tumors. Biomaterials. 2012;33:5124-9
20. Martinez HP, Kono Y, Blair SL. et al. Hard shell gas-filled contrast enhancement particles for colour Doppler ultrasound imaging of tumors. Med Chem Comm. 2010;1:266-70
21. Milgroom A, Intrator M, Madhavan K. et al. Mesoporous silica nanoparticles as a breast-cancer targeting ultrasound contrast agent. Colloids Surf B: Biointerfaces. 2014;116:652-7
22. Jokerst JV, Thangaraj M, Kempen PJ. et al. Photoacoustic imaging of mesenchymal stem cells in living mice via silica-coated gold nanorods. ACS Nano. 2012;6:5920-30
23. Ryu JC, Davidson BP, Xie A. et al. Molecular imaging of the paracrine proangiogenic effects of progenitor cell therapy in limb ischemia. Circulation. 2013;127:710-9
24. Kokhuis T, Skachkov I, Naaijkens B. et al. Intravital microscopy of localized stem cell delivery using microbubbles and acoustic radiation force. Biotech Bioeng. 2015;112:220-7
25. Torney F, Trewyn BG, Victor SYL. et al. Mesoporous silica nanoparticles deliver DNA and chemicals into plants. Nat Nanotechnol. 2007;2:295-300
26. Slowing II, Trewyn BG, Giri S. et al. Mesoporous silica nanoparticles for drug delivery and biosensing applications. Adv Func Mater. 2007;17:1225-36
27. Igor I, Trewyn BG, Victor SYL. Mesoporous silica nanoparticles for intracellular delivery of membrane-impermeable proteins. J Am Chem Soc. 2007;129:8845-9
28. Li Z, Barnes JC, Bosoy A. et al. Mesoporous silica nanoparticles in biomedical applications. Chem Soc Rev. 2012;41:2590-605
29. Tarn D, Ashley CE, Xue M. et al. Mesoporous silica nanoparticle nanocarriers: biofunctionality and biocompatibility. Acc Chem Res. 2013;46:792-801
30. Caltagirone C, Bettoschi A, Garau A. et al. Silica-based nanoparticles: a versatile tool for the development of efficient imaging agents. Chem Soc Rev. 2015 [Epub ahead of print]
31. Kresge C, Leonowicz M, Roth W. et al. Ordered mesoporous molecular sieves synthesized by a liquid-crystal template mechanism. Nature. 1992;359:710-2
32. Chen F, Zhu Y. Chitosan enclosed mesoporous silica nanoparticles as drug nano-carriers: sensitive response to the narrow pH range. Microporous Mesoporous Mater. 2012;150:83-9
33. Davis ME, Hsieh PC, Takahashi T. et al. Local myocardial insulin-like growth factor 1 (IGF-1) delivery with biotinylated peptide nanofibers improves cell therapy for myocardial infarction. Proc Natl Acad Sci USA. 2006;103:8155-60
34. Haider HK, Jiang S, Idris NM. et al. IGF-1-overexpressing mesenchymal stem cells accelerate bone marrow stem cell mobilization via paracrine activation of SDF-1α/CXCR4 signaling to promote myocardial repair. Circ Res. 2008;103:1300-8
35. Finnie KS, Waller DJ, Perret FL. et al. Biodegradability of sol-gel silica microparticles for drug delivery. J Sol-Gel Sci Tech. 2009;49:12-8
36. Huang D-M, Hung Y, Ko B-S. et al. Highly efficient cellular labeling of mesoporous nanoparticles in human mesenchymal stem cells: implication for stem cell tracking. FASEB J. 2005;19:2014-6
37. Kremkau F, Taylor K. Artifacts in ultrasound imaging. J Ultrasound Med. 1986;5:227-37
38. Crouch S, Kozlowski R, Slater K. et al. The use of ATP bioluminescence as a measure of cell proliferation and cytotoxicity. J Immunol Meth. 1993;160:81-8
39. Santra S, Zhang P, Wang K. et al. Conjugation of biomolecules with luminophore-doped silica nanoparticles for photostable biomarkers. Anal Chem. 2001;73:4988-93
40. Suteewong T, Sai H, Hovden R. et al. Multicompartment mesoporous silica nanoparticles with branched shapes: An epitaxial growth mechanism. Science. 2013;340:337-41
41. Kim J, Kim HS, Lee N. et al. Multifunctional uniform nanoparticles composed of a magnetite nanocrystal core and a mesoporous silica shell for magnetic resonance and fluorescence imaging and for drug delivery. Angew Chemie Int Ed. 2008;47:8438-41
42. Park J-H, Gu L, Von Maltzahn G. et al. Biodegradable luminescent porous silicon nanoparticles for in vivo applications. Nat Mater. 2009;8:331-6
43. Ananta JS, Godin B, Sethi R. et al. Geometrical confinement of gadolinium-based contrast agents in nanoporous particles enhances T1 contrast. Nature Nano. 2010;5:815-21
44. Segers VF, Lee RT. Biomaterials to enhance stem cell function in the heart. Circ Res. 2011;109:910-22
45. Stephan MT, Moon JJ, Um SH. et al. Therapeutic cell engineering with surface-conjugated synthetic nanoparticles. Nat Med. 2010;16:1035-41
46. Taylor KM, Kim JS, Rieter WJ. et al. Mesoporous silica nanospheres as highly efficient MRI contrast agents. J Am Chem Soc. 2008;130:2154-5
47. Benezra M, Penate-Medina O, Zanzonico PB. et al. Multimodal silica nanoparticles are effective cancer-targeted probes in a model of human melanoma. J Clin Invest. 2011;121:2768-80
48. Rieter WJ, Kim JS, Taylor KM. et al. Hybrid silica nanoparticles for multimodal imaging. Angew Chemie Int Ed. 2007;46:3680-2
49. Koole R, van Schooneveld MM, Hilhorst J. et al. Paramagnetic lipid-coated silica nanoparticles with a fluorescent quantum dot core: a new contrast agent platform for multimodality imaging. Bioconjugate Chem. 2008;19:2471-9
50. Meng H, Yang S, Li Z. et al. Aspect ratio determines the quantity of mesoporous silica nanoparticle uptake by a small GTPase-dependent macropinocytosis mechanism. ACS Nano. 2011;5:4434-47
51. Huang X, Li L, Liu T. et al. The shape effect of mesoporous silica nanoparticles on biodistribution, clearance, and biocompatibility in vivo. ACS Nano. 2011;5:5390-9
52. Zhao D, Feng J, Huo Q. et al. Triblock copolymer syntheses of mesoporous silica with periodic 50 to 300 angstrom pores. Science. 1998;279:548-52
53. Sato A, Nishimura S, Ohkubo T. et al. Three-dimensional structure of human insulin-like growth factor-I (IGF-I) determined by 1H-NMR and distance geometry. Int J Peptide Protein Res. 1993;41:433-40
54. Burns AA, Vider J, Ow H. et al. Fluorescent silica nanoparticles with efficient urinary excretion for nanomedicine. Nano Lett. 2008;9:442-8
55. Lu Y, Fan H, Stump A. et al. Aerosol-assisted self-assembly of mesostructured spherical nanoparticles. Nature. 1999;398:223-6
56. Heikkilä T, Santos HA, Kumar N. et al. Cytotoxicity study of ordered mesoporous silica MCM-41 and SBA-15 microparticles on Caco-2 cells. Eur J Pharm Biopharm. 2010;74:483-94
57. Shapiro EM, Sharer K, Skrtic S. et al. In vivo detection of single cells by MRI. Mag Res Med. 2006;55:242-9
58. Makkar RR, Smith RR, Cheng K. et al. Intracoronary cardiosphere-derived cells for heart regeneration after myocardial infarction (CADUCEUS): a prospective, randomised phase 1 trial. Lancet. 2012;379:895-904
59. Tang YL, Tang Y, Zhang YC. et al. Improved graft mesenchymal stem cell survival in ischemic heart with a hypoxia-regulated heme oxygenase-1 vector. J Am Coll Cardiol. 2005;46:1339-50
60. Yaghoubi SS, Berger F, Gambhir SS. Studying the biodistribution of positron emission tomography reporter probes in mice. Nat Protoc. 2007;2:1752-5
Author contact
![]() Corresponding author: jokerstedu.
Corresponding author: jokerstedu.
Citation styles
APA
Kempen, P.J., Greasley, S., Parker, K.A., Campbell, J.L., Chang, H.Y., Jones, J.R., Sinclair, R., Gambhir, S.S., Jokerst, J.V. (2015). Theranostic Mesoporous Silica Nanoparticles Biodegrade after Pro-Survival Drug Delivery and Ultrasound/Magnetic Resonance Imaging of Stem Cells. Theranostics, 5(6), 631-642. https://doi.org/10.7150/thno.11389.
ACS
Kempen, P.J.; Greasley, S.; Parker, K.A.; Campbell, J.L.; Chang, H.Y.; Jones, J.R.; Sinclair, R.; Gambhir, S.S.; Jokerst, J.V. Theranostic Mesoporous Silica Nanoparticles Biodegrade after Pro-Survival Drug Delivery and Ultrasound/Magnetic Resonance Imaging of Stem Cells. Theranostics 2015, 5 (6), 631-642. DOI: 10.7150/thno.11389.
NLM
Kempen PJ, Greasley S, Parker KA, Campbell JL, Chang HY, Jones JR, Sinclair R, Gambhir SS, Jokerst JV. Theranostic Mesoporous Silica Nanoparticles Biodegrade after Pro-Survival Drug Delivery and Ultrasound/Magnetic Resonance Imaging of Stem Cells. Theranostics 2015; 5(6):631-642. doi:10.7150/thno.11389. https://www.thno.org/v05p0631.htm
CSE
Kempen PJ, Greasley S, Parker KA, Campbell JL, Chang HY, Jones JR, Sinclair R, Gambhir SS, Jokerst JV. 2015. Theranostic Mesoporous Silica Nanoparticles Biodegrade after Pro-Survival Drug Delivery and Ultrasound/Magnetic Resonance Imaging of Stem Cells. Theranostics. 5(6):631-642.
This is an open access article distributed under the terms of the Creative Commons Attribution (CC BY-NC) License. See http://ivyspring.com/terms for full terms and conditions.