Impact Factor
- Issue 12; 2026
- Issue 11; 2026
- Issue 10; 2026
- Issue 9; 2026
- Issue 8; 2026
- Volume 16; 2026
- Advance Articles
- Past Issues
- Cover Images
- Cover Suggestion
- Index & Coverage
- Special Issues
Introduction
Results and Discussion
Conclusions
Materials and Methods
Supplementary Material
Acknowledgements
References
International Journal of Biological Sciences
International Journal of Medical Sciences
 Global reach, higher impact

Theranostics 2015; 5(5):469-476. doi:10.7150/thno.10694 This issue Cite
Research Paper
Nano-Enabled SERS Reporting Photosensitizers
Arash Farhadi1,2, Áron Roxin1,3, Brian C. Wilson1,2, Gang Zheng1,2,3 ![]()
1. Princess Margaret Cancer Centre, UHN, Toronto, Ontario, Canada
2. Medical Biophysics, University of Toronto, Toronto, Ontario, Canada
3. Department of Pharmaceutical Sciences, University of Toronto, Toronto, Ontario, Canada
Received 2014-10-1; Accepted 2014-12-1; Published 2015-2-6
Abstract

To impart effective cellular damage via photodynamic therapy (PDT), it is vital to deliver the appropriate light dose and photosensitizer concentration, and to monitor the PDT dose delivered at the site of interest. In vivo monitoring of photosensitizers has in large part relied on their fluorescence emission. Palladium-containing photosensitizers have shown promising clinical results by demonstrating near full conversion of light to PDT activity at the cost of having undetectable fluorescence. We demonstrate that, through the coupling of plasmonic nanoparticles with palladium-photosensitizers, surface-enhanced Raman scattering (SERS) provides both reporting and monitoring capability to otherwise quiescent molecules. Nano-enabled SERS reporting of photosensitizers allows for the decoupling of the therapeutic and imaging mechanisms so that both phenomena can be optimized independently. Most importantly, the design enables the use of the same laser wavelength to stimulate both the PDT and imaging features, opening the potential for real-time dosimetry of photosensitizer concentration and PDT dose delivery by SERS monitoring.
Keywords: Porphyrins, SERS, Theranostics, Nanoparticles, PDT, Dosimetry
Introduction
Photodynamic therapy (PDT) combines the use of light at appropriate wavelengths with a photoactive drug (photosensitizer) to produce highly toxic reactive oxygen species (ROS)[1]. PDT has had a long history of clinical interest in several fields, including bacterial sterilization and treatment of cancer[2]. Early advances of PDT were limited to the treatment of superficial lesions due to the short excitation wavelengths of 1st generation photosensitizers, but the development of photosensitizers excitable at longer wavelengths have enabled the treatment of larger tumor volumes and at greater depths[3]. Highly localized therapeutic delivery of PDT makes this treatment modality especially relevant for tumors originating within or in the vicinity of sensitive organs or tissue structures.
A typical PDT regimen involves systemic or local delivery of the photosensitizer followed by local delivery of light to the target tissue (e.g. tumor). In order to achieve optimal efficacy and safety in individual patients, the light dose delivered to the target, the photosensitizer concentration in the target, and some measure of the effective PDT dose must be monitored. Due to high variability in the optical properties of tissues between patients, accurate light delivery to the site of interest remains a challenge. However, there have been significant advances in devices and algorithms to address this challenge[3, 4]. Given that a large number of photosensitizers are fluorescent, measuring fluorescence emission has been the most widely used approach to monitor photosensitizer accumulation. However, this approach may be compromised by the background autofluorescence of tissues and by the variations in the fluorescence properties of a photosensitizer due to the different microenvironments[5, 6], both of which affect the accuracy and sensitivity of fluorescence-based monitoring.
Palladium (Pd) photosensitizers have demonstrated great clinical potential[7]. They are derived from the porphyrinoid family (i.e. porphyrins, chlorins, bacteriochlorins) where the coordination of Pd2+ ion changes the electronic structure of the photosensitizer such that they can have near 100% singlet oxygen quantum yield[8-10]. Generally, fluorescence quantum yield varies inversely with the singlet oxygen quantum yield. Thus, Pd-photosensitizers are essentially non-fluorescent so that their uptake and biodistribution cannot be monitored using fluorescence spectroscopy or imaging. This is a significant drawback since treatment must be given effectively without knowing this key determinant of treatment dose, which may lead to sub-optimum outcome[6].
Likewise, photosensitizer photobleaching has been the most practical method to date for determining effective PDT treatment delivery[11, 12], based on the concept that the degree of photobleaching is linked to the amount of singlet oxygen generated (which has been validated for several clinical photosensitizers) and so serves as a surrogate for the latter. Again, however, this is limited in practice to fluorescent photosensitizers. Alternatively, monitoring 1168 nm phosphorescent emission of Pd-photosensitizers or the 1270 nm luminescence emission of singlet oxygen have been proposed[6]. However, these techniques have not yet reached clinical practice due to significant technical challenges.
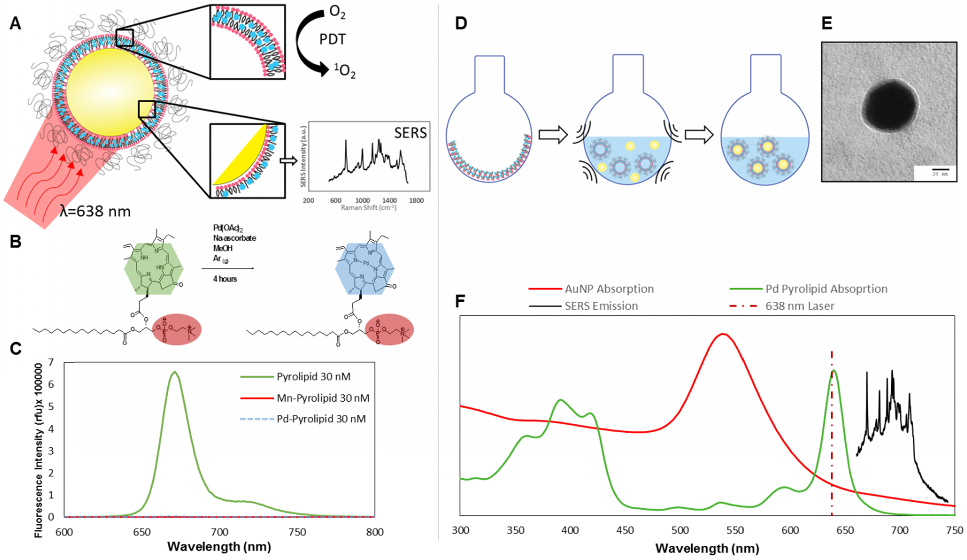
Inspired by the clinical potential of Pd-porphyrinoids and to address the above challenges, we have taken the approach of using the unique photophysical properties of nanomaterials to achieve in vivo monitoring of these fluorescently inactive photosensitizers by exploiting their surface-enhanced Raman scattering (SERS), as illustrated in Figure 1A. We have previously reported on the use of self-assembling porphyrin-lipids (pyrolipid) on the surface of gold nanoparticles to develop stable, bright SERS agents for in vivo molecular imaging[13]. These nanoparticles can be synthesized in a facile procedure, since pyrolipid acts as both the SERS reporting agent, photosensitizer, and the nanoparticle-stabilizing compound. Herein, we demonstrate the development of Pd-pyrolipid theranostic nanoparticles (PdPL-NPs) that, when excited by red light (638 nm), simultaneously are both photodynamically active and emit a bright SERS signal. This represents a possible new approach for in vivo reporting of fluorescently inactive photosensitizers, in which the PDT and real-time SERS reporting function of the nanoconstruct utilize the same excitation wavelength from a single photosensitizer construct. More broadly, for photosensitizers, while fluorescence and PDT rely on two competing mechanisms, nano-enabled SERS reporting photosensitizers use two complementary orthogonal physical mechanisms, absorption and scattering, resulting in the mutually exclusive output of PDT and SERS.
A) Intrinsic SERS reporting theranostic nanoparticle that when excited with 638 nm light simultaneous produce PDT and SERS molecular imaging. B) Palladium metalation of free-base pyrolipid using acetate method. C) Fluorescence measurements of free-base pyrolipid, manganese-pyrolipid, and palladium-pyrolipid in methanol. D) Synthesis of PdPL theranostic nanoparticles using standard liposome techniques to form Pd-porphysomes that are subsequently sonicated onto AuNPs. E) Transmission electron micrograph of PdPL-NP using uranyl acetate lipid staining. F) Absorption and emission spectrum of the different components of PdPL-NPs.
Results and Discussion
Pd-pyrolipid (PdPL) was synthesized using a facile metalation method with Pd(II)(OAc)2 and free-base pyrolipid (pyropheophorbide-a conjugated to a 1-palmitoyl-2-hydroxy-sn-glycero-3-phosphocholine backbone): Figure 1B. The metalation reaction and purification methods gave a 23% yield of the final product, >95% pure by HPLC-MS (Supplementary Material: Figure S1). Following the chelation of Pd2+ ion into the pyrolipid macrocycle, PdPL retains the self-assembly property of pyrolipid and remains amenable to existing liposome-like (viz. porphysome) synthesis methods[14, 15]. PdPL-NPs were formulated by applying ultrasonic energy to a solution containing 60 nm spherical gold nanoparticles and liposome-like Pd-pyrolipid nanostructures (Pd-porphysome): Figure 1D. The lipid layer of PdPL-NPs is composed of amphiphilic Pd-pyrolipid molecules and DSPE-PEG (distearoylphosphatidylethanolamine-poly(ethylene glycol)). The use of DSPE-PEG in the formulation helps enhance the colloidal stability and biologic compatibility of the PdPL-NPs and acts as an anchor for the conjugation of biomolecules to confer targeting. We have previously demonstrated the synthesis of manganese-pyrolipid SERS NPs (MnPL-NPs) as in vitro molecular imaging agents[13] (absorption and emission profiles are illustrated in Supplementary Material: Figure S2). Both metallo-porphyrins (Mn and Pd-pyrolipid) have altered electronic structure of the porphyrin molecules such that both are fluorescently inactive (Figure 1C). However, the underlying mechanisms are different. The insertion of Pd in pyrolipid gives the porphyrin a high ROS quantum yield, whereas manganese-chelated porphyrins favor rapid non-radiative relaxation in which the absorbed light energy is converted only to thermal energy[16]. As a result, Mn-pyrolipids are photodynamically inactive and were used as a control agent to ensure that the results were not confounded by the high absorption extinction of gold nanoparticles.
Figure 1C demonstrates that free-base pyrolipid emits a strong fluorescence signal, while Pd- and Mn-pyrolipids are fluorescently quenched. The three samples were dissolved in methanol at 30 nM to eliminate porphyrin aggregation that would have confounded the fluorescence measurements. Different molar ratios of PdPL and DPSE-PEG can be used to encapsulate AuNPs to produce colloidally stable lipid encapsulated nanoparticles. An increase in Pd-pyrolipid resulted in an increase in SERS signal, up to a maximum of 75% Pd-pyrolipid lipid content (Supplementary Material: Figure S3). Samples with significantly higher Pd-pyrolipid content were not colloidally stable and aggregated during purification (data not shown). Figure 1F illustrates the spectral features (absorption and SERS emission) of each of the PdPL-NP components. The SERS emission of PdPL-NPs result from monodispersed nanoparticles, where the lipid encapsulation helps prevent nanoparticle aggregation. Transmission electron microscopy (TEM) and dynamic light scattering (DLS) were used to demonstrate the nanoparticle monodispersity, vide infra. The excitation wavelength was chosen as 638 nm to allow the use of the multifunctionality of the probe. This wavelength is on-resonance with the high Qy-band extinction of Pd-pyrolipid where metal-enhanced resonant Raman scattering was used to produce strong SERS imaging contrast. Furthermore, Pd-pyrolipid strongly absorbs 638 nm light, generating ROS species for simultaneous PDT treatment. TEM of PdPL-NP illustrates the lipid encapsulation of AuNPs with uranyl acetate using a previously established protocol[13] (Figure 1E and Supplementary Material: Figure S4). DLS was used to measurement the hydrodynamic size of PdPL-NPs, and the measurements showed a monodispersed population with Z-average of 68 nm (polydispersity index of 0.38). The polydispersity index represents the dispersity of the core gold nanoparticles (Ted Pella Inc.) used to synthesis PdPL-NPs.
PdPL-NPs were prepared at varying concentrations from 100 fM to 0.3 nM to measure the effect of nanoparticle concentration on the SERS intensity. Using current imaging conditions, the limit of detection was found to be 100 fM such that the 755 cm-1 SERS peak was discernable over the baseline: Figure 2A. Importantly, the SERS intensity increased linearly with the nanoparticle concentration, allowing facile reporting of its concentration. Singlet oxygen production was assayed using singlet oxygen sensor green (SOSG), where fluorescently-quiescent SOSG selectively reacts with singlet oxygen in the solution to produce fluorescent SOSG-endoperoxide (SOSG-EP) molecules[17]. Figure 2B illustrates the ability of PdPL-NPs to produce ROS species relative to the known PDT-inactive Mn-pyrolipid[16] encapsulating NPs. PdPL-NPs demonstrate a light dose-dependent photogeneration of ROS, indicating their potential for PDT. As expected, SOSG fluorescence measurements for the PDT-inactive MnPL-NPs remained at baseline through light treatment. This rules out confounding interactions, such as fluorescence enhancement of SOSG-EP with the surface of the AuNP, unexpected chemical (or photochemical) reaction with lipids in the SOSG solution, or serendipitous thermal degradation of SOSG into SOSG-EP.
A) Dose-dependent SERS intensity of PdPL-NP with a limit of detection of 500 fM. Inset better illustrates SERS intensity at low nanoparticle concentrations. B) Solution assay of PDT ROS photogeneration showing PdPL-NP concentration dependent ROS release relative to PDT quiescent MnPL-NPs and control. C) Photobleaching dependent SERS intensity correlates with increase in SOSG fluorescence for PDT dosimetry. Black squares correspond to left y-axis illustrating SOSG fluorescence assay and red circles correspond to right y-axis illustrating SERS intensity measurements. D) In vitro MTT assay using KB cells with PdPL-NPs treated with 0-250 pM nanoparticle concentration and 10 J/cm2 light dose. Data for A and C acquired with laser fluence rate 250 mW/cm2 while B and D were acquired with fluence rate of 50 mW/cm2.
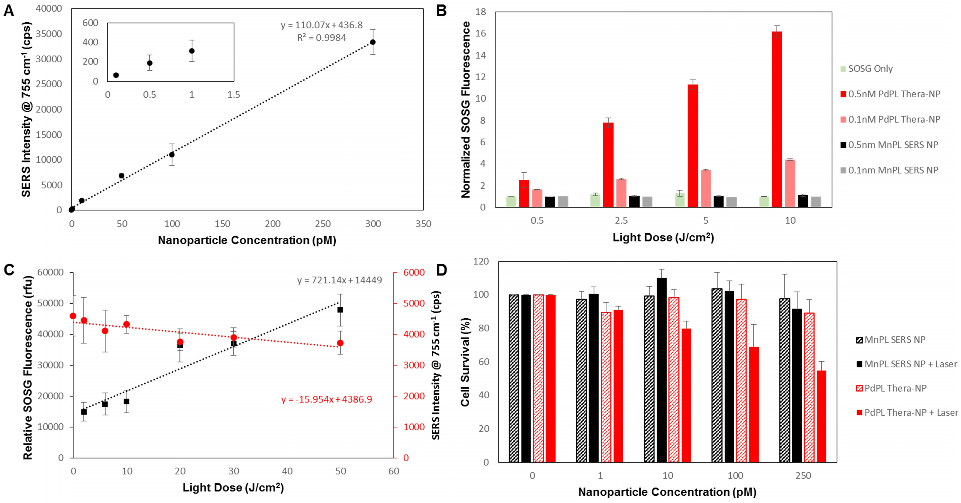
It has been shown that photobleaching of photosensitizers, as monitored by the loss of fluorescence signal, can be used to calculate the singlet oxygen dose delivered to the region of interest[6]. Consequently, we hypothesized that the ability to use the same wavelength to induce PDT and to measure the SERS emission would enable the analogous use of the photobleaching-dependent SERS intensity decrease as a PDT dose metric. To demonstrate this, we investigated the change in SERS signal intensity at different light doses and used the SOSG assay during treatment as a surrogate to measure PDT activity. As the light dose increased from 0 to 50 J/cm2, there was a marked increase in ROS production that corresponded with the decrease in SERS intensity: Figure 2C. Neither the SERS emission from nor the SOSG fluorescence produced by the PDT-inactive MnPL-NPs deviated from the baseline (Supplementary Material: Figure S5). Since, in this experiment, the nanoparticles were suspended in solution and only a small region was irradiated, the rate of SERS signal loss from photobleaching in Figure 2C was likely underestimates due to nanoparticle diffusion into and out of the irradiated volume. Furthermore, by increasing the fluence rate from 250 to 1300 mW/cm2, the change in SERS signal can be further intensified (Supplementary Material: Figure S6).
Efficient PDT damage requires intracellular localization of the photosensitizer with organelles such as mitochondria[2]. Consequently, in vitro PDT treatment was conducted with folate receptor-targeted PdPL-NPs to enhance their endocytosis[18]. A small percentage of DPSE-PEG lipid (1%) was replaced with DSPE-PEG-folate during nanoparticle synthesis. The PDT drug-dose response was studied using KB carcinoma cells (folate receptor positive) incubated with nanoparticles for 4 h prior to washing. Cell survival was measured using the MTT assay. At each dose of either MnPL or PdPL-NPs, cells were treated with 10 J/cm2 light dose at 638 nm. No-light controls were also used. Cell survival was measured 24 h after treatment (Figure 2D).
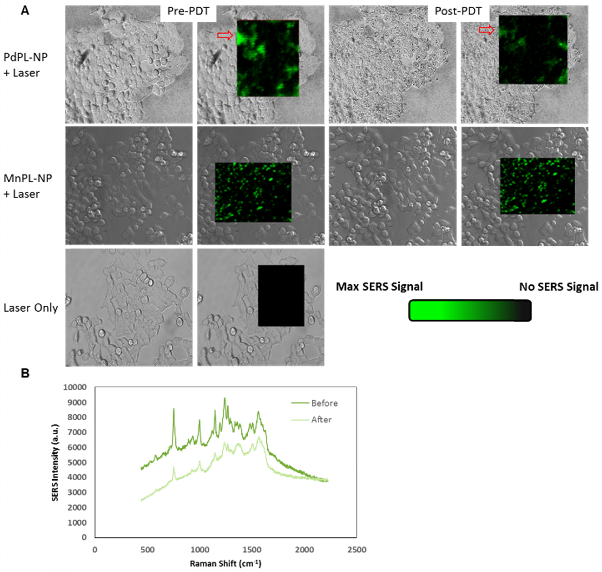
To illustrate that PdPL-NPs possess the capability for simultaneous PDT and SERS imaging, the same cell model and incubation conditions were used. PDT cell damage was imaged using a cell viability fluorescence stain and SERS emission was simultaneously measured on a Raman microscope: Figures 3 and 4. For SERS imaging, a full spectral Raman map was acquired with a motorized Raman spectrometer coupled to an inverted microscope equipped with a deep-depletion silicon CCD array with 600/1200/1800 1/mm grating. In vitro images were acquired using a 20x objective where a bright-field (differential interference contrast mode) image was overlaid with the hyperspectral Raman image of regions of interest. Thus, the Raman images illustrated in Figure 3A are pseudocolor images of the background-corrected area-under-the-curve SERS peak at 755 cm-1 for PdPL-NPs and at 753 cm-1 for MnPL-NPs. Figure 3A is the Raman map taken prior to and after PDT for cells treated with the PdPL-NPs and MnPL-NPs. Of note, the overall Raman intensity after PDT treatment with PdPL-NPs is significantly lower than before treatment. Figure 3B shows representative Raman spectra of PdPL-NP treated sample. This experiment also demonstrates that the photosensitizer was photobleached during PDT and substantiates the concept of using SERS-based monitoring for PDT dosimetry. Cells treated with PdPL-NPs show a discernable change in morphology after PDT treatment, as evident in the bright-field image further indicating PDT-induced cellular damage (Figure 3A).
A) SERS molecular imaging of folate-receptor positive KB carcinoma cells with folate targeted PdPL- and MnPL-NPs. Pseudocolored Raman map overlay of background corrected area-under curve at 755 cm-1 Raman shift for PdPL-NP and 753 cm-1 Raman shift for MnPL-NP. SERS images obtained at laser fluence rate of 250 mW/cm2. B) Representative SERS spectrum of PdPL-NPs from pre- and post-PDT Raman map overlay. Scale bars are 25 μm.
Cell viability (live/dead) assay during simultaneous PDT and SERS imaging. Green channel depicts live cells and red channel depicts compromised/dead cells. Field of view matched with SERS images above.
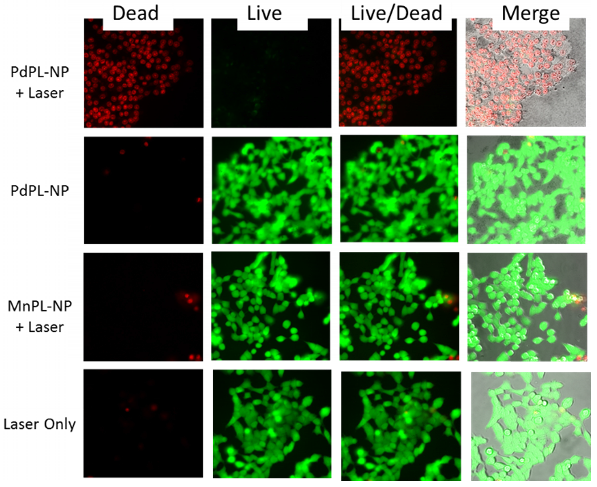
PDT-induced cellular damage was assayed using fluorescence cell staining with Calcein AM for the regions imaged with SERS (Figure 4). This molecule becomes metabolized by the esterase activity of live cells to produce Calcein, a cell-membrane impermeable fluorophore. Non-viable cells were imaged using Ethidium Homodimer-1 (EH-1), a fluorescent cell-membrane impermeable nuclear staining dye that only stains nuclei of cells with compromised cell membrane. Following the PDT treatment discussed above, the cells where incubated with Calcein AM and EH-1 for 30 min prior to fluorescence microscopy. Cells treated with PDT using PdPL-NPs show EH-1 uptake and an absence of Calcein fluorescence, indicating that they were non-viable. The control groups (PdPL-NPs without light, MnPL-NPs plus light, laser-only) remained viable, as indicated by the presence of Calcein fluorescence. The field of view in Figure 4 is the same as Figure 3 to illustrate the simultaneous PDT and SERS capability of PdPL-NPs.
Conclusions
In vivo monitoring of photosensitizers has largely relied on their fluorescence emission[19, 20]. However, this approach is not applicable to some photosensitizers with very high singlet oxygen quantum yield and minimal fluorescence. SERS reporting of photosensitizers, a nano-enabled phenomenon, allows for the decoupling of the therapeutic and the imaging mechanisms for a photosensitizer, so that both can be independently maximized. The use of porphyrin as the reporting agent enables the use of the diverse multifunctional nature of these molecules for many therapeutic and imaging applications[21-25]. Importantly, our design enables the use of the same wavelength for both purposes, which will facilitate real-time monitoring of the photosensitizer in vivo and, through photobleaching-induced loss of the SERS signal, of the effective PDT dose. To our knowledge, simultaneous SERS imaging and PDT have always been achieved previously by combining distinct SERS reporters with fluorescent photosensitizers on the same nanoparticle[26, 27]. The resulting limitation has been the difficulty in discerning the fate of these two components in a biologically complex environment: e.g. the SERS signal could not faithfully track the in vivo biodistribution and pharmacokinetics of the photosensitizer. Our design uses the spectroscopic SERS information during light irradiation as a novel approach to PDT dosimetry. Here, we have demonstrated this as proof-of-concept but there remains challenges that need to be addressed before PdPL-NPs can be used in practice. This includes more in-depth understanding of the underlying mechanism(s) governing the change in SERS intensity in relation to the PDT dose. Our data implicates the decrease in SERS intensity to chemical reactions with Pd-porphyrin and photogenerated ROS, which cause a chemical change to their structure. We note also that, in terms of clinical translation, we have recently demonstrated SERS spectral imaging in endoscopic mode[28], which opens up the potential of using SERS-based dosimetry for endoscopic PDT treatments. Additionally, this platform can take advantage of other metal-enhanced photonic phenomena for additional “built-in” sensing capability. For example, there has been increased interest in tissue oxygenation measurements using oxygen-dependent quenching of Pd-porphyrin phosphorescence[29]. PdPL-NPs hold great potential as a tool to report on the oxygen partial pressure of their environment during PDT treatment. PdPL-NPs may serve as self-reporting photosensitizers where the real-time monitoring of SERS and metal-enhanced phosphorescence emissions can be used to elucidate the photosensitizers' concentration, oxygen partial pressure, and delivered PDT activity. Again, the power of this technology lies in the intrinsic theranostic utility of photonic nanoparticles with photosensitizers instead of using different independent components for the imaging and therapeutic purposes.
Materials and Methods
Synthesis of Palladium- and Manganese-Pyrolipid
The conjugate of pyropheophorbide a and 1-palmitoyl-2-hydroxy-sn-glycero-3-phosphocholine (pyrolipid) was prepared as previously described[14]. Pyrolipid (56 mg, 55.3 μmoles, 1 equiv.), Pd(II)(OAc)2 (124.1 mg, 553 μmoles, 10 equiv.), and sodium ascorbate (76.7 mg, 387.1 μmoles, 7 equiv.) were weighed into a round-bottom flask, and were dissolved in 30 mL of MeOH. The flask was sealed with a rubber septum, and the solution was gently purged with Ar(g) for 4 minutes. The flask was covered in foil and the reaction was stirred in the dark at room temperature for 4 h. A volume of 40 mL of 1-butanol was added to the solution and the mixture was poured into a separatory funnel. The organic layer was washed 6 times with 40 mL of ddH2O containing 2 mL of sat. NaCl(aq). The organic layer was dried with Na2SO4, filtered and dried by rotary evaporation. The product was then resuspended in MeOH and was quantified spectrophotometrically using the molar absorption extinction coefficient of the Pd-pyropheophorbide a chromophore (ε641nm = 39810 M-1 cm-1)[30]. These procedures gave 14.5 mg (13 μmoles) of Pd-pyrolipid for a 23% yield. HPLC-MS analysis revealed that this product was >95% pure according to the AUC of the Qy-band λmax (639 nm) (Supplementary Material: Figure S1A). UV-vis (MeOH) λmax: 360, 395, 420, 536, 640. ESI(+)-MS: [M+1]+ = 1117 (m/z).
Synthesis of manganese-pyrolipid has been previously reported[13, 16]. Briefly, pyrolipid (18.4 μmol, 1eq) MnCl2 (105 μmol, 5eq), and NaOAc (432 μmol, 20eq) were dissolved in glacial acetic acid (5 mL) in a round bottom flask equipped with reflux condenser. Reaction was carried out under air, at 60oC, for 2 h (light protected). Upon completion the solvent was removed under vacuum, and the resulting residue dissolved in CHCl3 and washed 3x in 1:9 mixture of MeOH:ddH2O. ESI(+)-MS: (M+-OAC 100%) 1065 (m/z).
Formation of PdPL Theranostic Nanoparticles and MnPL SERS Nanoparticles
To synthesize PdPL-NPs, Pd-pyrolipid and DSPE-PEG2000 (75% and 25% of total lipid moles, respectively; Avanti Lipids) was dissolved in CHCl3:MeOH mixture (19:1 v/v) and dried thoroughly to form a lipid film. Molar ratio of lipid was kept at 200 nmoles/mL for a 1mL 40 pM colloidal gold solution. Lipid film was solubilized in 1mL PBS using freeze-thaw cycles followed by 10 cycles of extrusion to form liposome-like nanostructures. This solution was mixed with 60 nm colloidal gold solution (Ted Pella) and sonicated at 60oC for 1 h. We have previously reported on the synthesis of MnPL-NPs[13]. Briefly, dry lipid film containing 100 nmol of MnPL, 25 nmol DMPE (2-dimyristoyl-sn-glycero-3-phosphoethanolamine; Avanti Lipids), 25 nmol MHPC (1-myristoyl-2-hydroxy-sn-glycero-3-phosphocholine; Avanti Lipid), 50 nmol DSPE-PEG2000 (distearoylphosphatidyl-ethanolamine-poly(ethylene glycol)2000; Avanti Lipids) is hydrated in the presence of 40 pM (1 mL) of 60 nm citrated stabilize gold nanoparticles in 65oC water bath for 30 seconds. Excess lipids were washed from each sample using repeated centrifugation (3300 rpm for 10 minutes) steps leaving behind PdPL-NP and MnPL-NP solutions, respectively. Folate receptor targeted nanoparticles (PdPL-NP and MnPL-NP) were prepared by replacing 1% DSPE-PEG2000 with DSPE-PEG2000-folate (Avanti Lipids) during the lipid film step of each synthesis protocol.
UV-Vis spectra were obtained by Vis Spectrophotometer (Varian). Transmission electron microscopy (TEM) images were obtained using 10uL samples on glow discharged copper mesh grids with 2% uranyl acetate staining on a Hitachi H-7000 TEM.
ROS Photogeneration Assay
Using black, clear bottom 96-well plates, 100 μL of aliquots of PdPL-NPs, MnPL-NPs, and PBS were prepared in triplicates. SOSG reagent (Molecular Probes) was mixed in MeOH forming a 5 mM stock and subsequently diluted in each sample to a final reagent concentration of 6 μM. Fluorescence measurements were carried out with Spectramax M5 Microplate reader (Molecular Devices) using 504/525 nm excitation/emission. Baseline fluorescence signal was measured and samples to be used for PDT treatment were irradiated with a 638 nm laser at 50 mW/cm2 for 100 seconds. A second fluorescence measurement was taken after laser treatment. Difference in mean signal after laser irradiation was normalized with respect to baseline fluorescence signal. Samples under dark conditions were separated in different plate than laser treated samples to ensure no cross talk.
In Silico Raman Measurements
Raman spectra was obtained using a motorized Raman spectrometer (Renishaw) coupled to an Leica DMI6000 inverted microscope containing a deep-depletion silicon CCD array with 600/1200/1800 1/mm grating and a solid state excitation source (638 nm, 17 mW). Using a 20x objective focused to the center of a nanoparticle solution, Raman spectra was collected with an integration time of one second.
Cell culture
Pathogen free, low passage KB cells (American Type Culture Collection) were cultured in DMEM medium with 10% fetal bovine serum and 1% penicillin and streptomycin supplement. The cell culture media was replenished every two days and cells were passaged at 80% confluency.
Assessment of Cytotoxicity
KB cells were seeded in 96-well plates at 5x10³ cells per well 24 h prior to nanoparticle incubation, in triplicates for each condition. Then, PdPL-NPs and MnPL-NPs premixed in fresh medium at the appropriate concentrations (0-250 pM) were added and incubated with cells for 4 h. Cells were washed 3x to wash away free nanoparticles and subjected to PDT treatment using a 638 nm laser with a light dose of 10 J/cm2 (50 mW/cm2). Cytotoxicity was assessed 24 h later, where cells were incubated with 0.5 mg/mL of MTT reagent (Invitrogen) for 2 h. Thereafter, the media was replaced with 200 μL of 1:1 DMSO/70% isopropanol in 0.1 M HCl and shaken until formazan was fully dissolved. Solution absorbance at 540 nm was measured to determine cell survival relative to control. Cells treated with nanoparticles without light treatment (dark controls) were seeded in separate plates than samples treated with laser.
Live/dead® assay (Calcein AM and Ethidium Homodimer-1; Invitrogen) was used to illustrate phototoxicity of PdPL-NPs via microscopy. KB cells were seeded in 6 well-plates at 4x10⁴ cells per well 24 h prior to nanoparticle incubation. PdPL-NPs and MnPL NPs premixed in fresh medium at 100 pM were incubated with cells for 4 h. Cells were washed 3x to wash away free nanoparticles. KB cells were incubated with Calcein AM and Ethidium Homodimer-1 (final concentration of 2μM and 4μM, respective) for 30 minutes prior to fluorescence imaging.
In vitro Raman microscopy
For in vitro Raman images, the same samples were used as for the live/dead assay. Brightfield images were first acquired (DIC mode) for the region of interest with spatially distinct full Raman spectra, Raman map. Hyperspectral Raman map was likewise acquired with a 638 nm solid state excitation laser focused with 20x (0.85 NA) objectives and integrated for 0.5 seconds per voxel. The SERS image (green pseudocolor) represents background correct area-under-curve intensity of the 753 cm-1 Pd-pyrolipid Raman peak with intensity histogram matched to the same scale for all samples.
Supplementary Material
Figures S1 -S6.
Acknowledgements
We would like to thank Dr. Juan Chen and Dr. Patrick McVeigh for helpful discussions in the planning and analysis of results. Funding was provided by NSERC, CIHR, CFI, the Princess Margaret Cancer Foundation, and the Joey and Toby Tanenbaum/Brazilian Ball Chair in Prostate Cancer Research.
Competing Interests
The authors have declared that no competing interest exists.
References
1. Lovell JF, Liu TW, Chen J, Zheng G. Activatable photosensitizers for imaging and therapy. Chem Rev. 2010;110:2839-57
2. Celli JP, Spring BQ, Rizvi I, Evans CL, Samkoe KS, Verma S. et al. Imaging and photodynamic therapy: mechanisms, monitoring, and optimization. Chem Rev. 2010;110:2795-838
3. Davidson SR, Weersink RA, Haider MA, Gertner MR, Bogaards A, Giewercer D. et al. Treatment planning and dose analysis for interstitial photodynamic therapy of prostate cancer. Phys Med Biol. 2009;54:2293-313
4. Li J, Altschuler MD, Hahn SM, Zhu TC. Optimization of light source parameters in the photodynamic therapy of heterogeneous prostate. Phys Med Biol. 2008;53:4107-21
5. Diamond KR, Patterson MS, Farrell TJ. Quantification of fluorophore concentration in tissue-simulating media by fluorescence measurements with a single optical fiber. Appl Opt. 2003;42:2436-42
6. Wilson BC, Patterson MS, Lilge L. Implicit and explicit dosimetry in photodynamic therapy: a new paradigm. Lasers Med Sci. 1997;12:182-99
7. Moore CM, Pendse D, Emberton M. Photodynamic therapy for prostate cancer--a review of current status and future promise. Nat Clin Pract Urol. 2009;6:18-30
8. Chen CY, Sun E, Fan D, Taniguchi M, McDowell BE, Yang E. et al. Synthesis and physicochemical properties of metallobacteriochlorins. Inorg Chem. 2012;51:9443-64
9. Vakrat-Haglili Y, Weiner L, Brumfeld V, Brandis A, Salomon Y, McLlroy B. et al. The microenvironment effect on the generation of reactive oxygen species by Pd-bacteriopheophorbide. J Am Chem Soc. 2005;127:6487-97
10. Fukuzumi S, Ohkubo K, Zheng X, Chen Y, Pandey RK, Zhan R. et al. Metal bacteriochlorins which act as dual singlet oxygen and superoxide generators. J Phys Chem B. 2008;112:2738-46
11. Jarvi MT, Patterson MS, Wilson BC. Insights into photodynamic therapy dosimetry: simultaneous singlet oxygen luminescence and photosensitizer photobleaching measurements. Biophys J. 2012;102:661-71
12. Cottrell WJ, Paquette AD, Keymel KR, Foster TH, Oseroff AR. Irradiance-dependent photobleaching and pain in delta-aminolevulinic acid-photodynamic therapy of superficial basal cell carcinomas. Clin Cancer Res. 2008;14:4475-83
13. Tam NC, McVeigh PZ, MacDonald TD, Farhadi A, Wilson BC, Zheng G. Porphyrin-lipid stabilized gold nanoparticles for surface enhanced Raman scattering based imaging. Bioconjug Chem. 2012;23:1726-30
14. Lovell JF, Jin CS, Huynh E, Jin H, Kim C, Rubinstein JL. et al. Porphysome nanovesicles generated by porphyrin bilayers for use as multimodal biophotonic contrast agents. Nat Mater. 2011;10:324-32
15. Huynh E, Zheng G. Porphysome nanotechnology: A paradigm shift in lipid-based supramolecular structures. Nano Today. 2014;9:212-22
16. MacDonald TD, Liu TW, Zheng G. An MRI-sensitive, non-photobleachable porphysome photothermal agent. Angew Chem Int Ed Engl. 2014;53:6956-9
17. Gollmer A, Arnbjerg J, Blaikie FH, Pedersen BW, Breitenbach T, Daasbjerg K. et al. Singlet Oxygen Sensor Green: photochemical behavior in solution and in a mammalian cell. Photochem Photobiol. 2011;87:671-9
18. Jin CS, Cui L, Wang F, Chen J, Zheng G. Targeting-triggered porphysome nanostructure disruption for activatable photodynamic therapy. Adv Healthc Mater. 2014;3:1240-9
19. Chi C, Du Y, Ye J, Kou D, Qiu J, Wang J. et al. Intraoperative Imaging-Guided Cancer Surgery: From Current Fluorescence Molecular Imaging Methods to Future Multi-Modality Imaging Technology. Theranostics. 2014;4:1072-84
20. Liu TW, Chen J, Burgess L, Cao W, Shi J, Wilson BC. et al. Multimodal bacteriochlorophyll theranostic agent. Theranostics. 2011;1:354-62
21. Shi JY, Liu TWB, Chen J, Green D, Jaffray D, Wilson BC. et al. Transforming a Targeted Porphyrin Theranostic Agent into a PET Imaging Probe for Cancer. Theranostics. 2011;1:363-70
22. Lin J, Wang S, Huang P, Wang Z, Chen S, Niu G. et al. Photosensitizer-loaded gold vesicles with strong plasmonic coupling effect for imaging-guided photothermal/photodynamic therapy. ACS Nano. 2013;7:5320-9
23. Liu TW, MacDonald TD, Shi J, Wilson BC, Zheng G. Intrinsically copper-64-labeled organic nanoparticles as radiotracers. Angew Chem Int Ed Engl. 2012;51:13128-31
24. Liu TW, Stewart JM, Macdonald TD, Chen J, Clarke B, Shi J. et al. Biologically-targeted detection of primary and micro-metastatic ovarian cancer. Theranostics. 2013;3:420-7
25. Chen XS. Introducing Theranostics Journal - From the Editor-in-Chief. Theranostics. 2011;1:1-2
26. Khaing Oo MK, Yang Y, Hu Y, Gomez M, Du H, Wang H. Gold nanoparticle-enhanced and size-dependent generation of reactive oxygen species from protoporphyrin IX. ACS Nano. 2012;6:1939-47
27. Zhang Y, Qian J, Wang D, Wang Y, He S. Multifunctional gold nanorods with ultrahigh stability and tunability for in vivo fluorescence imaging, SERS detection, and photodynamic therapy. Angew Chem Int Ed Engl. 2013;52:1148-51
28. McVeigh PZ, Mallia RJ, Veilleux I, Wilson BC. Widefield quantitative multiplex surface enhanced Raman scattering imaging in vivo. J Biomed Opt. 2013;18:046011
29. Lecoq J, Parpaleix A, Roussakis E, Ducros M, Goulam Houssen Y, Vinogradov SA. et al. Simultaneous two-photon imaging of oxygen and blood flow in deep cerebral vessels. Nat Med. 2011;17:893-8
30. Arian D, Kovbasyuk L, Mokhir A. Control of the photocatalytic activity of bimetallic complexes of pyropheophorbide-a by nucleic acids. Inorg Chem. 2011;50:12010-7
Author contact
![]() Corresponding author: Gang Zheng: gang.zhengutoronto.ca
Corresponding author: Gang Zheng: gang.zhengutoronto.ca