Impact Factor
- Issue 12; 2026
- Issue 11; 2026
- Issue 10; 2026
- Issue 9; 2026
- Issue 8; 2026
- Volume 16; 2026
- Advance Articles
- Past Issues
- Cover Images
- Cover Suggestion
- Index & Coverage
- Special Issues
Introduction
Materials and methods
Results and discussion
Conclusion
Supplementary Material
Acknowledgements
References
International Journal of Biological Sciences
International Journal of Medical Sciences
 Global reach, higher impact

Theranostics 2015; 5(2):134-149. doi:10.7150/thno.10363 This issue Cite
Research Paper
Insights into the Distinguishing Stress-induced Cytotoxicity of Chiral Gold Nanoclusters and the Relationship with GSTP1
Chunlei Zhang1, Zhijun Zhou1, Xiao Zhi1, Yue Ma1, Kan Wang1, Yuxia Wang2, Yingge Zhang2, Hualin Fu1, Weilin Jin1, Fei Pan1, Daxiang Cui1 ![]()
1. Institute of Nano Biomedicine and Engineering, Key Laboratory for Thin Film and Microfabrication Technology of the Ministry of Education, Department of Instrument Science & Engineering, School of Electronic, Information and Electrical Engineering, Bio-X Center, Institute of Translation Medicine, Shanghai Jiao Tong University, 800 Dongchuan Road, Shanghai 200240, China;
2. Institute of Pharmacology and Toxicology, Academy of Military Medical Sciences, 47 Taping Road, Peking 100850, PR China.
Received 2014-8-18; Accepted 2014-9-15; Published 2015-1-1
Abstract
Chiral gold nanoclusters (Au NCs) exhibit attracting properties owing to their unique physical and chemical properties. Herein we report for the first time chiral gold nanoclusters' cytotoxicity and potential molecular mechanism. The L-glutathione (i.e. L-GSH) and D-glutathione (i.e. D-GSH)-capped Au NCs were prepared and characterized by HRTEM, UV-vis, photoluminescence and circular dichroism (CD) spectroscopy. Results showed that the CD spectra of L-glutathione (i.e. L-GSH) and D-glutathione (i.e. D-GSH)-capped Au NCs exhibited multiple bands which were identically mirror-imaged, demonstrating that the chirality of GSH-capped NCs had contributions from both the metal core and the ligand. The effects of AuNCs@L-GSH and AuNCs@D-GSH on cells were similar based on the cell physiology related cytotoxicity, although the effects became more prominent in AuNCs@D-GSH treated cells, including ROS generation, mitochondrial membrane depolarization, cell cycle arrest and apoptosis. Global gene expression and pathway analysis displayed that both AuNCs@L-GSH and AuNCs@D-GSH caused the up-regulation of genes involved in cellular rescue and stress response, while AuNCs@D-GSH individually induced up-regulation of transcripts involved in some metabolic- and biosynthetic-related response. MGC-803 cells were more sensitive to the oxidative stress damage induced by chiral Au NCs than GES-1 cells, which was associated with GSTP1 hypermethylation. In conclusion, chiral gold nanoclusters exhibit this chirality-associated regulation of cytotoxicity, different gene expression profiling and epigenetic changes should be responsible for observed phenomena. Our study highlights the importance of the interplays between chiral materials and biological system at sub-nano level.
Keywords: gold nanocluster, chirality, cytotoxicity, ROS, methylation, epigenetic analysis.
Introduction
Chirality is one of inspiring and amazing phenomena in nature [1]. For example, the central components in life such as proteins and nucleic acids are chiral. All other amino acids excluding glycine in proteins are the L-enantiomers, while nucleic acids consisting of chains of deoxyribonucleosides (for DNA) or ribonucleosides (for RNA), are based on D-deoxyribose or D-ribose sugar ring, respectively [2, 3]. Up to date, chirality has inspired great advances in physics, chemistry, and life science, also has been found in a variety of gold nanoparticles (Au NPs) and gold nanoclusters (Au NCs) [3-5]. The field of fluorescent Au NCs has spurred much interest in recent years. The sub-nano sized Au NCs fill the "missing gap" between atomic and nanoparticle structures and exhibit molecular-like properties including discrete electronic states and size-dependent fluorescence, which are different from their larger counterparts-plasmonic nanocrystals [6,7]. Especially, chiral gold nanoclusters, as an emerging multifunctional nanomaterial, own great potential applications in areas such as sensing, catalysis, and biomedicine [3, 8, 9].
Chiral optically activity of Au NCs was firstly observed by Schaaff and Whetten in 1998 [10]. A pair of Au NC enantiomers was also prepared by using optically active thiols such as D-and L-penicillamine [11]. Among the thiolate protected Au NCs, chiral L-glutathione (i.e. L-GSH; N-γ-glutamyl-cysteinyl-glycine), a naturally occurring and readily available tripeptide, which intensively exists in living cells to maintain the cellular potential in a reducing state and to protect biological molecules against oxidative damage, was mainly used as the thiolate ligand for the synthesis of Au NCs [3,12]. Jin has explicitly revealed that -SG ligands and surface of gold atoms play a critical role in effecting the circular dichroism responses in metal-based electronic transitions [5,7]. Recently, Bürgi' group has reported the racemization of a chiral cluster, which indicates an intramolecular, concerted rearrangement process and the flexibility of the gold-thiolate interface [13]. The interfacial bonding structures seriously affect the properties of Au NCs [14]. It is evident that the ligand shell can tune the (bio) chemical properties and exert a tremendous influence on the applications of thiolate-protected gold nanoclusters. Therefore, there is a critical need for a systematic evaluation and understanding of chiral nanoclusters-dependent response in biological systems. Moreover, a better understanding of the interactions between chiral Au NCs and cells is helpful to clarify the mechanism of bioactivity of the Au NCs, which may lay foundation for the safe use of chiral nanomaterials. By far, several reports have shown that Au NCs are good biocompatible, can be excreted from kidney, and own great potential in applications such as in vivo fluorescent imaging- and/or X-ray CT imaging-guided chemotherapy and radiotherapy, which highlights the distinctive features of Au NCs of efficient renal clearance and enhanced passively tumor targeting capability [15-18]. However, currently, nanotoxicity of chiral Au NCs has not been clarified well, no report is closely associated with the influence of chirality of chiral Au NCs on human cell growth and proliferation, especially, no studies have focused on the biological process/molecular pathways on a gene expression based approach.
Herein, we prepared chiral Au NCs capped with enantiomers of L-GSH or D-GSH (N-γ-D-glutamyl-D-cysteinyl-glycine), and investigated their effects on human gastric cancer cell line MGC-803 and human gastric mucous epithelial cell line GES-1. Our study showed that both AuNCs@L-GSH and AuNCs@D-GSH can induce dose-dependent cytotoxicity for both MGC-803 and GES-1 cells, and cell physiology-based toxicity study revealed the integrated cytotoxic effects including ROS generation, mitochondrial depolarization, DNA damage, cell cycle arrest, and apoptosis mediated death. But D-GSH-capped Au NCs are obviously more toxic than L-GSH-capped ones for both MGC-803 and GES-1 cells; this chirality-associated regulation of cytotoxicity highlights the importance of the interplays between chiral materials and biological system at sub-nano level. DNA microarrays were used to investigate and compare the global gene expressions of MGC-803 cells treated with AuNCs@L-GSH and AuNCs@D-GSH. Both L-and D-GSH-capped Au NCs caused the up-regulation of a number of genes involved in cellular rescue and stress response, while AuNCs@D-GSH individually induced up-regulation of transcripts involved in some metabolic- and biosynthetic-related response. By virtue of the analysis of global gene expression in cells allowed us to obtain comprehensive knowledge of the cytotoxic effects of AuNCs@L-GSH and AuNCs@D-GSH. Another surprising finding was that whether co-incubating with AuNCs@L-GSH or AuNCs@D-GSH, the viability of MGC-803 cells was distinctly lower than the GES-1 cells. Taken together, the research on the interplay between chiral Au NCs and live cells will be helpful to explore the application prospects of chiral Au NCs in clinical theranostics.
Materials and methods
Materials
Gold (III) chloride trihydrate (HAuCl4•3H2O, 99%) was obtained from Sinopharm Chemical Reagent Co., Ltd, China. Dimethyl sulfoxide (DMSO) and glutathione (L-GSH) were obtained from Amresco (Solon, OH, USA). D-GSH (98%) was synthesized by GL Biochem (Shanghai, China). Reactive Oxygen Species Assay Kit, GSH and GSSG Assay Kit, BCA (bicinchoninic acid) protein assay Kit and Mitochondrial membrane potential assay kit with JC-1were obtained from the Beyotime Institute of Biotechnology (Jiangsu, China). 5-Aza-2'-deoxycytidine (5-aza-dC; 98%) and Tetrabutylammonium borohydride (TBAB; 95%) were purchased from Aladdin Reagent Co. Ltd. (Shanghai, China). Trizol, 3-[4,5-dimethylthiazol-2yl]-2, 5-diphenyltetrazolium bromide (MTT) and 2',7'-dichlorofluorescein diacetate (DCFH-DA) were purchased from Invitrogen Corporation (Carlsbad, CA, USA). Annexin V-FITC/PI Apoptosis Detection Kit was purchased from Yeasen Corporation (Shanghai, China). Direct-zol™ RNA MiniPrep and EZ DNA Methylation-Gold kit were purchased from Zymo Research (Orange, CA). Random primer and M-MLV reverse transcriptase were purchased from Promega (Madison, WI, USA). Anti-GSTP1 antibody was purchased from Bioss (Beijing, China); anti-β-actin antibody was purchased from AbMart (Shanghai, China). BM Chemiluminescence Western Blotting kit was purchased from Roche (Roche Molecular Biochemicals, Indianapolis, IN). MGC-803, GES-1 and MCF-7 cell lines were available in the Cell Bank of Type Culture Collection of Chinese Academy of Sciences. Cell culture products and reagent, unless mentioned otherwise, were purchased from GIBCO. All the above chemicals were used without any further purification. Ultrapure water (Millipore Milli-Q grade) with a resistivity of 18.2 MΩ cm was used in all the preparations.
Synthesis of fluorescent GSH-capped Au NCs
The synthesis of red-emitting of L-GSH and D-GSH-capped Au NCs was done according to our previous procedure [6]. In a typical synthesis, freshly prepared aqueous solutions of HAuCl4 (10 mM, 10 ml) and GSH (L-GSH or D-GSH; 150 mM, 2ml) were mixed and stirred for 20 min at room temperature. The reaction mixture was then cooled down to 0 °C (ice-bath), and subsequently, tetrabutylammonium borohydride (5 equiv/mol of Au, 3 ml) was added rapidly and then stirred quickly for 4 h. A side-product of the insoluble substance was identified to be Au(I)-SG complexes [6]. The supernatant was further purified by adding three times amount of ethanol into the aqueous solution and centrifuge at 10,000 rpm for 15 min. Under such condition, the Au NCs were precipitated out of the solution while the free GSH and gold ions remained in the solution. The precipitates were then re-suspended in ultrapure water and stored at 4 °C for further experiments.
Characterization of Au NCs
The sizes and morphologies of the Au NCs were characterized by High-resolution TEM (HRTEM) on JEM-2100F (JEOL, Japan) with an acceleration voltage of 200 kV. UV-vis spectra were measured with a Varian Cary 50 spectrophotometer (Varian Inc., Palo Alto, CA, USA) equipped with a 10-mm quartz cell, where the light path length was 1 cm. Photoluminescence (PL) and photoluminescence excitation (PLE) spectra of Au NCs were recorded on a Hitachi FL-4600 spectrofluorometer. Circular dichroism (CD) measurements of Au NCs were performed on a Jasco J-815 CD spectrometer (Jasco International, Tokyo, Japan) in quartz cuvettes with a path length of 10 mm at ambient temperature. Data were collected every 0.2 nm with a bandwidth of 1 nm, at 50 nm min-1 and averaging over three scans. Size distribution and zeta potential of Au NCs were determined by dynamic light scattering using a NICOMP 380 ZLS Zeta potential/Particle sizer (PSS Nicomp, Santa Barbara, CA, USA).
Cell culture and cell viability assay
The human gastric cancer cell line MGC-803, human gastric epithelial cell line GES-1, and human breast adenocarcinoma cell line MCF-7 were maintained at 37 °C (5% CO2) in Dulbecco's Modified Eagle's Medium (DMEM, HyClone) supplemented with 10% (vol/vol) fetal bovine serum (Gibco), 100 U/mL penicillin and 1 mg/mL streptomycin. Cell viability was determined by the 3-[4,5-dimethylthiazol-2yl]-2,5-diphenyltetrazolium bromide (MTT) assay. Briefly, cells were seeded at a density of 5×10³ cells/well in a 96-well plate (Corning, Costar, NY) with 10% fetal bovine serum, and cultured overnight. The cells were incubated with various concentrations of Au NCs for 24 h. After exposure, the supernatant was removed and cells were washed once with phosphate-buffered saline (PBS) (pH 7.4).Then,150 μl DMEM and 15 μl MTT (0.5 mg/ml ) were added to each well and incubated for 4 h at 37°C. Finally, 150 μl DMSO was added to dissolve the formazan crystals. The absorbance was measured at 570 nm using a standard micro plate reader (Scientific Multiskan MK3, thermo, USA). The following formula was used: cell viability= (OD of the experimental sample/OD of the control group) × 100% and the cell viability of control group were denoted as 100%.
Detection of Reactive Oxygen Species (ROS)
Cellular generation of ROS in MGC-803 cells after exposure to Au NCs was measured using DCFH-DA. DCFH-DA is a nonfluorescent cell-permeable indicator for ROS that becomes fluorescent upon oxidation by ROS after cleavage of the protecting acetate groups by intracellular esterases. We used 0.3% H2O2 as a positive control. Upon treatment with 0.3% H2O2 stronger fluorescence indicated the cells suffered strong oxidative stress. After incubation with the Au NCs, the cell culture medium was replaced with serum free medium in the presence of 20 μM of DCFH-DA. After 20 min incubation at 37 °C, the dye was washed twice with serum free medium, and intracellular fluorescence was detected using fluorescence microscope. The fluorescence pictures were captured with Nikon ECLIPSE TS100 microscope, equipped with a 50 W mercury lamp and Nikon DS-Fil camera, NIS-Elements software was used for image acquisition. The fluorescence filter cube was the Nikon B-2A set (Excitation Filter Wavelengths: 450-490 nm bandpass, 470 CWL), Dichromatic Mirror Cut-on Wavelength: 500 nm (longpass, LP), Barrier Filter Wavelengths: 515 nanometer cut-on (longpass, LP). The objective CFI Plan Apochromat 20 × (NA 0.75, air correction) was used.
GSH and GSSG Assay
MGC-803 and GES-1 cells were seeded in 6-well plates at 1×10⁶ cells per well. After 24 h of incubation with different concentration of Au NCs, cells were washed twice with PBS. Cells were digested and collected in a centrifuge tube and immediately add 3 volumes of ice-cold 5% metaphosphoric acid, then frozen and thawed twice using liquid nitrogen and 37 °C water. The samples were centrifuged at 12000 rpm for 10 minutes at 4 °C and the supernatant was used for GSH and GSSG assays. Total glutathione (GSH+GSSG), reduced glutathione (GSH) and oxidized glutathione (GSSG) were determined with the GSH and GSSG Assay Kit (Beyotime Biotech, Jiangsu, China) according to the protocol. The amount of reduced GSH was obtained by subtracting the amount of GSSG from that of total GSH.
Mitochondrial membrane potential (ΔΨm) detection
Fluorescence microscope was used for the analysis of MMP. Briefly, after Au NCs treatment, the cells were incubated with 5 mg/L JC-1 (Beyotime Biotech) at 37 °C for 20 min and rinsed twice with ice-cold PBS. Mitochondrial membrane potentials were monitored by determining the relative amounts or dual emissions from both mitochondrial JC-1 monomers and aggregates using a Nikon ECLIPSE TS100 microscope. The Fluorescence filter cube was Nikon B-2A set as mentioned above. NIS-Elements software was used for image acquisition. The objective CFI Plan Apochromat 20× (NA 0.75, air correction) was used.
DNA damage assay
Detection of cellular γH2AX was carried out by using the H2AX phosphorylation assay kit for flow cytometry (Millipore, USA). MGC-803 cells were treated with 100 μg/ml AuNCs@L-GSH and AuNCs@D-GSH for 24, respectively. GES-1 cells were treated under the same condition as MGC-803 cells. Cells only without any treatment were denoted as control. The assay was carried out according to the manufacturer's protocol with one major modification: the FITC-labeled antibody was incubated overnight at 4 °C instead of 20 min on ice. The position along the x-axis correlates to the amount of γH2AX and any events under the right gate signify a positive signal-phosphorylated H2AX (γH2AX). The number in the upper right corner of each panel indicated the percentage of cells scoring positive for staining with the γH2AX antibody.
Cell cycle analysis
Cell cycle analysis was carried out by PI staining followed by flow cytometric measurement. In brief, cells were washed twice by PBS, and trypsinized, harvested and centrifuged after Au NCs treatment for 24 h. Cell pellet was washed twice with cold PBS and fixed overnight in 70% ethanol at -20 °C. Before flow cytometry analysis, cells were washed with PBS and stained with 50 µg/ml PI containing RNase A (100 µg/ml) and incubated at 37 °C for 30 min, followed by analyzed with a FACSCalibur (BD Biosciences, Mountain View, CA). Cell debris and clumps were gated out, and G1, S, and G2/M populations were quantified using FlowJo 7.6 software.
Apoptosis assay by Annexin V-FITC and propidium iodide (PI) double staining
The apoptotic and necrotic cell distribution were analyzed by Annexin V/PI apoptosis detection Kit (Yeasen, Shanghai). MGC-803 and GES-1 cells were treated with 100 μg/ml AuNCs@L-GSH and AuNCs@D-GSH for 24 h respectively; cells were harvested, washed once with PBS and resuspended in 200 μl binding buffer, 5 μl of Annexin V-FITC and 10 μl of PI was added and incubated in the dark at room temperature for 15 min. Then, 400 μl of binding buffer was added to each sample, and the cells were immediately analyzed by flow cytometry. The data analysis was performed with FlowJo 7.6 software. Positioning of quadrants on Annexin V/PI plots was performed to distinguish intact (Annexin V-/PI-), early apoptotic (Annexin V+ /PI-), late apoptotic (Annexin V+/PI+) and necrotic (Annexin V-/PI+) cells.
Microarray and global gene expression analysis
Experiment
MGC-803 cells cultured previously in DMEM for 24 h were further cultured for 24 h in media containing AuNCs@L-GSH (100 μg/ml) and AuNCs@D-GSH (100 μg/ml), respectively. The cells cultured in the media only were denoted as control group. Then total RNA was extracted from treated and control cells and the RNAs integrity was assessed using Agilent Bioanalyzer 2100 (Agilent Technologies). The sample labeling, microarray hybridization and washing were performed based on the manufacturer's standard protocols. Briefly, total RNAs were transcribed to double strand cDNAs and then synthesized cRNAs. Next, 2nd cycle cDNAs were synthesized from cRNAs. Followed fragmentation and biotin labeling, the 2nd cycle cDNAs were hybridized onto the Affymetrix Human HTA 2.0 microarray. After washing and staining, the arrays were scanned by the Affymetrix Scanner 3000 (Affymetrix).
Microarray data analysis
Affymetrix GeneChip Command Console (version 4.0, Affymetrix) software was used to extract raw data. The data were subjected to normalization, background correction and summarization using Expression Console (version1.3.1, Affymetrix) software with the standard Robust Multi-array Average (RMA) algorithm. Genespring software (version 12.5; Agilent Technologies) was employed to finish the basic gene expression analysis. Differentially expressed genes were then identified through fold change. The threshold set for up- and down-regulated genes was a fold change >= 1.5. Afterwards, GO analysis and KEGG analysis (analyzed using the online tool FunNet) were applied to determine the roles of these differentially expressed mRNAs played in these GO terms or pathways [46].
RT-PCR
Total RNA from MGC-803, GES-1, and MCF-7 cells was isolated using Trizol (Invitrogen) and Direct-zol™ RNA MiniPrep (Zymo Research) according to manufacturer's instructions. The RNA was quantified using a nanodrop ND-1000 (Thermo Fischer Scientific). First-strand cDNA was obtained by using 1µg of total RNA and random primers and M-MLV reverse transcriptase (Promega). β-actin was chosen as the endogenous control in the assay. The cDNA templates were stored at -20 °C. The following PCR primers were used: β-actin primers, forward: 5'-GTGGGGCGCCCCAGGCACCA-3', reverse: 5'-CTCCTTAATGTCACGCACGATTTC-3'; GSTP1 primers, forward: 5'-GTAGTTTGCCCAAGGTCAAG-3', reverse: 5'-AGCCACCTGAGGGGTAAG-3'. The PCR protocol was: 3 min at 95 °C; 1min at 94 °C, 1min at 60 °C, 1 min at 72 °C for 35 cycles; 72 °C, 10 min. PCR products were separated on the 20 g/L agarose gel stained with ethidium bromide and viewed under ultraviolet light.
Methylation-specific PCR (MSP)
Genomic DNA was isolated from the MGC-803, GES-1 and MCF-7 cells and the methylation status of GSTP1 was examined using methylation-specific PCR (MSP). Five hundred nanograms of each DNA sample was converted with EZ DNA Methylation-Gold kit (Zymo Research) under the following conditions: 98 °C for 10 min, 5 cycles of 64 °C for 30 min followed by 4 °C for 2 h. Converted DNA was purified according to manufacturer's instructions and 1/10th was used as template per amplification. Methylation-specific PCR was carried out as follows: 1 cycle at 95 °C for 3 min; 35 cycles at 94 °C for 30s, then 30s at 58 °C, 30s at 72 °C, with final extension for 10min at 72 °C. Primer sequences for the methylated GSTP1 amplification were 5'-TTCGGGGTGTAGCGGTCGTC-3' (forward) and 5'-GCCCCAATACTAAATCACGACG-3' (reverse), and primer sequences for the unmethylated GSTP1 amplification were 5'-GATGTTTGGGGTGTAGTGGTTGTT-3' (forward) and 5'-CCACCCCAATACTAAATCACAACA-3' (reverse). PCR products were analyzed on 12% polyacrylamide gel electrophoresis, stained with ethidium bromide, and visualized under UV illumination.
Western blotting
In brief, the total cell lysates were prepared in high KCl lysis buffer (10 mM Tris-HCl, pH 8.0, 140 mM NaCl, 300 mM KCl, 1 mM EDTA, 0.5% Triton X-100 and 0.5% sodium deoxycholate) with complete protease inhibitor cocktail (Roche).The protein concentration was determined using BCA (bicinchoninic acid) protein assay kit (Beyotime Biotech, Jiangsu, China) and store at -20 °C. Thirty micrograms of protein were separated by sodium dodecyl sulfate polyacrylamide gel electrophoresis (SDS-PAGE) and transferred to polyvinylidene fluoride membranes (Roche). The membranes were treated with 1% blocking solution in TBS for 2 h, the membranes were incubated with primary antibodies anti-GSTP1 (1:200; Bioss, Beijing, China), anti-α-tubulin (1:1000; AbMart, Shanghai, China), at 4 °C overnight. Then the membranes were washed and incubated with POD-labeled secondary antibodies (Roche). The immunolabeled proteins were detected by BM Chemiluminescence Western Blotting kit (Roche).
Statistical analysis
All experiments were performed in triplicate unless otherwise indicated. Data are expressed as mean values ± standard deviation. Statistical differences were calculated by a two-tailed, unpaired Student's t-test at a significance level of p < 0.05.
Results and discussion
Chiral Au NCs characterization
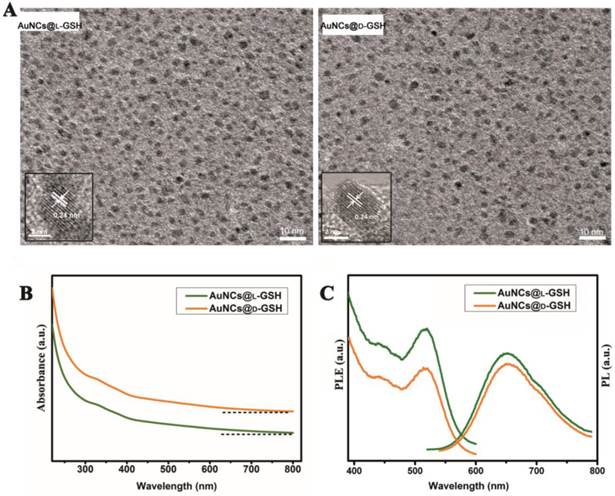
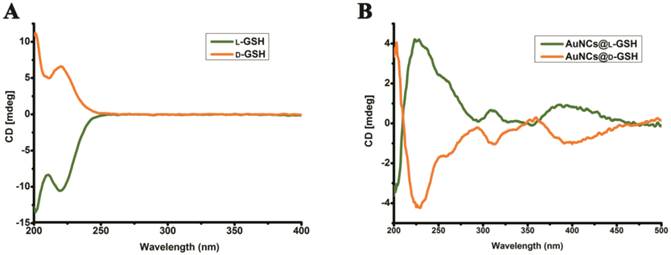
The synthesis of chiral Au NCs was modified from the method we have reported [6]. High-resolution transmission electron microscopy (HRTEM) images indicated that all Au NCs exhibit the same outstanding size uniformity and spherical shape (Fig. 1A; for size distribution, see Supplementary Material: Fig. S1). The insets in Fig. 1a suggested that the lattice fringes of Au NCs were consistent with the metallic gold lattice spacing of 0.24 nm. No surface plasmon absorption peaks were observed for AuNCs@L-GSH or AuNCs@D-GSH (Fig. 1B), which is a unique feature of ultrasmall Au NCs. Because of quantum confinement effects, Au NCs are too small to support surface plasmon resonance. Photoluminescence (PL) and photoluminescence excitation (PLE) spectra of L- and D-GSH-capped Au NCs were essentially the same (Fig. 1C). The physicochemical properties of the AuNCs@L-GSH and AuNCs@D-GSH were summarized in Supplementary Material: Table S1; they had in fact an inner consistency. Free L- and D-GSH molecules showed mirror-image circular dichroism (CD) spectra in the region of 200 to 250 nm (Fig. 2A). Compared with chiral GSH molecules, L- and D-GSH-capped Au NCs were optically active and possessed almost identical mirror images of one another in the range of 200 to 500 nm (Fig. 2B), and insoluble Au(I)SG complex were in the region of 200 to 700 nm (Supplementary Material: Fig. S2). Interestingly, the signal of L- and D-GSH-capped Au NCs was reversed compared with that of the ligand. Up to date, no satisfactory mechanism has been given to explain such reversal CD signals after chiral molecules capped onto the gold surface [3,19]. But, it is clear that the chiral optically activities of ligand-capped nanoclusters are both from the metal atom arrangement and the ligand shell around it [3,8].
Characterization of L- and D-GSH-capped Au NCs. (A) HRTEM images of AuNCs@L-GSH and AuNCs@D-GSH. The spherical Au NCs were marked with a distance of the lattice spacing (insets). (B) UV-vis spectra of AuNCs@L-GSH and AuNCs@D-GSH. (C) PL (λex=520 nm) and PLE (λem=650 nm) spectra of L- and D-GSH-capped Au NCs.
Circular dichroism spectra. (A) CD spectra of L- and D-GSH. (B) CD spectra of AuNCs@L-GSH and AuNCs@D-GSH.
Cytotoxicity and oxidative stress
Cytotoxicity of L- and D-GSH-capped Au NCs was determined using the MTT colorimetric assay. AuNCs@L-GSH displayed little toxicity at dose up to 250 µg/ml against MGC-803 and GES-1 cells, with IC50 (half-maximum inhibitory concentration) values of 1068.656 ± 59.241 and 1183.871 ± 71.254 µg/ml, respectively (Fig. 3A and B). Conversely, AuNCs@D-GSH induced a sharp decrease in MGC-803 cell viability when the doses were up to 100 µg/ml. The IC50 values of MGC-803 and GES-1 cells induced by AuNCs@D-GSH were 87.336 ± 3.365 and 647.169 ± 39.124 µg/ml, respectively. In brief, our results clearly demonstrated that D-GSH-capped Au NCs were obviously more toxic than L-GSH-capped ones for both MGC-803 and GES-1 cells. We also investigated the bio-compatibility of free L- and D-GSH compounds. As shown in Supplementary Material: Fig. S3, none cytotoxicity was observed with neither L- nor D-GSH when the dose was up to 1 mg/ml. Based on rigorous consideration of the stability of L- and D-GSH-capped AuNCs, we tested the UV-vis absorption spectra of Au NCs in 0.01M PBS (pH, 7.4) and DMEM containing 10% FBS at 37 °C for 24 h (Supplementary Material: Fig. S4). The unchanged unique structure of L- and D-GSH-capped AuNCs was suggested by their almost overlapping optical absorption spectra.
Cytotoxicity and oxidative stress. Concentration- and chirality-dependent cytotoxicity of Au NCs for (A) MGC-803 cells and (B) GES-1cells. (C) ROS level of MGC-803 cells after co-incubation with Au NCs for 12 h was examined by DCFH-DA under fluorescence microscope. L-500, L-1000, D-500, D-1000 were denoted as MGC-803 cells treated with 500 and 1000 µg/ml AuNCs@L-GSH, 500 and 1000 µg/ml AuNCs@D-GSH respectively. Scale bars: 100 µm. **p<0.01, ***p<0.001, Student's t-test results at 95% confidence level were significantly different.
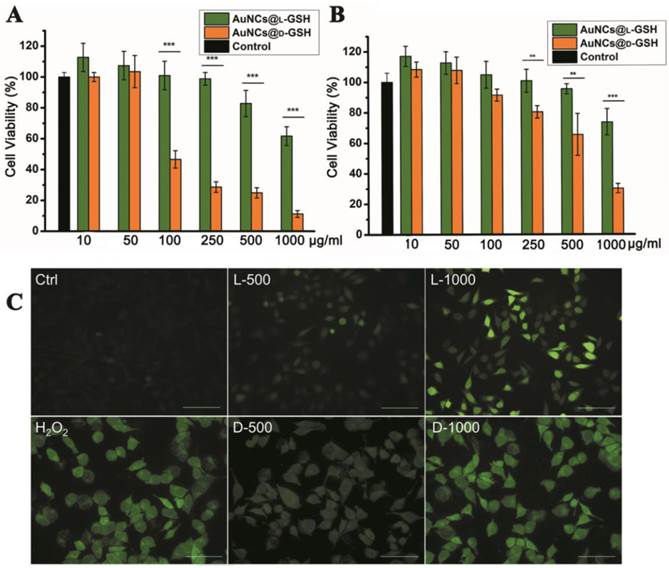
Regarding the mechanism of nanotoxicity, oxidative stress induction was a common paradigm for the cellular toxicity of nanoparticles. In order to establish the role of reactive oxygen species (ROS) was a decisive factor in chiral GSH-capped Au NCs cytotoxicity, 2',7'-dichlorofluorescein diacetate (DCFH-DA) staining method was performed. DCFH-DA is a nonfluorescent cell-permeable indicator for ROS and becomes fluorescent upon oxidation by ROS after cleavage of the protecting acetate groups by intracellular esterases [20]. MGC-803 cells treated with 0.3% H2O2 for 0.5 h were used as positive control; media-only-treated cells were served as the negative control. As shown in Fig. 3C, a clearly concentration-and chirality-dependent induction of ROS was observed while the MGC-803 cells incubated with AuNCs@D-GSH produced more ROS than the cells incubated with AuNCs@L-GSH. GSH is a major component of the antioxidant defense system of mammalian cells, and it reduces ROS with the oxidation of the -SH group to convert to the dimer form of GSSG with S-S bond [21]. Changes of the intracellular thiol-disulfide (GSH/GSSG) balance can be used as an indicator of the redox status of the cell [12,21]. The intracellular GSH/GSSG levels were determined by the GSH and GSSG assay. Both AuNCs@L-GSH and AuNCs@D-GSH decreased the GSH/GSSG ratio of MGC-803 and GES-1 cells (Supplementary Material: Fig. S5). Next, we co-incubated AuNCs@D-GSH with L-GSH or D-GSH for the entire duration of the experiment. This treatment restored cell survival rate considerably in MGC-803 cells, while it was not statistically significant in GES-1 cells as shown in Supplementary Material: Fig. S6. Nevertheless, the D-GSH seems had the same ability to increase the cell viability as the biological active form L-GSH; this may be explained that thiol-containing compounds could neutralize the toxicity of ROS [22].
Mitochondrial membrane potential
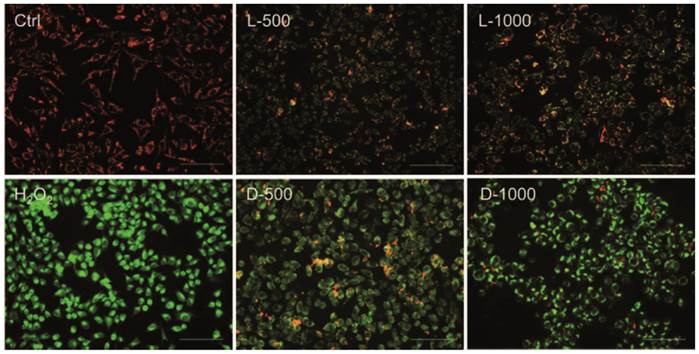
In order to investigate the effects of chiral Au NCs on mitochondria, as the mitochondrion is ROS' main action site, the membrane-permeant JC-1 dye staining method is used to monitor mitochondrial status. Oxidative stress can decrease the mitochondrial membrane potential (MMP), ultimately leading to open the mitochondrial permeability transition pore, which results in a sudden increase in the permeability of the inner mitochondrial membrane [23]. In live cells, JC-1 exists either as an orange/red-fluorescent aggregates at hyperpolarized membrane potentials or as a green-fluorescent monomer at depolarized membrane potentials [24]. Therefore mitochondrial depolarization was expressed by an increase in the intensity ratio of green/red fluorescence. As illustrated in Fig. 4, untreated MGC-803 cells with polarized mitochondria appeared as red punctate staining while the MGC-803 cells treated with different concentrations of AuNCs@D-GSH and AuNCs@L-GSH caused progressive loss of red fluorescence and cytoplasmic diffusion of green fluorescence. The result of mitochondria potential staining of the GES-1cells was shown in Supplementary Material: Fig. S7. As demonstrated in Fig. 4 and Fig. S7, D-GSH-capped Au NCs could effectively increase the intensity ratio of green/red fluorescence than L-GSH-capped ones for a given concentration, which was fully compatiable with the results of ROS induction. All these results suggested that ROS generation induced by oxidative stress might be an important cytotoxicity mechanism for chiral Au NCs. What's more, the depolarization of mitochondrial membrane potential has been shown to be an early event in the apoptotic process and has even been suggested to be central to the apoptotic pathway [23,25]. To evaluate secondary effects on the context of cell physiology by the elevated ROS level and the depolarized of mitochondrial membrane potential, the analysis of DNA damage, cell cycle, and apoptosis was done.
Fluorescent potential-dependent staining of mitochondria in MGC-803 cells by JC-1 following exposure to Au NCs for 12 h. L-500, L-1000, D-500, D-1000 were denoted as MGC-803 cells treated with 500 and 1000 µg/ml AuNCs@L-GSH, 500 and 1000 µg/ml AuNCs@D-GSH, respectively. The cells were illuminated at 450-490 nm and the emission was collected with a 515 nm longpass optical filter. Scale bars: 100 µm.
DNA damage assay
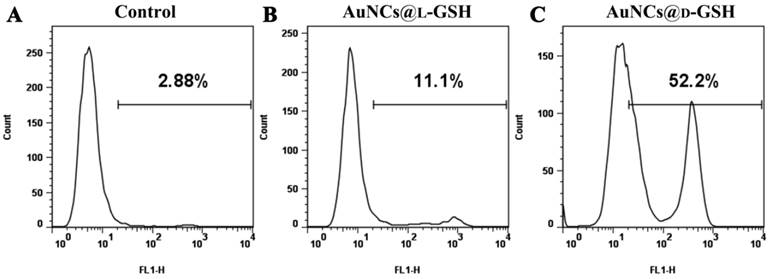
The genotoxic potentiality of Au NCs was evaluated by measuring the activation of phosphorylated H2AX on Ser139 (γH2AX), a well-recognized protein biomarker for double-strand DNA breakage [26]. As shown in Fig. 5, both AuNCs@L-GSH and AuNCs@D-GSH induced a shift in the cellular status of γH2AX with activation peaks partitioned to the right while the percentage of cells scoring positive for H2AX phosphorylation induced by AuNCs@D-GSH was higher than that caused by AuNCs@L-GSH, which correlated well with our previous results of cytotoxicity and ROS generation. ROS-mediated genotoxicity has been previously observed for metal oxide nanoparticles [27]. This is the first investigation that provided quantitative measurements of distinguishing DNA damage in chiral Au NCs treated cells. The activation γH2AX was also found in GES-1 cells when treated with AuNCs@L-GSH and AuNCs@D-GSH (Supplementary Material: Fig. S8). Since the DNA damage is always with the downstream events that lead to recruitment of DNA repair machinery and engagement of cell cycle checkpoints, so the cell cycle distribution was examined [28].
Flow cytometry analysis of the phosphorylation of H2AX. (A) MGC-803cells without any treatment. (B-C) MGC-803 cells treated with 100 μg/ml AuNCs@L-GSH and AuNCs@L-GSH for 24, respectively. The phosphorylation of H2AX is assessed by the degree of shift of the cell population to the right. The number in the upper right corner of each panel indicates the percentage of cells scoring positive for staining with γH2AX antibody.
Cell cycle and apoptosis assay
Recently, it has been reported that ROS influence cell cycle progression in a context-dependent manner via phosphorylation and ubiquitination of CDKs (cyclin dependent kinases) and other cell cycle regulatory molecules[29]. For example, ortho-quinonoid compound LGH00031 inhibited the activity of Cdc25b, thereby inhibiting the G2/M phase transition and decreasing tumor cell proliferation depending on the presence of ROS [30]. Moreover, damaged DNA elicited the activation of cell cycle G2 checkpoints function to repair DNA damage before entering mitosis. As already explained in the previous DNA damage study, Au NCs treated MGC-803 cells indicated the breakage of double-strand DNA where the early effect will be evidenced in cell cycle progression. Then the toxicity studies were further extended to cell cycle analysis. Fig. 6A and S10A showed the results of cytometric DNA content distribution of MGC-803 and GES-1 cells, respectively. For MGC-803 cells treated with AuNCs@L-GSH and AuNCs@D-GSH, significant accumulation (about 21.0% and 29.3%, respectively) in the G2/M phase were observed compared with the untreated control cells (about 19%). However, the GES-1 cells treated with AuNCs@L-GSH or AuNCs@D-GSH did not show massive increase in G2/M accumulation (Supplementary Material: Fig. S9A). Therefore, chiral Au NCs induced G2/M phase arrest of MCC-803 cells, and retarded cell proliferation. The difference of cell cycle arrest in G2/M phase between AuNCs@L-GSH and AuNCs@D-GSH was consistent with the results of cytotoxicity, ROS induction and DNA damage. Our study further confirmed the recognition of ROS as essential players in cells cycle progression. When the intracellular redox homeostasis was interrupted, the functions and activities of several key cell cycle components such as cyclins (i.e. cyclin D1 and E), cyclin dependent kinases (i.e. CDK2 and 4) and cell cycle check point proteins (i.e. Chk1, Chk2) were influenced, which in turn direct the cell to be arrested or ultimately lead to apoptosis [29].
Flow cytometry analysis of (A) cell cycle phase distribution and (B) apoptosis/necrosis in MGC-803 cells after exposure to (a-2, b-2) 100 μg/ml AuNCs@L-GSH and (a-3, b-3) 100 μg/ml AuNCs@D-GSH for 24 h, respectively. (a-1, b-1) Cells without any treatment.
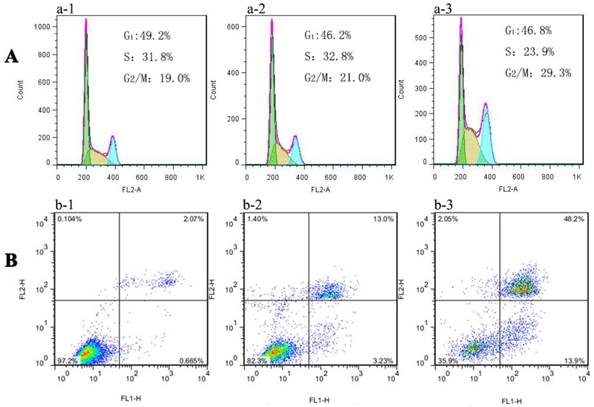
Further, the death mechanisms of MGC-803 and GES-1 cells treated with AuNCs@L-GSH and AuNCs@D-GSH were evaluated and compared by annexin V/PI double staining method. The percentage of cells in early apoptotic, late apoptotic and necrotic stages in MGC-803 cells exposed to 100 μg/ml of AuNCs@L-GSH and AuNCs@D-GSH for 24 h was quantified by flow cytometry. The data from the annexin V/PI staining experiment indicated that a majority of cells was undergoing apoptosis (13.9% for early apoptosis, 48.2% for late apoptosis) rather than necrosis when exposed to AuNCs@D-GSH, while 13.0% and 3.23% of cell death observed was due to early and late apoptosis when exposed to AuNCs@L-GSH (Fig. 6B). This was consistent with a higher concentration of intracellular ROS and lower cell viability of MGC-803 cells treated with AuNCs@D-GSH than those treated with AuNCs@L-GSH. Similar results was demonstrated in GES-1 cells after exposure to AuNCs@L-GSH and AuNCs@D-GSH, however, the ratio of cell apoptosis was comparatively lower than that in MGC-803 cells under the same condition (Fig. S9B). The apoptosis assay revealed that induction of apoptosis was associated with increased generation of ROS, reduced mitochondrial membrane potential and cell cycle arrest at G2/M phase. In conclusion, AuNCs@D-GSH caused severer cytotoxicity against MGC-803 cells in accordance with the results of above-mentioned MTT assay.
Global gene expression changes with microarray
Gene expression profiling
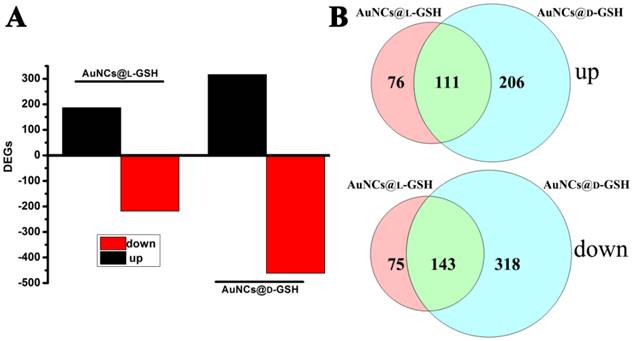
Understanding molecular mechanism underlying the cellular events of a toxicological outcome allows the prediction of molecular pathways in the response of the organism to a stressor [31]. Therefore, global gene expression analysis was employed to comprehend the underlying molecular mechanism of cytotoxicity when exposed to AuNCs@D-GSH/AuNCs@L-GSH. As shown in Fig. 7A, a total number of 778 genes, including the 317 up-regulated and the 461 down-regulated, were significantly affected by AuNCs@D-GSH and, correspondingly, a total of 405 genes, including the 187 up-regulated and the 218 down-regulated, by AuNCs@L-GSH. Comparatively, the number of genes affected by AuNCs@L-GSH was approximately ½ of those by AuNCs@D-GSH. The numbers of differentially expressed genes (DEGs) shared by the Au NCs treatment were represented in the vein diagrams (Fig. 7B). To distinguish the effects of AuNCs@L-GSH and AuNCs@D-GSH on the related biological process of MGC-803 cells, the differentially up- and down-regulated genes were functionally analyzed on the basis of gene ontology (GO).
(A) Numbers of genes differentially expressed in MGC-803 cells treated with AuNCs@L-GSH and AuNCs@D-GSH. (B) Venn diagrams with the combinations indicating numbers of shared genes between treatment of AuNCs@L-GSH and AuNCs@D-GSH.
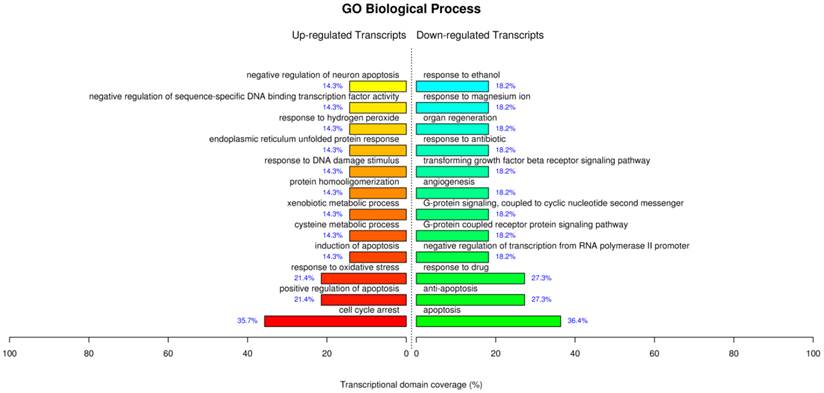
The GO analysis for the treatment of AuNCs@L-GSH by the term biological process showed similar processes which have been supported by our parallel experiments such as cell cycle arrest, positive regulation of apoptosis, response to oxidative stress, response to DNA damage stimulus etc (Fig. 8). For the term molecular function displayed sequence-specific DNA binding transcription factor activity, sequence-specific DNA binding, cystathionine beta and gama-lyase activity, L-cysteine desulfhydrase activity, aldo-keto reductase (NADP) activity etc. Of note, the up-regulated L-cysteine desulfhydrase, which catalyzes the decomposition of L-cysteine to pyruvate, ammonia, and H2S, could be specifically responsible for the cysteine degradation leading to the reduced intracellular L-cysteine concentrations and therefore perturb the intracellular redox-homeostatic buffering [32]. Cystathionine gamma-lyase is the rate-limiting enzyme for the synthesis of cysteine and availability of cysteine is a critical factor in glutathione synthesis [33]. Therefore, the up-regulated cystathionine gamma-lyase leads to the production of glutathione and maintaining the redox homeostasis. Aldo-keto reductase (NADP), which primarily reduces aldehydes and ketones to primary and secondary alcohols, plays a central role in the cellular response to osmotic, electrophilic, and oxidative stress [34]. Overall, the GO analysis for AuNCs@L-GSH treatment further corroborated our perceptions of the molecular mechanism of cytotoxicity. MGC-803 cells treated with AuNCs@D-GSH showed a very different gene expression compared with those treated with AuNCs@L-GSH (Supplementary Material: Fig. S10). AuNCs@D-GSH induced apoptosis-related GO terms up-regulated in like manner, and more significantly, AuNCs@D-GSH individually up-regulated GO terms related with metabolic and biosynthetic process, indicating a synergetic effect in the cytotoxicity of AuNCs@D-GSH. Moreover, Au NCs inhibited cell growth and shifted the balance between pro- and anti-apoptotic genes in favor of apoptosis.
GO terms of biological process significantly affected by AuNCs@L-GSH.
KEGG pathway analysis
The Kyoto Encyclopedia of Genes and Genomes (KEGG) pathway mapping is a general analysis method to study biological interpretation of high-level systemic functions based on large-scale datasets in genomics, transcriptomics, proteomics, and metabolomics [35,36]. As shown in Fig. 9A, AuNCs@L-GSH affected the largest number of pathways including mineral absorption, p53 signaling pathway, and selenocompound metabolism. AuNCs@D-GSH exposure caused the most statistically significant pathway changes in metabolic pathways and steroid biosynthesis, metabolism of xenobiotics by cytochrome P450 and PPAR signaling pathway were also the enriched pathways.
KEGG pathway analysis of gene expression data from MGC-803 cells exposed to (A) AuNCs@L-GSH and (B) AuNCs@D-GSH. Functional profiling depicts significantly overrepresented KEGG pathways on the basis of differentially expressed genes in AuNCs@L-GSH vs. control and AuNCs@D-GSH vs. control. Functional profiling was conducted via the FunNet tool by considering all differentially expresses genes at an FDR (false discovery rate) of 5%.
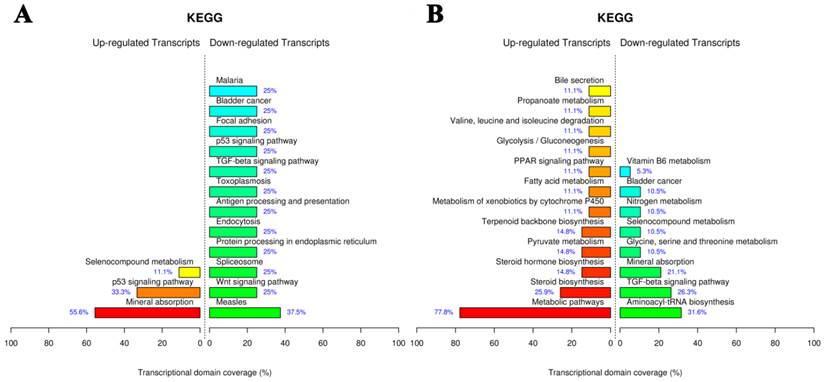
The difference in the specific genes with altered expression upon the exposure to the two different Au NCs suggested the different toxic mechanisms. We observed that AuNCs@L-GSH with a relative lower cytotoxicity tending to induce more chemical-specific toxicity response, while AuNCs@D-GSH, which was much more toxic than AuNCs@L-GSH, dominated more metabolic- and biosynthetic-related response (Fig. 9B). In summary, for the first time, our results revealed more detailed transcriptional information on the toxic mechanism of AuNCs@L-GSH and AuNCs@D-GSH. In general, global gene expression analysis in cancer cells in response to nanomaterials promised a revolutionary new ground for monitoring and identifying the biological process and pathways responsible for toxicity, revealing the toxic mechanism and obtaining toxicant-specific molecular fingerprints [37].
GSTP1 protects against Au NCs-induced cytotoxicity
All results above-mentioned showed that different chiral Au NCs demonstrated different toxicity, of which AuNCs@D-GSH exhibited stronger cytotoxicity against MGC-803 cells (Fig. 10A). The potential molecular mechanism was needed to be further clarified. We predicted that the inherent hereditary defects of MGC-803 cells may result in the differential cytotoxicity induced by chiral Au NCs. Therefore, we examined the epigenetic difference between MGC- 803 and GES-1 cells. Epigenetics is the study of reflecting functionally relevant modifications to the genome that do not change the nucleotide sequence, examples of such modifications are DNA methylation and histone modification, which is a bridge between genotype and phenotype [38,39]. DNA methylation often occurs on the cytosine residues in the sequence context 5'-CpG-3', it plays an important role in the control of gene expression in mammalian cells [40]. In different types of tumours, aberrant or accidental methylation of CpG islands in the promoter region often results in silencing of many cancer-related gene expressions [41]. For example, GSTP1, encoding glutathione S-transferase pi, has been reported to be the target of somatic CpG island hypermethylation in 90% of prostate cancers, which is recognized as a molecular hallmark of human prostate cancer [42]. The GSTP1 is an important multi-functional detoxifying enzyme within the glutathione S-transferase family enzymes that inactivates electrophilic carcinogens by conjugation with glutathione. Recent findings also confirmed the critical role of GSTP1 in the protection of cells from ROS because they can utilize a wide variety of products of oxidative stress as substrates [43,44].
Au NCs-induced cytotoxicity is cell-type-dependent. (A) Cell viability of MGC-803 and GES-1 cells after co-incubation with AuNCs@D-GSH for 24 h. (B) GSTP1 mRNA levels determined by RT-PCR and agarose gel electrophoresis. 1) MGC-803, 2) GES-1, 3) MCF-7, 4) size markers, 6-9) β-actin internal controls, respectively, from MGC-803, GES-1 and MCF-7 cells. (C) GSTP1 protein expression in MGC-803, GES-1 and MCF-7 cells, tubulin provided the loading control. (D) Methylation status of GSTP1 CpG island in different cell lines revealed by MSP. The presence of a PCR product in lanes M indicated that the GSTP1 gene is methylated, whereas the product in lanes U indicated that the promoter region is unmethylated. The water control does not show evidence of contamination. M, methylated; U, unmethylated. (E) The restoration of GSTP1 mRNA was determined by RT-PCR and agarose gel electrophoresis. 1, 2) and 3) were MGC-803 cells and the cells treated with 5 μM and 10 μM 5-aza-dC for 72 h, respectively. (F) The restoration of GSTP1 protein expression in MGC-803 cells was detected by western blotting after treatment with 5 and 10 μM 5-aza-dC for 72 h, respectively. (G) Effect of 5-aza-dC treatment on the cell viability of MGC-803 cells when co-incubation with AuNCs@D-GSH. **p<0.01, ***p<0.001, Student's t-test results at 95% confidence level were significantly different.
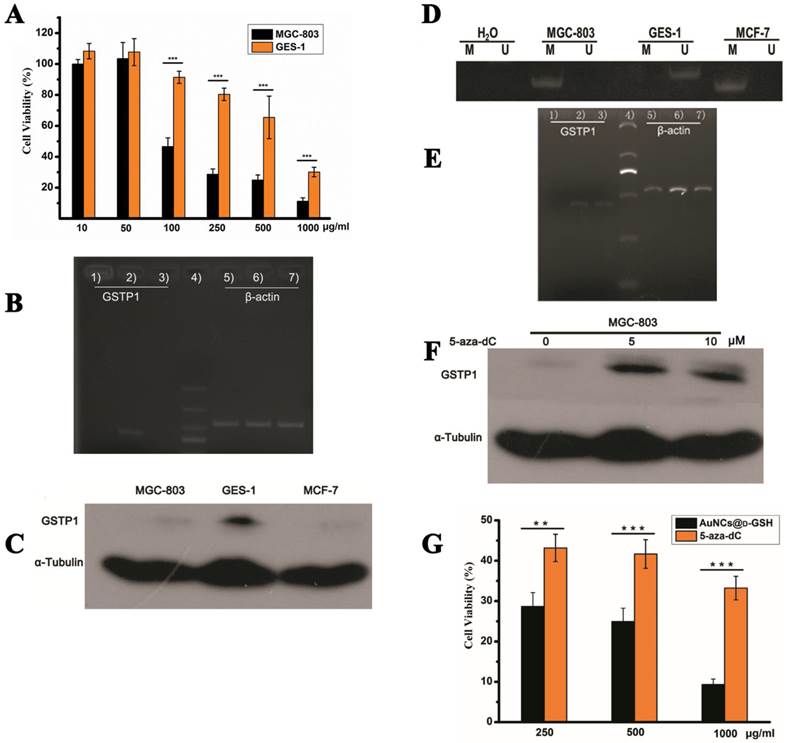
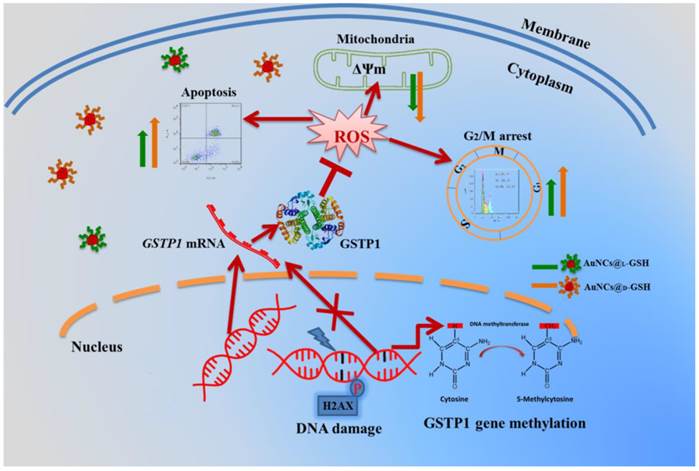
As shown in Fig. 10B and C, GSTP1 mRNA and protein were not detectable in MGC-803 and MCF-7 cells, while both were present in GES-1 cells. To determine whether the lack of GSTP1 expression in MGC-803 cells was associated with GSTP1 gene methylation, methylation-specific PCR (MSP) was used to explore the methylation status of the CpG island located at the 5' promoter site. The breast cancer MCF-7 cell line, failing to express GSTP1 mRNA or GSTP1 polypeptides due to the hypermethylation of CpG dinucleotides at the 5' transcriptional regulatory region, was chosen as the positive control. As shown in Fig. 10D, abnormal GSTP1 CpG island hypermethylation was detected in MGC-803 cells, but not in GES-1 cells. To determine whether the hypermethylation was associated with GSTP1 transcriptional silencing, MGC-803 cells were treated with 5 and 10 µM 5-aza-2'-deoxycytidine (5-aza-dC) for 72 h respectively. 5-aza-dC is a nucleoside-analogue inhibitor of DNA methyltransferases, which can reactivate epigenetically silenced genes and restore normal gene function [45]. Fig. 10E and F showed that GSTP1 expression was restored after 5-aza-dC treatment. Therefore, we considered that CpG island hypermethylation was responsible for the lack of GSTP1 expression in the MGC-803 cell line. Then, the effects of restoration of GSTP1 expression in MGC-803 cells on the survival rate of cells treated with chiral Au NCs were investigated using MTT assay. As shown in Fig. 10F, the cytotoxicity of AuNCs@D-GSH against MGC-803 cells was markedly diminished. Taken together, all these results highly suggested that GSTP1 protecting GES-1 cells and GSTP1 expression restored MGC-803 cells against oxidative stress caused by chiral Au NCs and contributing to cell survival. Schematic representation of the cytotoxicity induced by AuNCs@L-GSH and AuNCs@D-GSH was shown in Fig. 11.
Schematic representation of the cytotoxicity induced by AuNCs@L-GSH and AuNCs@D-GSH.
Conclusion
In summary, we firstly report that both AuNCs@L-GSH and AuNCs@D-GSH are capable of inducing ROS generation and activating integrated cytotoxic effects that include mitochondrial depolarization, DNA damage, cell cycle arrest and apoptosis mediated death. Of particular interest is that the D-GSH-capped Au NCs are comparatively more toxic than L-GSH-capped ones for both MGC-803 and GES-1 cells based on the principle of ROS induction. The cell physiology-based toxicity study demonstrates that the chirality of Au NCs is a crucial feature that determines the type and magnitude of the cellular response. We exploit the technology of microarray to analyze the transcriptome, to obtain comprehensive knowledge of molecular mechanism of the cytotoxic effects. Our data suggest that both L-and D-GSH-capped Au NCs caused the up-regulation of genes involved in cellular rescue and stress response, while AuNCs@D-GSH, affecting MGC-803 cells in a more complex way, individually induced up-regulation of transcripts involved in some metabolic- and biosynthetic-related response. Moreover, MGC-803 cells are more sensitive to the oxidative stress damage induced by Au NCs than GES-1 cells, which may be associated with GSTP1 hypermethylation. This chirality-associated regulation of cytotoxicity highlights the importance of the interplays between chiral materials and biological system at sub-nano level. We expect that a better understanding of mechanism of chiral Au NCs injury, together with epigenetic changes of biological systems, will allow us to predict the modes-of-action of similar agents.
Supplementary Material
Figs. S1 - S10, Table S1.
Acknowledgements
This work is supported by National Key Basic Research Program (973 Project) (No. 2010CB933901), the National Natural Scientific Foundation of China (Grant No. 81225010, 20803040, 81028009, and 31170961).
Competing Interests
The authors report no conflicts of interest.
References
1. Blackmond DG. The origin of biological homochirality. Cold Spring Harbor perspectives in biology. 2010;2:a002147
2. Amabilino D. Chirality at the Nanoscale: Nanoparticles, surfaces, materials and more. Germany: Wiley-VCH Weinheim Publisher. 2009
3. Farrag M, Tschurl M, Heiz U. Chiral gold and silver nanoclusters: Preparation, size selection, and chiroptical properties. Chem Mater. 2013;25:862-70
4. Slocik JM, Govorov AO, Naik RR. Plasmonic circular dichroism of peptide-functionalized gold nanoparticles. Nano lett. 2011;11:701-5
5. Zhu M, Qian H, Meng X, Jin S, Wu Z, Jin R. Chiral Au25 nanospheres and nanorods: synthesis and insight into the origin of chirality. Nano lett. 2011;11:3963-9
6. Zhang C, Zhou Z, Qian Q, Gao G, Li C, Feng L. et al. Glutathione-capped fluorescent gold nanoclusters for dual-modal fluorescence/X-ray computed tomography imaging. J Mater Chem B. 2013;1:5045-53
7. Qian H, Zhu M, Wu Z, Jin R. Quantum sized gold nanoclusters with atomic precision. Acc Chem Res. 2012;45:1470-9
8. Xu Q, Kumar S, Jin S, Qian H, Zhu M, Jin R. Chiral 38-Gold-Atom Nanoclusters: Synthesis and Chiroptical Properties. Small. 2013
9. Knoppe S, Bürgi T. Chirality in Thiolate-Protected Gold Clusters. Acc Chem Res. 2014;47:1318-26
10. Schaaff TG, Knight G, Shafigullin MN, Borkman RF, Whetten RL. Isolation and selected properties of a 10.4 kDa gold: glutathione cluster compound. J Phys Chem B. 1998;102:10643-6
11. Yao H, Fukui T, Kimura K. Chiroptical responses of D-/L-penicillamine-capped gold clusters under perturbations of temperature change and phase transfer. J Phys Chem C. 2007;111:14968-76
12. Wu G, Fang Y-Z, Yang S, Lupton JR, Turner ND. Glutathione metabolism and its implications for health. J Nutr. 2004;134:489-92
13. Knoppe S, Dolamic I, Bürgi T. Racemization of a chiral nanoparticle evidences the flexibility of the gold-thiolate interface. J Am Chem Soc. 2012;134:13114-20
14. Dolamic I, Knoppe S, Dass A, Bürgi T. First enantioseparation and circular dichroism spectra of Au38 clusters protected by achiral ligands. Nat Commun. 2012;3:798-804
15. Wang Y, Chen J, Irudayaraj J. Nuclear targeting dynamics of gold nanoclusters for enhanced therapy of HER2+ breast cancer. ACS nano. 2011;5:9718-25
16. Liu J, Yu M, Zhou C, Yang S, Ning X, Zheng J. Passive tumor targeting of renal-clearable luminescent gold nanoparticles: long tumor retention and fast normal tissue clearance. J Am Chem Soc. 2013;135:4978-81
17. Zhang X-D, Luo Z, Chen J, Shen X, Song S, Sun Y. et al. Ultrasmall Au10-12(SG)10-12 Nanomolecules for High Tumor Specificity and Cancer Radiotherapy. Adv Mater. 2014;26:4565-8
18. Zhang X-D, Chen J, Luo Z, Wu D, Shen X, Song S-S. et al. Enhanced Tumor Accumulation of Sub-2 nm Gold Nanoclusters for Cancer Radiation Therapy. Adv Healthc Mater. 2014;3:133-41
19. Li Y, Zhou Y, Wang HY, Perrett S, Zhao Y, Tang Z. et al. Chirality of glutathione surface coating affects the cytotoxicity of quantum dots. Angew Chem Int Ed. 2011;50:5860-4
20. LeBel CP, Ischiropoulos H, Bondy SC. Evaluation of the probe 2', 7'-dichlorofluorescin as an indicator of reactive oxygen species formation and oxidative stress. Chem Res Toxicol. 1992;5:227-31
21. Pastore A, Federici G, Bertini E, Piemonte F. Analysis of glutathione: implication in redox and detoxification. Clin Chim Acta. 2003;333:19-39
22. Pan Y, Leifert A, Ruau D, Neuss S, Bornemann J, Schmid G. et al. Gold nanoparticles of diameter 1.4 nm trigger necrosis by oxidative stress and mitochondrial damage. Small. 2009;5:2067-76
23. Ly J, Grubb D, Lawen A. The mitochondrial membrane potential (ΔΨm) in apoptosis; an update. Apoptosis. 2003;8:115-28
24. Kroemer G, Reed JC. Mitochondrial control of cell death. Nat Med. 2000;6:513-9
25. Karna P, Zughaier S, Pannu V, Simmons R, Narayan S, Aneja R. Induction of reactive oxygen species-mediated autophagy by a novel microtubule-modulating agent. J Biol Chem. 2010;285:18737-48
26. Mah L, El-Osta A, Karagiannis T. γH2AX: a sensitive molecular marker of DNA damage and repair. Leukemia. 2010;24:679-86
27. AshaRani P, Low Kah Mun G, Hande MP, Valiyaveettil S. Cytotoxicity and genotoxicity of silver nanoparticles in human cells. ACS nano. 2008;3:279-90
28. Tanaka H, Arakawa H, Yamaguchi T, Shiraishi K, Fukuda S, Matsui K. et al. A ribonucleotide reductase gene involved in a p53-dependent cell-cycle checkpoint for DNA damage. Nature. 2000;404:42-9
29. Fan LM, Li J-M. Evaluation of methods of detecting cell reactive oxygen species production for drug screening and cell cycle studies. J Pharmacol Toxicol Methods. 2014;70:40-7
30. Zhou YB, Feng X, Wang LN, Du JQ, Zhou YY, Yu HP. et al. LGH00031, a novel ortho-quinonoid inhibitor of cell division cycle 25B, inhibits human cancer cells via ROS generation. Acta Pharmacol Sin. 2009;30:1359-68
31. Pillai S, Behra R, Nestler H, Suter MJ-F, Sigg L, Schirmer K. Linking toxicity and adaptive responses across the transcriptome, proteome, and phenotype of Chlamydomonas reinhardtii exposed to silver. Proc Natl Acad Sci. 2014;111:3490-5
32. Xie Y, Lai D, Mao Y, Zhang W, Shen W, Guan R. Molecular cloning, characterization, and expression analysis of a novel gene encoding L-cysteine desulfhydrase from Brassica napus. Mol Biotechnol. 2013;54:737-46
33. Diwakar L, Ravindranath V. Inhibition of cystathionine-gamma-lyase leads to loss of glutathione and aggravation of mitochondrial dysfunction mediated by excitatory amino acid in the CNS. Neurochem Int. 2007;50:418-26
34. Jin Y, Penning TM. Aldo-keto reductases and bioactivation/detoxication. Annu Rev Pharmacol Toxicol. 2007;47:263-92
35. Chatterjee N, Eom HJ, Choi J. A systems toxicology approach to the surface functionality control of graphene-cell interactions. Biomaterials. 2014;35:1109-27
36. Li X, He Q, Shi J. Global gene expression analysis of cellular death mechanisms induced by mesoporous silica nanoparticle-based drug delivery system. ACS Nano. 2014;8:1309-20
37. Gou N, Onnis-Hayden A, Gu AZ. Mechanistic toxicity assessment of nanomaterials by whole-cell-array stress genes expression analysis. Environ Sci Technol. 2010;44:5964-70
38. Eichten SR, Schmitz RJ, Springer N. Epigenetics: more than chromatin modifications and complex gene regulatory systems. Plant Physiol. 2014
39. Jones PA, Takai D. The role of DNA methylation in mammalian epigenetics. Science. 2001;293:1068-70
40. Ronneberg JA, Tost J, Solvang HK, Alnaes GI, Johansen FE, Brendeford EM. et al. GSTP1 promoter haplotypes affect DNA methylation levels and promoter activity in breast carcinomas. Cancer Res. 2008;68:5562-71
41. Ehrlich M. DNA methylation in cancer: too much, but also too little. Oncogene. 2002;21:5400-13
42. Cairns P, Esteller M, Herman JG, Schoenberg M, Jeronimo C, Sanchez-Cespedes M. et al. Molecular detection of prostate cancer in urine by GSTP1 hypermethylation. Clin Cancer Res. 2001;7:2727-30
43. Hayes JD, Strange RC. Potential contribution of the glutathione S-transferase supergene family to resistance to oxidative stress. Free Radic Res. 1995;22:193-207
44. Kumar V, Yadav CS, Datta SK, Singh S, Ahmed RS, Goel S. et al. Association of GSTM1 and GSTT1 polymorphism with lipid peroxidation in benign prostate hyperplasia and prostate cancer: a pilot study. Dis Markers. 2011;30:163-9
45. Christman JK. 5-Azacytidine and 5-aza-2'-deoxycytidine as inhibitors of DNA methylation: mechanistic studies and their implications for cancer therapy. Oncogene. 2002;21:5483-95
46. Prifti E, Zucker J-D, Clement K, Henegar C. FunNet: an integrative tool for exploring transcriptional interactions. Bioinformatics. 2008;24:2636-8
Author contact
![]() Corresponding author: Daxiang Cui, E-mail: dxcuiedu.cn; Tel&Fax: +86 021-34206886.
Corresponding author: Daxiang Cui, E-mail: dxcuiedu.cn; Tel&Fax: +86 021-34206886.