Theranostics
13.3
Impact Factor
- Issue 9; 2026
- Issue 8; 2026
- Issue 7; 2026
- Issue 6; 2026
- Issue 5; 2026
- Volume 16; 2026
- Advance Articles
- Past Issues
- Cover Images
- Cover Suggestion
- Special Issues
Top
Introduction
Materials and Methods
Results and Discussion
Acknowledgements
Supplementary Material
References
Introduction
Materials and Methods
Results and Discussion
Acknowledgements
Supplementary Material
References
International Journal of Biological Sciences
International Journal of Medical Sciences
 Global reach, higher impact

Theranostics 2014; 4(6):614-628. doi:10.7150/thno.8478 This issue Cite
Research Paper
Polyacrylamide-Based Biocompatible Nanoplatform Enhances the Tumor Uptake, PET/fluorescence Imaging and Anticancer Activity of a Chlorophyll Analog
Anurag Gupta1, Shouyan Wang2, Aimee Marko1, Penny Joshi1, Manivannan Ethirajan1, Yihui Chen1, Rutao Yao3, Munawwar Sajjad3, Raoul Kopelman2, Ravindra K. Pandey1 ![]()
1. PDT Center, Cell Stress Biology, Roswell Park Cancer Institute, Buffalo, NY 14263, USA;
2. Department of Chemistry, University of Michigan, Ann Arbor, Michigan 48109, USA;
3. Department of Nuclear Medicine, State University of New York, Buffalo, NY 14032, USA.
Received 2014-1-2; Accepted 2014-2-13; Published 2014-3-16
Citation:
Gupta A, Wang S, Marko A, Joshi P, Ethirajan M, Chen Y, Yao R, Sajjad M, Kopelman R, Pandey RK. Polyacrylamide-Based Biocompatible Nanoplatform Enhances the Tumor Uptake, PET/fluorescence Imaging and Anticancer Activity of a Chlorophyll Analog. Theranostics 2014; 4(6):614-628. doi:10.7150/thno.8478. https://www.thno.org/v04p0614.htm
Other stylesAbstract

In this report we demonstrate the outstanding advantages of multifunctional nanoplatforms for cancer-imaging and therapy. The non-toxic polyacrylamide (PAA) nanoparticles (size:18-25 nm) formulation drastically changed the pharmacokinetic profile of the 124I- labeled chlorophyll-a derivative (formulated in 10% ethanol in PBS) with a remarkable enhancement in tumor uptake, and significantly reduced uptake in spleen and liver. Among the various nanoformulations investigated, the 124I- labeled photosensitizer (dose: 0.6142 MBq), and the cyanine dye-nanoparticles (CD-NP) conjugate (dose 0.3 μmol/kg) in combination showed great potential for tumor imaging (PET/NIR fluorescence) in BALB/c mice bearing Colon26 tumors. Compared to free non-labeled photosensitizer, the corresponding PAA nanoformulation under similar treatment parameters showed a remarkable enhancement in long-term tumor cure by PDT (photodynamic therapy) and provides an opportunity to develop a single nanoplatform for tumor-imaging (PET/fluorescence) and phototherapy, a practical “See and Treat” approach.
Keywords: Nanoparticles, photodynamic therapy, Positron Imaging Tomography, Reactive Oxygen species.
Introduction
Multifunctional nano-platforms that combine both imaging and therapy, while improving selective uptake in tumors, have been of interest for the treatment of cancer, especially when the platforms are non-toxic, biodegradable and bio-eliminable.1-8 Below we describe such a safe multimodal and multifunctional nanoformulation, designed to combine optical and PET imaging, photodynamic therapy, favorable pharmacokinetics and selective tumor uptake in mice bearing Colon26 tumors.
Optical imaging technologies, which exploit the physics of optical propagation in tissue, may add many important advantages to the imaging options currently available to physicians and researchers9,10. In fluorescence imaging the fluorophores either already present in the subject or intravenously (i. v.) injected, are excited by an external light source at appropriate wavelength(s) and the light emitted at longer wavelength is captured, which provides the image of the subject. However, significant challenges emerge in vivo due to the autofluorescence of tissue at wavelengths below 700 nm. This has led to a transition of research activities to near-infrared dyes (700-800 nm) which have demonstrated more feasibility for in vivo imaging due to much lower autofluorescence of tissue, deeper tissue penetration and reduced scattering at these wavelengthes11-16. The strength of optical imaging is that the images are produced in real-time and the imaging is easy to perform, relatively inexpensive and highly sensitive compared to many of the other imaging modalities. Near-infrared (NIR) fluorescence imaging has shown tremendous benefits in preclinical and clinical image guided therapy17, but quantitation still suffers with limitations. Moreover, fluorescence in combination with other imaging modalities, e.g., PET, could be extremely useful. The key feature for PET imaging is its capability in quantitatively imaging objects, such as human body, with great depth.18-19 Both techniques are highly sensitive and require low doses. Compared to fluorescence, PET does not suffer from depth of penetration issues and is used routinely in imaging cancer patients. However, it requires radioactive compounds and is expensive. Thus, both techniques have advantages and limitations, but could be complimentary to each other.20-22 Therefore efforts are currently underway in various laboratories, including ours to develop agents with both fluorescence (NIR) and PET imaging abilities.
18F- FDG (fluorodeoxyglucose) is the PET agent currently being used in most of the PET centers for tumor-imaging.23 Its half-life is 110 min and can be manufactured in a large quantity and with high specificity. Its short half-life, which means low radiation dose to the subject, is an attractive feature. Besides its established role as a diagnostic technique, PET also has an expanding role as a method to assess the response to therapy, in particular cancer therapy24, where the risk to the patient from a lack of knowledge about disease progression is much greater than the risk associated to radiation-based tests. Limitations of the widespread use of PET arise from the access to the desired radiopharmaceutical. Due to the high costs of cyclotrons needed to produce the short-lived radionuclides for PET imaging and the need for specially adapted on-site chemical synthesis apparatus to produce the radiopharmaceuticals, only a few hospitals and Universities are capable of maintaining such systems. Therefore, most clinical PET studies are supported by third-party suppliers to support many sites simultaneously. Due to a short half-life, F-18 radiopharmaceutical undergoes multiple half-lives of decay during a working day. This limits the geographical range of radiation dose delivery, and creates inconveniences in frequent recalibration of the remaining dose (determination of activity per unit volume) and careful planning with respect to patient scheduling. On the other hand, radionuclides with longer half-life [for example 124I- (4.2 days)] allow transportation to PET imaging sites at variable distances. In addition the photosensitizer discussed herein requires 24 hours to accumulate in the tumor, and the half-life of F-18 (~1.5 hours) precludes its use at longer time points.
Materials and Methods
Chemistry: The photosensitizer methyl 3-(1'-m-iodobenzyloxy)ethyl-3-devinylpyropheophorbide-a was derived from chlorophyll-a, which in turn was extracted from Spirulina pacifica by following the established methodology in our laboratory. The corresponding 124I-agent was prepared on reacting the intermediate trimethyl tin analog with 124I- labeled sodium iodide.
Acronyms: AFPAA (Amine Functionalized Polyacrylamide Nanoparticles), Dioctyl Sulfosuccinate Sodium Salt (AOT), 3-(aminopropyl) methacrylamide (APMA), 3-(acryloyloxy)-2-hydroxypropyl methacrylate (AHM), and Phosphate Buffered Saline (PBS).
Synthesis of PS2 (124I-analog of PS1): Iodine-124 was produced in our facility via 124Te(p,n)124I reaction.25 The 124TeO target was irradiated by 14.1 MeV protons beam and the 124I produced was purified by dry distillation. The activity was trapped in 0.1 mL of 0.1 N NaOH. The trimethyltin analogue of PS1 (40 µg) was dissolved in 50 µl of 5% acetic acid in methanol, and 100 µl of 5% acetic acid in methanol was added to a dried Na124I tube. The two solutions were mixed and 10 µl of N-chlorosuccinimide in methanol (1 mg/mL) was added. The reaction mixture was incubated at room temperature for 8 minutes, and the reaction product was purified on a HPLC column (Waters Symmetry C18 5µm), eluted with a 95:5 mixtures of methanol and water at a flow rate of 1 mL/min. The output was monitored by UV (254 nm) and radioactivity detectors. The labeled product was collected and dried. Final product was formulated in 10% ethanol in saline for injection in mice for imaging and biodistribution studies.
Preparation of Blank Amine Functionalized Polyacrylamide Nanoparticles (AFPAA) Synthesis of Blank AFPAA Nanoparticles: To a dry 100 mL round bottom flask, hexane (VWR, USA) 45 mL was transferred and degassed under a constant purge of argon for 45 min. AOT (1.6 g, Sigma-Aldrich, USA) and Brij 30 (3.1 g or 3.3 mL, Sigma-Aldrich, USA) were added to the reaction flask and stirred under argon protection for 20 min. Acrylamide (711 mg, Sigma-Aldrich, USA), APMA (89 mg, Polysciences, USA) and biodegradable AHM (428 mg or 375 μL, Sigma-Aldrich, USA) were dissolved in phosphate buffered saline (2 mL) (PBS, 10 mM pH=7.4) and the entire mixture was sonicated (5 min) to obtain a uniform solution. This solution was then added to the hexane reaction mixture and vigorously stirred for 20 min at room temperature. The polymerization of acrylamide was initiated by adding 40 μL of freshly prepared aqueous ammonium persulfate solution (10% w/v, Sigma-Aldrich, USA) and TEMED (40 μL, Sigma-Aldrich, USA). The resulting solution was stirred vigorously overnight. At the completion of polymerization, hexane was removed by rotary evaporation and the particles were precipitated by addition of ethanol (50 mL). The surfactant and residual monomers were washed away from the particles with ethanol (150 mL, Pharmaco-Aaper, USA) followed by washing with water (100 mL) five times each in an Amicon ultra-filtration cell equipped with a Biomax 300 kDa cutoff membrane (Millipore, USA). The concentrated nanoparticles were lyophilized overnight, and stored at -20°C.
Post-Loading of the PS1 to Blank AFPAA Nanoparticles to Formulate (NP1): The lyophilized AFPAA NPs were dissolved in 1% Tween-80 / PBS (pH 7.4, 10 mM) to a final concentration of 10, 1, and 0.5 mg PAA NPs per mL. The NPs were sized by DLS prior to the post-loading of PS1 to ensure that they were of the appropriate size. PS1 was dissolved in DMSO to a final concentration of 20 mM. 20 µL of PS1 in DMSO was added to 2 mL of NP solution and was magnetically stirred at a constant rpm for 2 hours. The NP solution was transferred to an Amicon Ultra-4 30 kDa centrifuge filter and centrifuged at 4,000 rpm for 40 minutes to remove excess DMSO, Tween-80, and PS1 that did not post-load. The filtrate was spectrophotometrically measured and if signal for PS1 was detected, the retentate was reconstituted to the original volume with PBS and re-centrifuged. This was continued until no signal was detectable in the filtrate spectrophotometrically. The nanoparticle solution was syringed filtered and then the concentration of PS1 was measured in ethanol using the Beer's-Lambert Law (molar exctinction coefficient: 47,500 L m-1 cm-1). The nanoparticles may cause scattering in the absorbance spectra. If this occurs, the nanoparticle solution can be centrifuge filtered in a microfuge membrane-filter (NANOSEP 100K OMEGA, Pall Corporation) at 14,000 RPM for 10 minutes. The filtrate was used to calculate the concentration of PS1 that was post-loaded to the PAA NPs. The nanoparticles were syringe filtered with a 0.2 µm syringe filter and stored at 4oC for further use.
PAA NPs Post-Loaded with 124I-labeled Photosensitizer (NP2): The lyophilized amine functionalized polyacrylamide nanoparticles (AFPAA NPs) were suspended in 1% Tween-80 / PBS (pH 7.4, 10 mM) to a final concentration of 10 mg / 1 ml. The NPs were sized by DLS prior to the post-loading of 124I-labeled or non-labeled photosensitizer to ensure that they were of the appropriate size 2.1 ml of the NP solution was added to the vial containing 124I-labeled photosensitizer dissolved in a 100 µl of DMSO. The solution was magnetically stirred at a constant rpm for 2 hours. The NP solution was transferred to an Amicon Ultra-4 30 kDa centrifuge filter to remove excess DMSO, Tween-80, and 124I-labeled photosensitizer that did not post-load. 1.3 ml of additional PBS was used in the transfer process to ensure that the entire radioactivity was transferred from the vial to an Amicon Ultra-4 30 kDa centrifuge filter. The NP solution in the centrifuge filter was centrifuged at 4,000 rpm for 40 min. Post-centrifuge filtration; the amount of radioactivity released from the NP was measured. If the activity in the filtrate was greater than 5%, then the retentate was reconstituted to the original volume with PBS and re-centrifuged. This process was repeated until less than 5% of the total radioactivity was found in the filtrate. The rententate was reconstituted to 1.5 ml with PBS to ensure that each 100 µl of NP solution will contain ~40-60 µCi of activity.
Conjugating Cyanine Dye (CD) to blank AFPAA to Formulate (NP3): 50 mg of lyophilized AFPAA nanoparticles is suspended in 3 mL of PBS (1x, pH 7.4) and sonicated for 10 minutes. 4 mg of CD (4.1 μmoles) in 100 μL of DMSO is mixed with 1.9 mL of MES buffer (100 mM, pH 6.0) that contains EDCI (11 mg, 57.4 μmoles, 14 eq.), and Sulfo-NHS (31 mg, 142.8 μmoles, 34.8 molar eq.). The AFPAA nanoparticles are then added to the CD solution along with 3 drops of 1 N NaOH (final solution pH is 7 or higher) and magnetically stirred for 2 hours. To remove any unreacted CD, excess DMSO and the isourea by-product, the AFPAA nanoparticle solution was centrifuge filtered in an Amicon Ultra-4 100 kDa centrifuge filter for 40 minutes at 4,000 RPM. The filtrate was measured spectrophotometrically for the presence of cyanine dye. The retentate was reconstituted with 18 MΩ water and re-centrifuge filtered. The retentate was reconstituted with 18 MΩ water, mixed well and then sonicated and vortexed (~1.5 to 2 hours of sonication). The solution was syringe filtered immediately, while still warm to touch and after the nanoparticles disperse into solution, with a 0.2 μm syringe filter. To remove any CD that was post-loaded, the AFPAA NP solution was suspended in 200 proof ethanol and centrifuged at 14,000 RPM for 10 minutes using an Eppendorf tabletop centrifuge 5415C. The NP pellet was air dried, and the ethanol and centrifuge steps are repeated until the concentration was less than 1 μM of supernatant. The nanoparticle pellet was brought into 18 MΩ water through the aid of sonication/vortexing and breaking of the pellet with a sterile spatula. The concentration of the filtrate/supernatant was measured spectrophotometrically, using 197,000 (L mol -1 cm-1) as the molar extinction coefficient when diluted in ethanol. The solution was stored at 4oC and prior to use, the nanoparticles are sonicated to disperse all the pellets.
Post-Loading PS2 to CD-Conjugated PAA NPs (NP3): to formulate (NP4) The CD-conjugated PAA NPs (NP3) are diluted with Tween-80 in PBS such that the final v/v percentage of Tween-80 in the nanoparticles is 1% and the concentration of NP3 prior to injection in mice is 0.3 μmoles/kg. The procedure at this point is similar to post-loading of PS2.
Formation of NP5: PS2 was post-loaded to blank AFPAA NPs as described above. NP3 was synthesized as described above. NP2 and NP3 were combined in a ratio that gave the desired concentration of the imaging agent (0.3μmoles/kg).
Post-Loading of the Labeled Photosensitizer to CD-Conjugated PAA NPs: The CD-conjugated PAA NPs are diluted with Tween-80 in PBS such that the final v/v percentage of Tween-80 in the nanoparticles is 1% and the concentration of CD-Conjugated PAA NPs prior to injection in mice is 0.3μmoles/kg. The procedure at this point is similar to post-loading of the 124I-labeled or non-labeled PS.
Characterization of Size of PAA Nanoparticle Formulation: The hydrodynamic diameter of the blank nanoparticle and NP1 were measured using the Nicomp 370 Submicron Particle Analyzer (Nicomp, Santa Barbara, CA). The NPs were diluted in a borosilicate glass tube with PBS (10 mM, pH 7.4) to achieve an intensity count of 300 kHz. The samples were measured in triplicate with each run lasting five minutes. The volume intensity weighting was used when determining the mean hydrodynamic diameter. The SEM images of the NPs indicated the size in the range of 18-25 nm. The purity/reproducibility of various batches of NPs was also confirmed by NMR spectroscopy.
Photophysical characterization: UV-Vis absorption spectra of compounds (MeOH solutions) were acquired using a Shimadzu UV-3600 spectrophotometer. The extinction coefficients of all compounds were determined by weighing a particular amount of solid and dissolving in a 50 ml volumetric flask using methanol as the solvent. First, the molar concentration (C) of each solution was calculated from its weight and volume. The absorbance (A) obtained from the UV-Vis spectrophotometric measurements was used to determine the extinction coefficient (ε) from Beer-Lambert's Law (A = εdC), where d is optical path length (cuvette thickness, d = 1cm) Fluorescence spectra were recorded using a Fluorolog-3 spectrofluorometer or a SPEX 270M Spectrometer (Jobin Yvon, Longjumeau, France). The SPEX 270M Spectrometer was utilized for measurements in NIR range; a 532 nm line from continuous wave solid state laser (Millenia, Spectra Physics) or laser diodes emitting at 630 and 785 nm were used as an excitation.
Measuring the Concentration of PS1 in NP1 and PS1 and CD in NP3, NP4, and NP5: To calculate the concentration of PS1 within NP1, NP1 is diluted in ethanol and measured spectrophotometrically using a Varian (Cary-50 Bio) with a molar extinction coefficient of 47,500  . To remove the scattering in the absorbance spectra, the nanoparticles were centrifuged filtered with a Microfuge membrane-filter (NANOSEP 100K OMEGA, Pall Corporation) at 5,000 rpm for 10 minutes. The NPs are retained above and the PS loaded within the NP is in the filtrate. The concentration of the PS1 in filtrate and in NP was measured spectrophotometrically. For measuring the concentration of CD in NP3, NP4, and NP5, the NP solution is diluted in 200-proof ethanol and measured spectrophotometrically as discussed above using 197,000 as the molar extinction coefficient value for the CD dissolved in methanol..
Animal and tumor models: Prior to commencement of in vivo studies all procedures/protocols were approved by the institutional animal care committee (IACUC). BALB/c mice 5-8 weeks of age were obtained from NCI Jackson Laboratory. The mice were inoculated subcutaneously (S.C.) on the right posterior shoulder with Colon26 (1 x 10⁶ cells in 50 µl medium) between 7-14 weeks of age.
Comparative PET Imaging: BALB/c mice were imaged using the microPET FOCUS 120, a dedicated 3D small-animal PET scanner (Concorde Microsystems Incorporated, USA) at the State University of New York at Buffalo under the Institutional Animal Care and Use Committee (IACUC) guidelines. 9-10 BALB/c mice were subcutaneously injected with 1 × 10⁶ Colon26 cells in 50 μL of RPMI-1640 media in the axilla region, and the tumors were grown until they reached 6 mm in diameter (approximately 7 days). 150 (5.55), 176.7 (6.54) 154.8 (5.73), 117.2 (4.34), and 16.6 (0.61), μCi (MBq) of PS2 NP2 (1.4 mg NPs/mouse), NP2 (0.05 mg NPs/mouse), NP4, and NP5, respectively, were injected and imaged 24, 48, and 72 h postinjection. The mice were imaged head prone under a protocol set for 30 minutes. Throughout the acquisition of the images, the mice were continuously anesthetized by inhalation of 1-3% isoflurane.
Radioiodine uptake by the thyroid or stomach was not blocked. All mice that were imaged were marked with a cross-line on their back to provide a reference landmark for consistently positioning them in a similar position each day they were imaged. The acquired data were refined with FORE algorithm20 and reconstructed using the 2D OSEM algorithm. The dead-time and singles-based random coincidence corrections were applied to all the PET studies. The RUV results were calculated from PET images with attenuation and scatter corrections using the AMIDE software. The equation for calculating the RUV is:

An elliptical cylinder ROI was used to define the field of view and the tumor region. Typically the field of view was set to 80 mm and the tumor region was set to 15 mm. Regions outside the field of view were set to 0. An iso-contour ROI was used to define the body volume for the mouse. The lower threshold was set to about 2-4% of the maximum voxel intensity and adjusted according to visual inspection. The RUV was then calculated as the maximum radioactive signal present in the tumor divided by the mean radioactive signal in the body.
AMIDE was also used for exporting the Maximum Intensity Projection (MIP) PET images of PS2, NP2, NP4, and NP5, 24, 48, and 72 hours post-injection and to generate the 48 h OSEM2D rotation. For the images and video, the color table was set to hot metal with the threshold type set to per slice and the threshold style set to min/max. The slice thickness for each image was set to 7.96 mm.
Biodistribution Studies: Studies discussed herein were performed following the approved IACUC guidelines. Nine mice/group were injected i.v. with 16.6-176.7 (0.61 - 6.54) μCi (MBq) of PS2, NP2 (1.4 and 0.05 mg NPs/mouse), NP4 (0.3 μmoles/kg of the cyanine dye), and NP5 (0.3 μmoles/kg of the cyanine dye), respectively. Three mice/sub-group were sacrificed at 24, 48, and 72 h post-injection and the blood and body organs, tumor, heart, liver, spleen, kidney, lung, muscle, gut, and stomach were removed. After all the fluids and tissues/organs were weighed, the amount of radioactivity in each sample was measured by a γ well counter. The radioactivity present in each sample was calculated as a percentage of the injected dose per gram of the tissue (% ID/g). A statistical analysis (standard deviation and the unpaired, two-tailed student t-test) was performed using Microsoft Excel to assess if the difference in radioactive uptake of PS2 and NP2 was significantly different (P value < 0.05).
Whole-Body Fluorescence Reflectance Imaging: Three BALB/c mice bearing subcutaneous Colon26 tumors were injected i.v. with 0.3 μmole/kg of CD-Conjugated PAA NPs (NP4). Prior to and during the imaging studies, the mice were anesthetized with 2-3% isoflurane. 4, 10, 24, and 48 h post-injection, the mice were imaged with Maestro GNIR Flex Imaging system (Cri, USA) using a 710 - 760 nm band-pass excitation and an 800 nm long-pass filter. The emission filter was set in front of the xenon lamp. Fluorescence emission was collected every 10 nm from 780 - 950 nm with the images spectrally unmixed according to the spectrum of the fluorophore in the tumor, skin spectrum (control mouse), fur spectrum (control mouse), and background (spectrum off the mouse being imaged). The exposure was set to 2000 ms. For a white light image of the mouse, the exposure was set to 7 ms.
Optical Imaging Analysis: The whole-body fluorescence reflectance images were analyzed using the Messtro imaging software. The fluorescent images were spectrally unmixed based on the signal present in the tumor to show only the signal that represents the cyanine dye in NP3. To calculate the Arbitrary Fluorescence Units (AFU) from each images, a Region of Interest (ROI) created from the four hour time point was used throughout for quantifying the AFU. All the images were set to the same lookup table and brightness values.
Comparative In-vitro Photosensitizing Efficacy: Colon26 cells were maintained in RPMI supplemented with 10% bovine calf serum, l-glutamine and antibiotics at 37oC, 5% CO2, 95% air, and 100% humidity. For the phototoxicity assay, Colon26 cells were seeded in 96-well plates at a density of 3,000 cells/well. After overnight incubation at 37oC PS1 and PS1 loaded nanoparticles (NP1) at a stock concentration of 10, 1, and 0.5 mg of NPs per mL of 1% Tween-80/PBS were added at a range of concentrations, 0.0125, 0.025, 0.05, and 0.1 µM, and incubated at 37oC for 24 h in the dark. The cells were washed with PBS, fresh growth medium was added, and the plates were irradiated with 0.25-2 J/cm2 of 665 nm argon-pumped dye laser light at a dose rate of 3.2 mW/cm2. Cells were incubated for an additional 48 hours and in the last 4 hours the MTT assay was performed to determine cell growth. Briefly, 20 μL of 4.0 mg/mμ of 3-[4, 5-dimethylthiazol-2-yl]-2, 5-diphenyltetrazoliumbromide (MTT) in PBS was added to the wells. After 4 hours incubation the medium was removed and 100 μL DMSO was added to solubilize the formazan crystals formed by cellular dehydrogenase activity. Absorbance was read on a microtiter plate reader at 570 nm. Cell growth after PDT was expressed relative to the growth of untreated controls.
Comparative In-vivo Photosensitizing Efficacy: 20 BALB/c mice (Jackson Laboratory, Bar Harbor, ME) were subcutaneously injected with 1 x 10⁶ Colon26 cells in RPMI 1640 media (axilla region). The tumors were grown to 4 - 5 mm in diameter prior to the laser light treatment. The mice were separated into two groups of 10. In the first group (n = 10), 1 μmole/kg of PS 2 diluted in D5W or 5% dextrose in water was injected intravenously 24 h prior to PDT. The day before the light treatment, the hair in the treatment area was depilated with the depilatory cream, Nair. In the second group (n = 10), NP 15 (1 µmole/kg), was injected intravenously 24 h prior to the light treatment. For the laser treatment, the argon-pumped dye laser was set to 665 nm with a monochromator, and the fluence and fluence rate used were 135 J/cm2 and 75 mW/cm2. After treatment, the mice were observed for, necrotic scabbing, weight loss, and tumor regrowth. Tumor regrowth was calibrated by two orthogonal measurements, length and width and the tumor volume was calculated according to the formula . If the tumor regrowth reached a volume of 400 mm3, the mice were euthanized according the institute policy.
Statistical Analysis: The error bars used in the biodistribution studies are represented as the mean ± S.D. To assess for significance, the two-tailed student's t-test was performed with P < 0.05 being significant. For the release kinetics data, the data is plotted as the mean ± S.E. The error bars and the statistical test were performed in Microsoft Excel. For the in vivo PDT efficacy studies, the statistical test used was the Mantel-Cox test. This test was done using Graph-pad Prism Version 5.03.
Results and Discussion
To investigate the utility of porphyrin-based compounds in PET/fluorescence imaging and photodynamic therapy,26-28 we synthesized and evaluated a series of 124I-labeled- compounds related to pyropheophorbide-a and purpurinimides derived from chlorophyll-a. Among the compounds evaluated, methyl 3-(m-iodobenzyloxy)ethyl-3-devinylpyropheo-pheophorbide-a 127I-PS1 (nonradioactive) and its (124I-PS2, radioactive) showed the highest potential for both PET/fluorescence imaging29-31 with an option of PDT in mice bearing Colon26 and other tumors (U87, RIF, lung, 4T1 and Panc-1).32 A comparative study indicated that in some of the indications (e. g. brain, colon, pancreatic, prostate), where 18F-FDG showed limited potential, the 124I-PS2 showed excellent PET imaging ability and PDT efficacy. However, it suffers from two main drawbacks: (i) though the compound showed significant tumor-avidity and 4-5% of the injected dose accumulated in the tumor 24h post injection, a significant uptake was also observed in the spleen and liver and (ii) the shift between the wavelengths absorption (665 nm) and fluorescence (670 nm) is small. However, an additional band (weak) is present at 710 nm, and can be used for fluorescence imaging.
For developing “ideal” agents for fluorescence-imaging and PDT we turned our attention to developing a PAA nanoplatform in which the PS and tumor-avid CD were post-loaded in desired concentrations and found the technique to be extremely useful for both tumor-imaging (fluorescence) and PDT.33 On the basis of these results we hypothesized that post-loading of the 124I-PS and conjugating a non-tumor avid CD should provide an efficient bifunctional NP for fluorescence and PET imaging.
To confirm our hypothesis, we first post-loaded biodegradable amine-functionalized PAA NPs (25-30 nm) with 124I-labeled PS2 in high concentration (Fig. 1). The loading efficiency of the PS was determined by measuring the radioactivity present in the NP formulation after centrifuge filtering the free PS. This approach was repeated several times and an average >99% post-loading efficiency was observed, based on the radioactivity present pre and post-centrifuge filtering. Changes in the absorbance and fluorescence spectra proved to be very informative in assessing the post-loading of PS into the PAA NPs. By measuring the absorption and fluorescence spectra of the filtrate throughout the post-loading process allowed us to establish the parameters to optimize the post-loading of the 124I- labeled and/or non-labeled agents in nanoparticles. Upon completion of the post-loading process (120 minutes), the optical absorption across the whole electronic absorption spectrum spectra of PS1 (3.0 μM) post-loaded to NPs (NP1) at variable concentrations (0.5, 1.0, and 10 mg of PAA NPs/ml). For NP1 (nanoparticle formulation 1), it was found to be sharper with a higher intensity than PS1 alone indicating less aggregation, which was further confirmed by measuring the fluorescence intensity in 17% BSA (bovine serum albumin).The aggregation/ dis-aggregation properties of the PS can be manifested by electronic absorption and fluorescence and were found to be extremely useful in monitoring the progress of post-loading of the PS in PAA NPs (Fig. 2). The measurement of absorption and fluorescence spectra of the PS post-loaded in the NP and in filtrates at various time intervals provide great advantage in monitoring the amount of the PS released and retained in NPs.
Figure 1
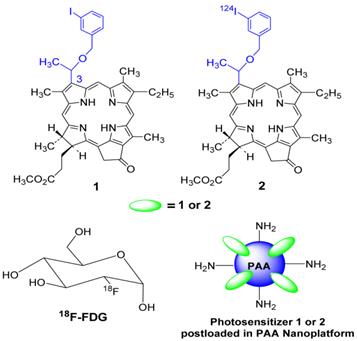
Structures of photosensitizer 1 (PS 1) the corresponding 124I- labeled analog 2, 18F-fluoro- deoxyglucose (FDG) and a schematic representation of photosensitizer (PS1 or PS2) post-loaded in polyacrylamide nanoparticles (PAANPs).
Figure 2
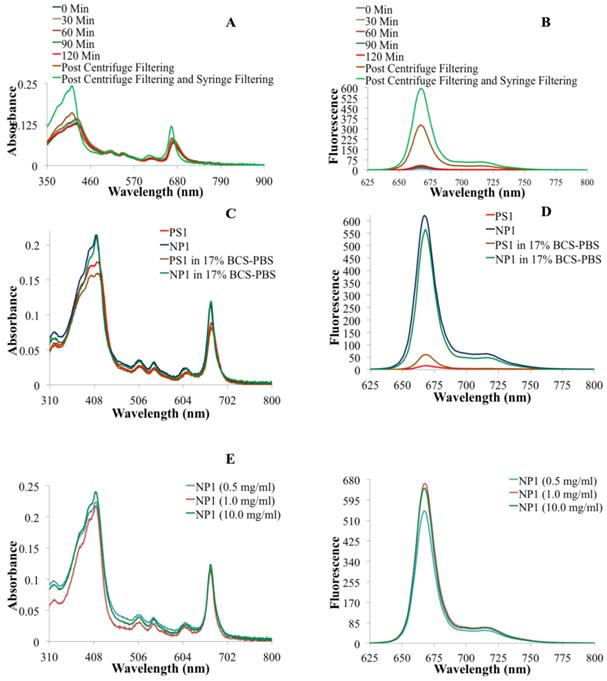
(A) Electronic absorbance spectra of NP1 at various time points during the post-loading of PS1 to nanoparticles. (B) The fluorescence spectra of NP1 at various times during the post-loading of PS1 to NPs. (C) The electronic absorbance spectra of PS1 and NP1 in drug solution form (aq. tween-80 solution) and in 17% Bovine Calf Serum in PBS (BCS-PBS), (D) the fluorescence spectra PS1 and NP1 in aq. Tween 80 and 17% BCS-PBS solutions. (E) The electronic absorbance spectra and (F) The fluorescence spectra of PS1 (3.0 μM) post-loaded to NPs (NP1) at variable concentrations (0.5, 1.0, and 10 mg of PAA NPs/ml).
Release Kinetic Studies: In brief, the PS1 post-loaded PAA NPs were mixed with 1% aqueous human serum albumin (HSA) solution (w/v). The absorption spectrum of the solution was measured and was marked as the stock absorbance. The solution was then centrifuged in an Amicon Ultracel-4, 100 kDa centrifuge filter at 4,000 RPM for 30 minutes. The filtrate was marked as filtrate #1 and is measured spectrophotometrically. The retentate was reconstituted to the original volume with 1% HSA, thoroughly mixed with a pipette, and re-centrifuge filtered. The filtrate was marked filtrate #2 and again the concentration of the PS1 was measured spectrophotometrically. To measure what was retained in the NP after the two wash steps, the NPs were reconstituted with 1% HSA, thoroughly mixed with a pipette and the concentration was measured spectrophotometrically. The results are summarized in Fig. 3.
Characterization of NPs: The NP preparations were characterized by NMR; the size was determined by transmission/scanning electron microscopy (TEM/SEM). Dynamic light scattering (DLS) was used to determine hydrodynamic diameter and surface charge. The NMR spectra of PAA NPs containing the presence of monomers and surfactant before and after ethanol wash are shown in Fig. 4. As can be seen, repeated ethanol wash helps in removing the undesired monomers and surfactants from the NPs. The surfactant and monomer peaks reduced as the number of washes increased. Ethanol washes continued till characteristic surfactant peaks disappeared. Thus, this approach along with DLS and TEM images characterization were extremely helpful in establishing the reproducibility of the NPs used in our study.
Characterization of Size by Dynamic Light Scattering (DLS) and Scanning Electron
Microscope (SEM) Analyses: The hydrodynamic diameter and size distribution measurements were determined by DLS on a Nicomp 370 Submicron Particle Sizer (Nicomp, Santa Barbara, California). The NP solution was passed through a 0.45 micron filter, placed in a borosilicate glass capillary tube and diluted with water to an intensity reading of 300 kHz. The readings were performed in a run set for 5 minutes. The volume weighted Gaussian proprietary analysis mode was used to determine the mean hydrodynamic diameter (Supplementary Material: Fig. S2). The morphology and size of the unformulated NPs were characterized by SEM. Lyophilized NP powder was placed on a mount with double-sided tape and crushed slightly to disrupt the macrostructure and expose fractured edges, then coated with evaporated carbon. The outside of the macrostructure is smooth due to the effect of lyophilization; sheared edges must be found in order to view NPs. Images were taken on a Hitachi SU-70 SEM set at 5.0 kV, 3.5mm x 100,000 magnification, SE(U). Lyophilized PAA NPs appeared circular and ranged from 25-35 nm (Supplementary Material: Fig. S3) before the post-loading procedure was performed.
The morphology and size of the NPs formulated in 1% Tween 80 in water were characterized by scanning electron microscope (SEM). A drop of NPs dispersed in water was placed on a glass slide and air dried, then coated with evaporated carbon. Images were taken on a Hitachi SU-70 SEM set at 2.0 kV, 3.2mm x 200,000 magnification, SE (U). Blank and photosensitizer (PS1) loaded PAA NPs ranged from 18-25 nm. The smaller size may be due to different drying procedures and the presence of Tween 80.
Figure 3
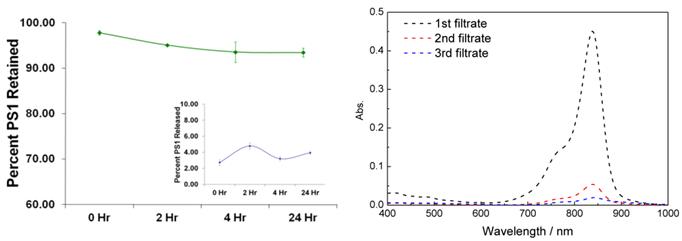
Release/Retention Profiles of PS1 from NP1 in a 1% Human Serum Albumin (HSA) solution. The release/retention was measured immediately upon addition NP1 in 1% HSA (0 Hr), 4, and 24 h post-addition of NP1 in a 1% HSA solution. Each experiment was done in triplicate with each time point being the mean. The error bars are standard error of the mean. The absorption spectra of free CD present in the CD-NPs conjugate NP3 upon separating from the nanoparticle by centrifuge filtering the nanoparticles in 200 proof ethanol as a solvent.
Figure 4
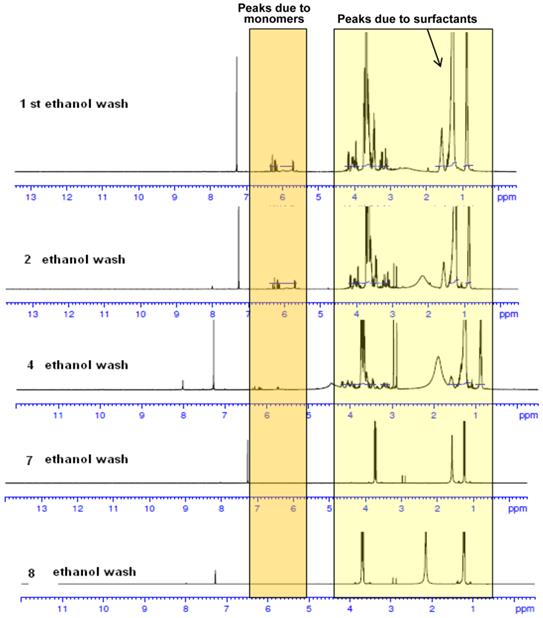
NMR spectra of PAA NPs with and without the presence of monomers and surfactants after repeated ethanol wash. The synthesis and purification was performed in a GMP facility.
Zeta Potential: The zeta potential was determined using a dynamic light scattering instrument and Zeta Potential software (Brookhaven Instruments, Holtsville, New York). The NPs were suspended in water at 0.2 mg/mL, passed through a 0.45 micron filter and measured in ten replicates. Blank PAA NP were found to have zeta potential +4.82 mV +/- 0.24, and post-loaded PAA NPs were found to have zeta potential +5.39 mV +/-0.62. The low zeta potential (less than +/-25 mV) suggests that the solution will have a tendency to aggregate over time (Supplementary Material: Fig. S4 & S5).
Optimization of PET/Fluorescence imaging and PDT parameters of NPs: In order to determine the minimal amount of NPs necessary for optimizing the post-loading of 124I-PS (PS2), it becomes important to determine the amount (mg) of nanoparticles that will be required for PET-imaging of an average cancer patient (70 kg). Therefore, we investigated the post-loading and imaging efficiency of 124I-agent in variable amounts of NPs using BALB/c mice bearing Colon26 tumors. We were able to reduce the amount of PAA NPs from 10 mg/ml to 0.5 mg/ml. The PET imaging results indicated that on reducing the amount of NPs from 10 mg/ml to 0.5 mg/ml did not show any significant changes in the photophysical properties of the photosensitizer and did not diminish its PET imaging ability. With a typical injection volume of 0.1 ml, this amount of PAA NPs (0.05 mg) required for PET-imaging per mouse should equate to 175 mg / 350 ml in a cancer patient. These results are of immense interest as it provides a simple approach to formulate inherently hydrophobic photosensitizer(s) into an aqueous nanoparticle solution, while being able to lower the nanoparticle concentration without reducing the imaging capability of the desired PET agent.
Our next step was to compare the PET imaging and in vivo biodistribution of the nanoformulation with free PS2 at variable time points (24h, 48h and 72 h) and 18F-FDG at 90 min, post-injection. From the results summarized in Fig. 6, it can clearly be seen that with the post-loaded formulation, the tumor can be demarcated easily at 24, 48 and 72 h post-injection (i.v.) with reduced background signal. The relative uptake value (RUV) of the imaging agent was used to quantify the visibility of the tumor and was calculated by the following formula:

In the RUV calculation, an iso-contour ROI was used to define the body volume for the mouse. The lower threshold was set to 2-4% of the maximum voxel intensity and adjusted according to visual inspection. The RUV calculation correlates with the established SUV and allows for the measurement of the relative tumor uptake without the need for measuring excreted radioactivity from the time of injection to the scan time. Figure 6 shows that the RUV for both PS2 and NP2 increased over time, i.e., the visibility of the tumor compared to the background signal improves. For NP2, the RUV value was consistently higher, starting at 3.17 for the mice that received 1.4 mg of PAA NPs post-loaded with PS2 (24 h post-injection) and maximizing at 9.8 for the mice that received 0.05 mg of PAA NPs post-loaded with PS2 (72 h post-injection), whereas for the “naked” PS2 the RUV increases with time from 1.91 at 24 h post-injection to 8.2 at 72 h post-injection. At 24 h post-injection, the RUV of NP2 (1.4 mg of PAA NPs) is 66% higher than the RUV of PS2 and at 72 h post-injection; the RUV of NP2 (0.05 mg of PAA NPs) is 13% higher than the RUV of PS2. Both PET images and the RUV data clearly show that the post-loading approach enhanced the detection of Colon26 tumors implanted in BALB/c mice.
A comparative biodistribution study of PS2, NP2 and 18F-FDG was performed in BALB/c mice bearing Colon26 tumors. From the results summarized in Fig. 7 it can be seen that by post-loading PS2 to PAA NPs, the percent injected dose/gram (%ID/gram) in the tumor at 24h post-injection significantly increased from an average value of 4.61% to 10.28% (P = 0.008). The NPs showed a remarkable decrease in accumulation of PS2 in the spleen and liver and significantly less in the heart and muscle if compared to 18F-FDG alone. The %ID/gram of PS2 present in the spleen and liver at 24 h post-injection was 15.51 and 9.32%, respectively. With the nanoparticle formulation NP2, the amount decreased to 2.02 and 3.99% and 1.61 and 2.91% for the 1.4 and 0.5 mg formulation, respectively.
The %ID/g for 18F-FDG in the same tumor model was also compared against NP2 and a significant difference (4.31% versus 10.28%, P = 0.019) was observed in the tumor. This reflects a 123% increase in PS2 (NP formulation) present in the tumor as compared to free PS2 (without NP formulation) and interestingly an increase of 139% if compared against 18F-FDG.
We also explored the possibility of developing a platform for PET/NIR fluorescence imaging in which PS2 (radioactive PS) was post loaded to NIR cyanine dye (CD) conjugated to PAA NPs. Such a construct provided an opportunity to vary the quantities of both the agents for optimal imaging. The schematic for the loading of the CD and PS2 to NPs is shown in Fig. 8.
Figure 5
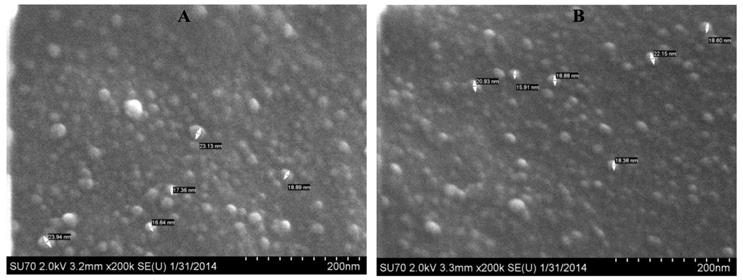
SEM images of (A): AFPAA- blank (100,000x magnification and (B): AFPAA-post- loaded with PS1 (100,000x magnification). Size: 18-25 nm.
Figure 6
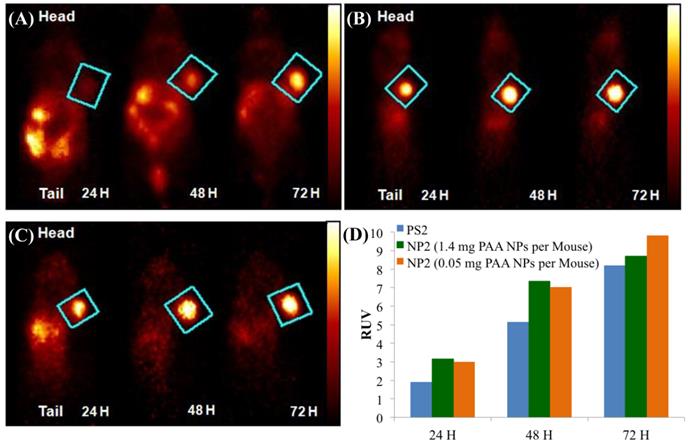
Whole body PET Images of BALB/c mice bearing subcutaneous Colon26 rumors on the right shoulder with (A) 124I-PS2 at 24, 48, and 72 h post-injection (i.v.), (B) 124I-PS2 post-loaded in PAA NPs (NP2 - 1.4 mg PAA NPs per mouse) at 24, 48, and 72 h post-injection (i.v.) (C) 124I-PS2 post-loaded in PAA NPs (NP2 - 0.05 mg PAA NPs per mouse) at 24, 48, and 72 h post-injection (i.v.) and (D) the relative uptake values (RUV) of PS2 and NP2 (1.4 mg and 0.05 mg PAA NPs containing same radioactivity (20 Ci/mouse) of the 124I-PS, suggesting that the amount of NPs used in formulation do not make any significant diffence in tumor uptake of the PET agent. For OSEM 2Drendered digital PET imaging movie of NP2, see Fig. 6, Supporting Material.
Figure 7
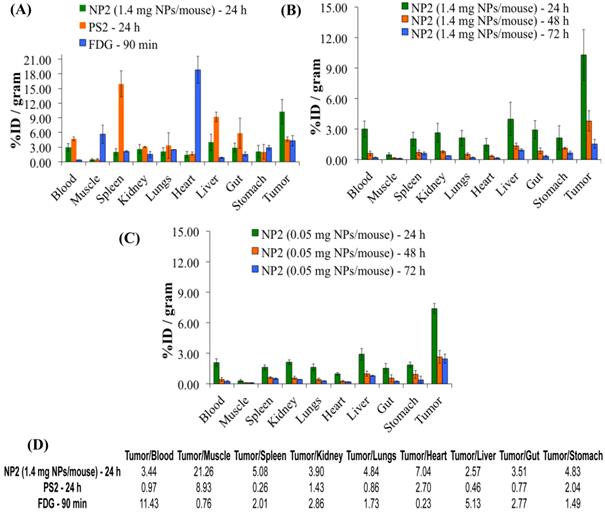
Comparative in-vivo biodistribution in BALB/c mice (3 mice/group) bearing Colon26 tumors on the right shoulder (A): PS2 (124I-PS1), NP2 (124I-analog post loaded in PAA NPs) and 18F-FDG (B) & (C): Optimization of the imaging at variable amount of PAA NPS (1.4 mg and .05 mg/mouse respectively) and time intervals. The amount of radioactivity injected: PS2 (124I-PS1 free) and PS2 post loaded in PAA NPs (NP2): 20μCi/mouse; 18F-FDG: 70μCi/mouse (not optimized).
Figure 8
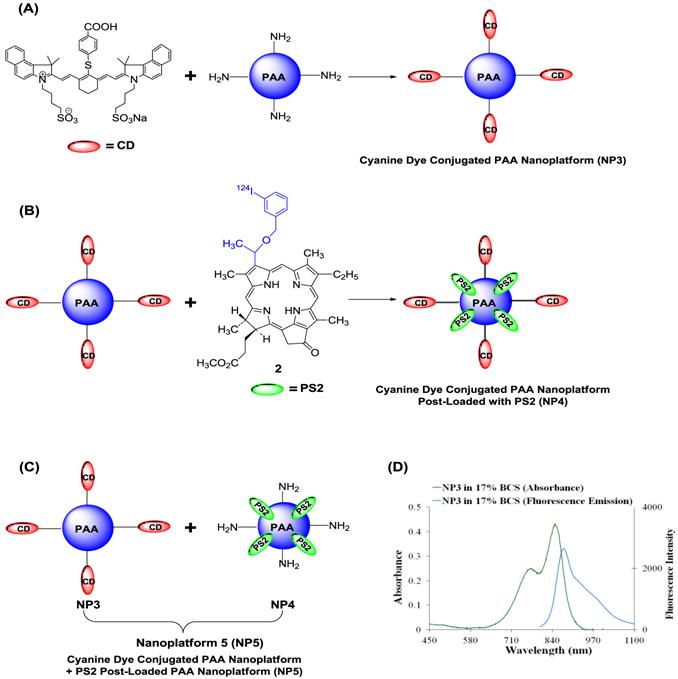
Schematic for creating the multifunctional PAA NPs for near-infrared and PET imaging (A): Near-Infrared Cyanine Dye (CD) conjugated PAA nanoplatform (NP3). (B): Near-Infrared Cyanine Dye conjugated PAA nanoplatform post-loaded with PS2 (NP4) (C): Near-Infrared Cyanine Dye conjugated PAA nanoplatform (NP3) combined with PS2 post-loaded nanoplatform to formulate nanoplatform 5 (NP5). (D): The absorbance and fluorescence spectra for NP3 in 17% bovine calf serum (BCS) in phosphate buffered saline (PBS). The excitation wavelength was 785 nm and the fluorescence was collected beyond 800 nm.
Whole-body fluorescence and PET imaging was performed in BALB/c mice bearing subcutaneous Colon26 tumors. From the results summarized in Fig. 9, the tumors are clearly identifiable by PET and reduced signals were observed from the non-target organs, e.g., liver and gut, and a substantial increase in relative tumor visibility was observed from 4 - 48 h post-injection. The PET imaging potential of the multifunctional nanoparticles is illustrated in panels E and F of Fig. 9, which indicate that at 24 h post injection, NP5 accumulates more in the tumor than NP4 (6.56% vs. 4.98% ID/g), but is not statistically significant. However, the difference in the liver (5.24% vs. 3.12% ID/g) at 24 h post-injection is significant (P<0.05). This allows for a higher degree of differentiation of the tumor versus the non-target organs. With NP5, PET imaging was accomplished with 16.6 µCi or 0.6142 MBq, which was ~10 times lower in radioactivity that was initially used. Thus we were able to reduce the dose of the 124I-agent as well as the amount of nanoparticles required for post-loading of the PET agent (0.05 mg of PAA NP/mouse), while maintaining its ability to perform real-time imaging.
Encouraged with these results we explored the utility of the post-loading approach in evaluating the PDT efficacy of the non- 124I-labeled analog. The PS was post-loaded by following the methodology used for the labeled agent, as discussed above. The biological efficacy of PS1 and the corresponding nanoformulation NP1 (10 mg/ml stock) was investigated in BALB/c mice bearing Colon26 tumors (10 mice/group). The mice were injected with PS or the corresponding NP formulation at a dose of 1.0 μmole/kg. The tumors were exposed to light at 665 nm (dose: 135 J/cm2, 75 mW/cm2) at 24 h post-injection and the tumor response was recorded daily following the animal protocol approved by the institutional IACUC committee. The percentages of tumor cure (tumor regrowth) are shown in Fig. 10(B). The Kaplan-Meier survival graph highlights the remarkable enhancement of long-term tumor cure with the NP formulation, from 20% (PS alone: 2/10 mice were tumor free) to 80% (8/10 mice were tumor free) with the corresponding nanoparticles (NP1) formulation.
One of the main concerns in developing nanoparticles in the area of health care has been due to unknown toxicity to organs other than tumors. Therefore, the organ toxicity of the PAA nanoparticles was investigated at four doses: 100 mg/kg (40-fold higher); 200 mg/kg (80-fold higher), 300 mg/kg (120-fold higher); and 400 mg/kg (160-fold higher), which were significantly higher than the required doses of the NPs for PET imaging (2.5 mg/kg or 0.05 mg per mouse). At all doses, the mice (3 BALB/c mice/group) were monitored for weight loss/gain and other signs of distress for 30 days post-injection of the nanoparticles. As can be seen from Fig. 10 (c), none of the mice showed any weight loss and the gain in weight was similar to the growth profile reported by Taconic Farms for BALB/c mice.32 On day 30, the mice were necropsied and the organs were analyzed for toxicity by H&E staining. No acute toxicity was observed even at 160-fold higher dose than the imaging dose. The H&E staining for the liver, spleen, heart, kidney and lung (dose: 400 mg/kg/group) along with the corresponding controls (BALB/c mice void of nanoparticles), and the weight of the mice for the duration of the study (30 days) are summarized in Fig. 10. The results illustrated in Fig. 10C and 10D clearly demonstrate that the amino-functionalized PAA NPs, even at 160-fold higher than the amount required for the post-loading of the 124I- PET imaging agent did not show any significant weight loss and organ toxicity respectively.
Figure 9
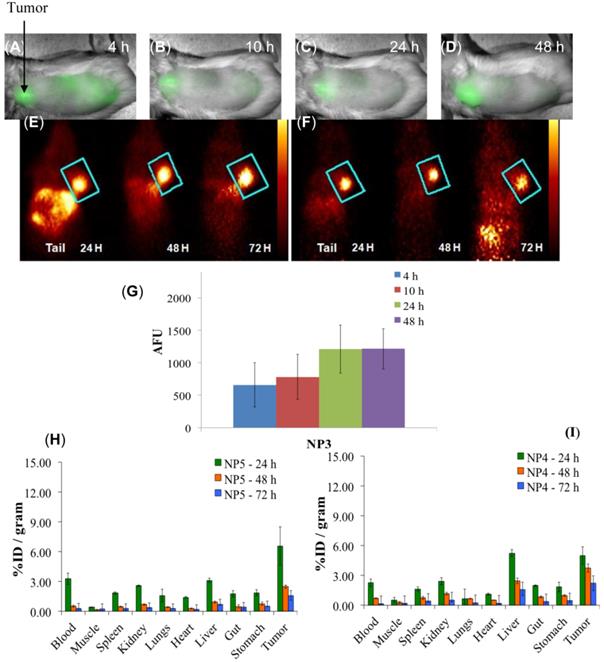
Multimodal imaging of NP3, NP4, and NP5 in BALB/c mice bearing Colon26 tumors. (A-D): Whole-body near-infrared fluorescence imaging of NP3, 4, 10, 24, and 48 h post-injection. (E): PET imaging of NP4. (F): PET imaging of NP5. (G): The arbitrary fluorescence units (AFU) of the cyanine dye (NP3) present in Colon26 tumors over time. The error bar is the standard deviation. (H and I): The organ biodistribution of NP4 and NP5. The diamond structures in panel E and F highlights the tumor.
Figure 10
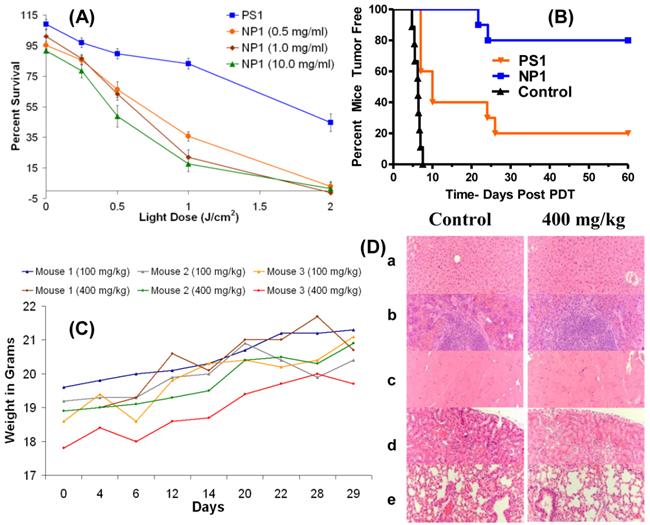
(A): In vitro (MTT Assay) PDT efficacy of PS1 and NP1 (0.5, 1.0, and 10.0 mg of PAA NPs per ml) on Colon26 cells (B): In vivo PDT data (% mice cured) by Kaplan-Meier survival curve show a significant difference in PDT efficacy of PS1 with and without NPs at a dose of 1.0 μmole/kg. The tumors were exposed to light (135 J/cm2 and 75 mW/cm2) 24 h post-injection. The P value for the two survival curves is < 0.0001 as determined by the Mantel-Cox test. (C): the weights of BALB/c mice (3 mice/group) injected with 100 mg/kg or 400 mg/kg of blank PAA NPs were recorded daily for 29 days. (D): Formalin-fixed, paraffin embedded hematoxylin-eosin (H.E.) stained tissue sections (representative sample for 400 mg/kg): (a) Liver, (b) spleen, (c) heart, (d) kidney, and (e) lung [Magnification: 200x].
In summary, our report describes the utility of a biodegradable/biocompatible, nontoxic PAA-based nanoparticles-photosensitizer formulation for developing a highly efficient “Multimodality Platform” for tumor-imaging by PET/Fluorescence and photodynamic therapy. Comparative tumor-imaging, biodistribution and PDT efficacy data clearly demonstrate the advantage of our approach and significant translational value. The PAA NPs formulation makes a significant difference in the pharmacokinetic profile of the PET and PDT agents. Thus it could provide an efficient approach to improve the drug delivery of various hydrophobic cancer therapeutic agents, not limited to PDT. To the best of our knowledge this is the first example to demonstrate the use of a non-toxic nanoconstruct for the use in PET and fluorescence image-guided PDT. Ongoing studies are focused on manufacturing the nanoparticles and photosensitizer in a GMP facility for detailed toxicological studies (including PK/PD studies) by following the US FDA guidelines, which is a requirement before initiating Phase-1 human clinical trials.
Acknowledgements
We thank Dr. Arindam Sen, Cell Stress Biology, Roswell Park Cancer Institute, Buffalo, NY for DLS analyses and Dr. Peter J. Bush, SUNY Buffalo South Campus Instrument Center for SEM images of PAA-based nanoparticles. The financial assistance from the NIH (RO1 CA127369) and the shared resources of the RPCI Support Grant (P30CA16056) is highly appreciated. We are highly thankful to Syngene, India for the preparation of PAA NPs in a GMP facility (Good Manufacturing Facility), following the guidelines of United States Food and Drug Administration (FDA).
Supplementary Material
Fig.S1 - S6.
Competing Interests
The authors have declared that no competing interest exists.
References
1. Ross B, Rehemtulla A, Koo Y-EL. et al. Photonic and magnetic nanoexplorers for biomedical use: From subcellular imaging to cancer diagnostics and therapy. Proc SPIE. 2004;5331:76-83
2. Kopelman R, Koo Y-EL, Philbert M. et al. Multifunctional nanoparticle platforms for in vivo MRI enhancement and photodynamic therapy of a rat brain cancer. J Magn Magn Mater. 2005;293:404-410
3. Reddy GR, Bhojani M, McConville P. et al. Vascular targeted nanoparticles for imaging and treatment of brain tumors. Clin Can Res. 2006;12(22):6677-6686
4. Koo Y-EL, Reddy R, Bhojani M. et al. Brain cancer diagnosis and therapy with nanoplatforms. Adv Drug Deliver Rev. 2006;58:1556-1577
5. Bhojani MS. et al. Cancer nanotechnology. American Scientific Publishers. 2006
6. Wang S, Kim G, Lee Y-E, Hah HJ, Ethirajan M, Pandey RK, Kopelman R. Multifunctional biodegradable polyacrylamide nanocarriers for cancer theranostics - A “see and treat” strategy. ACS Nano. 2012;6(8):6843-6851
7. Wang S, Fan W, Kim G, Hah HJ, Lee Y-E, Kopelman R, Ethirajan M, Gupta A, Goswami LN, Pera P, Morgan J, Pandey RK. Novel methods to incorporate photosensitizers into nanocarriers for cancer treatment by photodynamic therapy. Laser Surg Med. 2011;43:686-695
8. Hornyak GL, Tibbals HF, Dutta J, Moore JJ. Introduction to nanoscience & nanotechnology. Boca Raton, Florida, USA: CRC Press. 2009
9. Condeelis J, Weissleder R. In vivo imaging in cancer. Cold Spring Harb Perspect Biol. 2010;2:1-35
10. Srivatsan A, Jenkins SV, Jeon M, Wu Z, Kim C, Chen J, Pandey R. Gold nanocage-photosensitizer conjugates for dual-model image-guided enhanced photodynamic therapy. Theranostics. 2014;4(2):163-174
11. Kotecha R. and Toledo-Pereyra LH. Beyond the radiograph: radiological advances in surgery. J Invest Surg. 2011;24:195-198
12. Yoo H, Kim JW, Shishkov M. et al. Intra-arterial catheter for simultaneous microstructural and molecular imaging in vivo. Nat Med. 2011;17:1680-1684
13. Welch MJ, Hawker CJ, Wooley KL. The advantages of nanoparticles for PET. J Nucl Med. 2009;50:1743-1746
14. James NS, Chen Y, Joshi P, Ohulchanskyy TY, Ethirajan M, Henary M, Strekowsk L, Pandey RK. Evaluation of polymethine dyes as potential probes for near infrared fluorescence imaging of tumors: Part-1. Theranostics. 2013;3(9):692-702
15. James NS, Ohulchanskyy TY, Chen Y, Joshi P, Goswami LN, Pandey RK. Comparative tumor imaging and PDT efficacy of HPPH conjugated in the mono- and di-forms to various polymethine cyanine dyes. Theranostics. 2013;3(9):703-718
16. Gupta A, Pandey RK. Supramolecular approach for tumor imaging and photodynamic therapy. In: (ed.) Schneider HJ. Supramolecular Systems in Biomedical Fields. Cambridge, UK: RSC Publishing. 2013
17. Burton JB, Johnson M, Sato M. et al. Adenovirus-mediated gene expression imaging to directly detect sentinel lymph node metastasis of prostate cancer. Nat Med. 2008;14:882-888
18. Phelps ME. Molecular imaging with positron emission tomography. Annu Rev Nucl Part S. 2002;52:303-338
19. Yao R, Lecomte R, Crawford ES. Small-animal PET: What is it, and why do we need it? J Nucl Med Technol. 2012;40:157-165
20. Zaidi H, Del Guerra A. An outlook on future design of hybrid PET/MRI systems. Med Phys. 2011;38:5667-5689
21. Lovell JF, Jin CS, Huynh E. et al. Porphysome nanovesicles generated by porphyrin bilayers for use as multimodal biophotonic contrast agents. Nat Mater. 2011;10:324-332
22. Agostinis P, Berg K, Cengel KA. et al. Photodynamic therapy of cancer: An update. CA-Cancer J Clin. 2011;61:250-281
23. Dougherty TJ, Grindey GB, Fiel R. et al. Photoradiation Therapy. II. Cure of animal tumors with hematoporphyrin and light. J Natl Cancer I. 1975;55:115-121
24. Tan IB, Dolivet G, Ceruse P. et al. Temoporfin-mediated photodynamic therapy in patients with advanced, incurable head and neck cancer: A multicenter study. Head Neck. 2010;32:1597-1604
25. Sajjad M, Bars E, Nabi HA. Optimization of 124I production via 124Te(p,n)124I reaction. Appl Radiat Isot. 2006;64:965-970
26. Ethirajan M, Chen Y, Joshi P. et al. The role of porphyrin chemistry in tumor imaging and photodynamic therapy. Chem Soc Rev. 2011;40:340-362
27. Ethirajan M, Patel NJ, Pandey RK. Porphyrin-based multifunctional agents for tumor-imaging and photodynamic therapy (PDT) in phototherapy, radioimmunotherapy and imaging. In: (ed.) Kadish KM, Smith KM & Guilard R. Handbook of Porphyrin Science, Vol. 1. Hackensack, New Jersey, USA: World Scientific Publishing. 2010
28. Pandey RK, James NS, Chen Y, Missert J, Sajjad M. Bifunctional agents for imaging and therapy. In: (ed.) Gomer CJ. Photodynamic Therapy, Methods and Protocol. New York: Humana Press. 2010
29. Pandey SK, Gryshuk AL, Sajjad M. et al. Multimodality agents for tumor imaging (PET, fluorescence) and photodynamic therapy. A possible “see and treat” approach. J Med Chem. 2005;48:6286-6295
30. Pandey SK, Sajjad M, Chen Y. et al. Comparative positron-emission tomography (PET) imaging and phototherapeutic potential of 124I-labeled methyl-3-(1′-iodobenzyloxyethyl) pyropheophorbide-a vs. the corresponding glucose- and galactose-conjugates. J Med Chem. 2009;52:445-455
31. Pandey SK, Sajjad M, Chen Y. et al. Compared to purpurinimides, the pyropheophorbide containing an iodobenzyl group showed enhanced PDT efficacy and tumor imaging (124I-PET) ability. Bioconjugate Chem. 2009;20:274-282
32. Srivatsan A, Wang Y, Joshi P. et al. In vitro cellular uptake and dimerization of signal transducer and activator of transcription-3 (STAT3) identify the photosensitizing and imaging-potential of isomeric photosensitizers derived from chlorophyll-a and bacteriochlorophyll-a. J Med Chem. 2011;54:6859-6873
33. Gupta A, Wang S, Pera P. et al. Multifunctional nanoplatforms for fluorescence imaging and photodynamic therapy developed by post-loading photosensitizer and fluorophore to polyacrylamide nanoparticles. Nanomedicine. 2012;8:941-950
Author contact
![]() Corresponding author: Ravindra K. Pandey, Ph. D., PDT Center, Cell Stress Biology, Roswell Park Cancer Institute, Buffalo, NY 14263, Tel: 716-845-3203, Fax: 716-845-8920, Email: Ravindra.pandeyorg.
Corresponding author: Ravindra K. Pandey, Ph. D., PDT Center, Cell Stress Biology, Roswell Park Cancer Institute, Buffalo, NY 14263, Tel: 716-845-3203, Fax: 716-845-8920, Email: Ravindra.pandeyorg.
Citation styles
APA
Gupta, A., Wang, S., Marko, A., Joshi, P., Ethirajan, M., Chen, Y., Yao, R., Sajjad, M., Kopelman, R., Pandey, R.K. (2014). Polyacrylamide-Based Biocompatible Nanoplatform Enhances the Tumor Uptake, PET/fluorescence Imaging and Anticancer Activity of a Chlorophyll Analog. Theranostics, 4(6), 614-628. https://doi.org/10.7150/thno.8478.
ACS
Gupta, A.; Wang, S.; Marko, A.; Joshi, P.; Ethirajan, M.; Chen, Y.; Yao, R.; Sajjad, M.; Kopelman, R.; Pandey, R.K. Polyacrylamide-Based Biocompatible Nanoplatform Enhances the Tumor Uptake, PET/fluorescence Imaging and Anticancer Activity of a Chlorophyll Analog. Theranostics 2014, 4 (6), 614-628. DOI: 10.7150/thno.8478.
NLM
Gupta A, Wang S, Marko A, Joshi P, Ethirajan M, Chen Y, Yao R, Sajjad M, Kopelman R, Pandey RK. Polyacrylamide-Based Biocompatible Nanoplatform Enhances the Tumor Uptake, PET/fluorescence Imaging and Anticancer Activity of a Chlorophyll Analog. Theranostics 2014; 4(6):614-628. doi:10.7150/thno.8478. https://www.thno.org/v04p0614.htm
CSE
Gupta A, Wang S, Marko A, Joshi P, Ethirajan M, Chen Y, Yao R, Sajjad M, Kopelman R, Pandey RK. 2014. Polyacrylamide-Based Biocompatible Nanoplatform Enhances the Tumor Uptake, PET/fluorescence Imaging and Anticancer Activity of a Chlorophyll Analog. Theranostics. 4(6):614-628.
This is an open access article distributed under the terms of the Creative Commons Attribution (CC BY-NC) License. See http://ivyspring.com/terms for full terms and conditions.