Theranostics
13.3
Impact Factor
- Issue 9; 2026
- Issue 8; 2026
- Issue 7; 2026
- Issue 6; 2026
- Issue 5; 2026
- Volume 16; 2026
- Advance Articles
- Past Issues
- Cover Images
- Cover Suggestion
- Special Issues
Top
Introduction
Materials and Methods
Results
Discussion
Supplementary Material
Abbreviations
Acknowledgements
References
Introduction
Materials and Methods
Results
Discussion
Supplementary Material
Abbreviations
Acknowledgements
References
International Journal of Biological Sciences
International Journal of Medical Sciences
 Global reach, higher impact

Theranostics 2014; 4(4):366-385. doi:10.7150/thno.7473 This issue Cite
Research Paper
Evolution- and Structure-Based Computational Strategy Reveals the Impact of Deleterious Missense Mutations on MODY 2 (Maturity-Onset Diabetes of the Young, Type 2)
Doss C. Priya George1 ![]() , Chiranjib Chakraborty2,3, SA Syed Haneef1, Nagarajan NagaSundaram1, Luonan Chen4, Hailong Zhu2
, Chiranjib Chakraborty2,3, SA Syed Haneef1, Nagarajan NagaSundaram1, Luonan Chen4, Hailong Zhu2 ![]()
1. Medical Biotechnology Division, School of Biosciences and Technology, VIT University, Vellore, Tamil Nadu 632014, India
2. Department of Computer Sciences, Hong Kong Baptist University, Kowloon Tong, Hong Kong
3. Department of Bioinformatics, School of Computer and Information sciences, Galgotias University, India
4. Key Laboratory of Systems Biology, Shanghai Institutes of Biological Sciences, Chinese Academy of Sciences, China
Received 2013-8-22; Accepted 2014-1-3; Published 2014-1-29
Citation:
George DCP, Chakraborty C, Haneef SAS, NagaSundaram N, Chen L, Zhu H. Evolution- and Structure-Based Computational Strategy Reveals the Impact of Deleterious Missense Mutations on MODY 2 (Maturity-Onset Diabetes of the Young, Type 2). Theranostics 2014; 4(4):366-385. doi:10.7150/thno.7473. https://www.thno.org/v04p0366.htm
Other stylesAbstract
Heterozygous mutations in the central glycolytic enzyme glucokinase (GCK) can result in an autosomal dominant inherited disease, namely maturity-onset diabetes of the young, type 2 (MODY 2). MODY 2 is characterised by early onset: it usually appears before 25 years of age and presents as a mild form of hyperglycaemia. In recent years, the number of known GCK mutations has markedly increased. As a result, interpreting which mutations cause a disease or confer susceptibility to a disease and characterising these deleterious mutations can be a difficult task in large-scale analyses and may be impossible when using a structural perspective. The laborious and time-consuming nature of the experimental analysis led us to attempt to develop a cost-effective computational pipeline for diabetic research that is based on the fundamentals of protein biophysics and that facilitates our understanding of the relationship between phenotypic effects and evolutionary processes. In this study, we investigate missense mutations in the GCK gene by using a wide array of evolution- and structure-based computational methods, such as SIFT, PolyPhen2, PhD-SNP, SNAP, SNPs&GO, fathmm, and Align GVGD. Based on the computational prediction scores obtained using these methods, three mutations, namely E70K, A188T, and W257R, were identified as highly deleterious on the basis of their effects on protein structure and function. Using the evolutionary conservation predictors Consurf and Scorecons, we further demonstrated that most of the predicted deleterious mutations, including E70K, A188T, and W257R, occur in highly conserved regions of GCK. The effects of the mutations on protein stability were computed using PoPMusic 2.1, I-mutant 3.0, and Dmutant. We also conducted molecular dynamics (MD) simulation analysis through in silico modelling to investigate the conformational differences between the native and the mutant proteins and found that the identified deleterious mutations alter the stability, flexibility, and solvent-accessible surface area of the protein. Furthermore, the functional role of each SNP in GCK was identified and characterised using SNPeffect 4.0, F-SNP, and FASTSNP. We hope that the observed results aid in the identification of disease-associated mutations that affect protein structure and function. Our in silico findings provide a new perspective on the role of GCK mutations in MODY2 from an evolution-based structure-centric point of view. The computational architecture described in this paper can be used to predict the most appropriate disease phenotypes for large-genome sequencing projects and to provide individualised drug therapy for complex diseases such as diabetes.
Keywords: GCK, Diabetes, Missense mutations, Evolutionary analysis, Molecular dynamics
Introduction
The aetiology of various forms of diabetes mellitus is well known, and approximately 347 million people (WHO Report) suffer from diabetes mellitus worldwide. According to the available worldwide health statistics for 2012, 1 in 10 adults are known to be diabetic; moreover, in the Southeast Asia region, highly populated countries, such as India and China, harbour populations that are among the most vulnerable to this disease. The monogenic form of diabetes, maturity-onset diabetes of the young (MODY), is a genetic form of familial diabetes mellitus that can be caused by single gene mutations in one of ten or more genes [1, 2]. Owing to such mutations, defects occur in β -cell function, and these defects ultimately hinder insulin secretion. This condition is also known as “monogenic β-cell disorder” [3]. The disease is inherited in an autosomal dominant manner and has an early onset, typically beginning at less than 25 years of age [4]. Its estimated prevalence is approximately 100 cases per million individuals [5, 6]. To date, eleven forms of MODY, distinguishable by genetic, metabolic, and clinical heterogeneity, have been described. Through molecular genetic studies of diabetes, mutations related to this disorder have been identified in HNF4A, GCK, HNF1A, PDX1, HNF1B, NEUROD1, KLF11, CEL, PAX4, INS, and BLK, which are associated with MODY 1 to 11, respectively [7]. Of the various forms of the disease, MODY 2/Glucokinase and MODY3 are the most frequent, and their prevalence varies between countries.
MODY 2 is associated with heterozygous inactivating mutations in the GCK gene, which maps to chromosome 7 (7p15.3-p15.1) and spans 12 exons. The GCK gene is 45,169 bp in length and encodes glucokinase, a 465-amino-acid protein [8]. The glucokinase enzyme, which is also known as hexokinase D or type 1 hexokinase, plays a vital role in glucose metabolism and is homologous to other members of the hexokinase family (type-I, type-II, and type-III) [9-11]. The GCK enzyme possesses a higher Km for glucose (5 mM vs. 20-130 fM) than do other hexokinases and has other distinctive kinetic properties [12]. GCK has been shown to be localised to pancreatic β-cells and hepatocytes in the liver, where it catalyses a first-order glucose phosphorylation reaction that converts glucose to G6P (glucose 6-phosphate) with Mg-ATP as a second substrate [13]. It is well accepted that GCK acts as a “glucose sensor” for the pancreas [14] and the liver [15] in the maintenance of glucose homoeostasis. To date, three tissue-specific isoforms of GCK have been characterised [16]. An increase in the activity of the enzyme results in hypoglycaemia due to congenital hyperinsulinism (HI, hyperinsulinaemia of infancy). In contrast, decreased GCK activity produces hypoinsulinism and hyperglycaemia [17]. The presence of inactivating GCK mutations in both alleles leads to PNDM (permanent neonatal diabetes mellitus), a severe form of permanent neonatal diabetes [18], whereas an activating mutation in one allele leads to MODY with a mild form of hypoglycaemia [19]. GCK is considered a drug target for the development of potential inhibitors, i.e., GCK activators (GKAs). In 2004, Kamata et al. resolved the crystal structure of GCK and described two distinct conformational forms of the enzyme, an inactive super-open ligand-free form and an active closed form bound to glucose and ATP [20]. GCK consists of two domains, namely a large domain (1-64 aa and 206-439 aa) and a small domain (72-201 aa and 445-465 aa), and three loops (65-71 aa, 202-205 aa, and 440-444 aa) connect these two domains. The two domains are separated by a deep glucose-binding cleft formed by residues E256 and E290 within the large domain, residues T168 and K169 within the small domain, and connecting region I (N204 and D205) [20]. Upon glucose and ATP binding, the GCK protein switches from an inactive conformation to a closed, active conformation, in which the large and small domains are closer together. During this process, a marked rotation of the small domain results in a very large conformational transition of the protein [20]. The α13 and α5 helices within the small domain play important roles in the transition to the active conformation. Glucokinase exists in three structural conformations: closed, open, and 'super open'. At lower glucose levels, the transition of the super-open form to the open and closed forms can be initiated by the induction of glucokinase activators (GKAs), which induce conformational changes that increase the enzyme's glucose-binding affinity [20]. The first GCK mutation was reported in 1992 [21]; to date, 671 mutations associated with MODY have been documented in the Human Gene Mutation Database (HGMD). These include nonsense, missense, and frameshift mutations produced by deletions or insertions [22, 23]. Most activating mutations are located within the allosteric activator site where GKAs bind, whereas inactivating mutations that lead to hyperglycaemia are located throughout the protein [19,24,25]. The elucidation of the crystal structure of GCK has permitted researchers to analyse the impact of disease-associated mutations at the molecular level by predicting structure-function relationships for this protein.
Recent technological advances in and cost-effectiveness of genomic analysis, such as the availability of single nucleotide polymorphism (SNP) allele genotyping arrays and next-generation DNA sequencing, have yielded a significant amount of data describing the relationship between non-synonymous SNPs (nsSNPs) and the diseases associated with them. Although most variations in protein sequence are predicted to have little or no effect on protein function, some nsSNPs are known to be associated with disease. These disease-associated nsSNPs have diverse effects on protein properties and may affect a protein's stability, catalytic activity, and/or interaction with other molecules. Therefore, the identification of disease-associated nsSNPs may help elucidate the molecular mechanisms underlying a given disease and may also aid in the diagnosis and treatment of the disease. The prediction of the phenotypic effect of all of the functional SNPs within a genomic pool remains a major challenge for experimental biologists due to the laborious and time-consuming process involved. To support this effort, a new branch of science, “computational biology,” has emerged: one of the goals of this field is to identify and discriminate functionally deleterious nsSNPs from non-deleterious ones. To date, many automated methods to identify the biological impact of nsSNPs have been developed based on the available information from resolved or modelled protein structures or derived from comparative genomics and phylogenetic studies [26-28]. Some of these methods were developed almost a decade ago. In subsequent years, various computational methods were made available through the World Wide Web, and their performances were compared and well validated through the use of alternative computational prediction algorithms [29-31]. The existing methods were developed and standardised using various datasets. Most of the methods are applicable only to a subset of SNPs, such as nsSNPs that can be mapped onto the protein structure. The ultimate goal of all of these methods is to identify functional and deleterious nsSNPs within a pool that contains neutral SNPs and to support the validation of disease-related nsSNPs through experimental methods. In addition, the significant changes in the macromolecular structures of proteins that occur due to mutations can be elucidated at the nanoscale level with the aid of molecular dynamics (MD). This method enables us to predict how a single amino acid substitution can have a marked effect on protein structure. An atomic-level look at the protein level via MD simulations can assist our understanding of the effects of mutations in a structural context.
In the present study, our goal was to understand the impact of missense mutations in the site-specific, evolutionarily conserved regions of the GCK gene at the structural level. The logic underlying this analysis is the concept that evolutionary information can be used to provide insight into the structural changes in a protein that result from the mutation. It is assumed that disease-causing mutations mostly occur in the highly conserved regions of a protein sequence. The altered biophysical properties of a mutated residue could induce conformational rearrangements, thereby affecting protein structure and stability and ultimately leading to a disease phenotype. Because the assessment of deleterious nsSNPs is primarily based on phylogenetic information (i.e., correlation with residue conservation) and to a certain extent on protein structure and amino acid physicochemical characteristics, our hypothesis was that amino acids within a protein sequence that are conserved across species are more likely to be functionally significant than non-conserved amino acids. Based on this hypothesis, the use of a molecular evolutionary approach may confer a strong advantage for the prediction of which residues are most likely to be mutated in GCK or other disease-related genes and may aid in the prioritisation of the nsSNPs that should be genotyped in future molecular epidemiological studies. To date, sequence- and/or structure-based methods have been employed to predict the potential impact of nsSNPs on protein structure and function [26, 32-42].
The International Diabetes Federation has projected that the number of people living with diabetes will increase from 382 million in 2013 to 592 million by 2035 if no preventive measures are taken. This prediction results in approximately three new cases every 10 seconds or almost 10 million per year [43]. Due to the severity of the disease and its frequency of occurrence, we conducted the first computational evolution- and structure-based prediction analysis, including MD, of mutations in GCK. The ultimate goal of this study was to identify the best possible method for the prioritisation of functional nsSNPs as the candidate cause of MODY that should be further genotyped in future molecular epidemiological studies. We used ten evolution-based computational prediction methods (SIFT [32], PolyPhen2 [33], PhD-SNP [34], PoPMusic 2.1 [35], SNAP [36], SNPs&GO [37], fathmm [38], I-mutant 3.0 [39], Dmutant [40], and Align GVGD [41, 42]) to classify the nsSNPs in the GCK gene as likely or unlikely to have a serious impact on the protein's function. In addition, we estimated the evolutionary conservation rate of each residue in GCK using ConSurf [44] and Scorecons [45]. The molecular effects of the disease-causing SNPs were then explored using SNPeffect 4.0 [46], F-SNP [47], and FASTSNP [48]. A series of statistical parameters (accuracy, precision, sensitivity, specificity, negative predictive value (NPV), and Matthews's correlation coefficient (MCC)) were used to evaluate the uniformity of the prediction scores obtained through the above-mentioned computational methods. To study the impact of deleterious nsSNPs at the structural level, models of the mutant proteins were generated based on the GCK protein crystal structure. The native and mutant proteins were subjected to MD simulation analysis using Gromacs to demonstrate that mutations may change the surface properties of proteins and induce structural changes that can be propagated through space to distort the orientation of the functional site [49]. We propose that the information derived from the evolutionary conservation analysis and the MD analysis may provide explanations for the substantial structural and functional changes in the GCK protein due to deleterious amino acid substitutions. In this work, we demonstrate the power of using state-of-the-art computational methods to unravel the effect of deleterious missense mutations on protein structure (Figure 1).
Figure 1
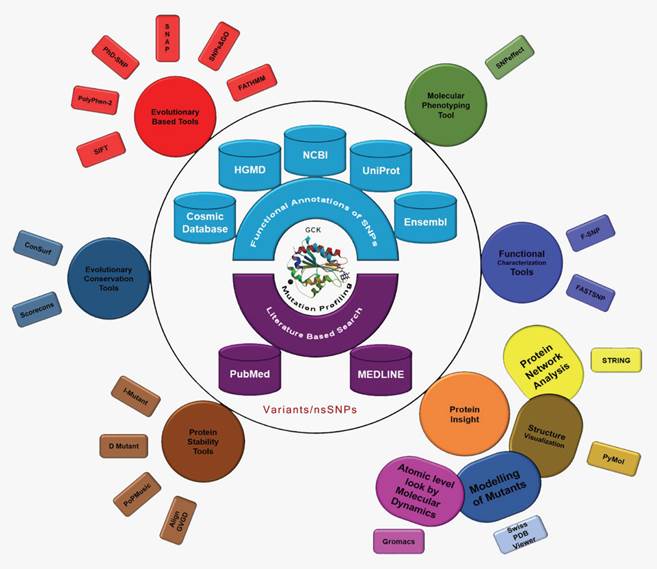
Evolution- and structure-based computational methods reveal the impact of deleterious missense mutations on proteins at both the functional and structural levels.
Materials and Methods
SNP information Retrieval
Information regarding the SNPs in the coding region of the GCK gene was retrieved from the dbSNP [50], UniProt [51], HGMD [52], and OMIM [53] databases. We also retrieved information on the functional annotation of each SNP from the dbSNP database, such as whether it is present in an exon or intron, in the 5' or 3' untranslated region (UTR), or upstream or downstream of the GCK gene. The closed-form structure of GCK (PDB ID: 1V4S [20]) was obtained from the Protein Data Bank (PDB) [54].
Evolution-based in silico studies of GCK
To date, numerous computational methods have been made available through the World Wide Web for predicting the phenotypic effects of nsSNPs. The most widely accepted computational methods based on evolution-based sequence information (SIFT, PhD-SNP, SVMProfile, Align GVGD, and fathmm), as well as a combination of protein structural and/or functional parameters and multiple sequence alignment-derived information (PolyPhen2, SNAP, SNPs&GO and SNPeffect 4.0), were employed in this study. The machine-learning method SNAP utilises neural networks (NN), and PhD-SNP and SNPs&GO utilise support vector machines (SVMs) for classification, whereas the other methods classify variants according to Bayesian methods (PolyPhen2) or mathematical operations (SIFT). The Sorting Intolerant From Tolerant (SIFT) method utilises sequence homology to predict whether an amino acid substitution will affect the protein's function. The prediction score provides an index of the tolerance of the function of a protein to a particular amino acid substitution. SIFT [32] assigns scores ranging from zero to one to each residue. A variant with a score less than 0.05 is considered deleterious, whereas a variant with a score greater than 0.05 is considered tolerated. PolyPhen2 is a Bayesian classifier that predicts the possible impact of amino acid substitutions on protein structure and function using straightforward comparative physical and evolutionary considerations. PolyPhen2 [33] calculates PSIC (Position-Specific Independent Count) scores for each of two variants and computes the difference between the PSIC scores of these variants. A mutation is classified as “most likely damaging” if the probabilistic score is in the range of 0.85 to 1 and as “possibly damaging” if the probabilistic score is in the range of 0.15 to 0.84; the remaining mutations are classified as benign. PhD-SNP [34] is a single-sequence SVM method (SVM-Sequence) that discriminates disease-related mutations based on the local sequence environment of the mutation. This tool aims to predict whether an nsSNP that reflects a single-point mutation is a neutral polymorphism or a disease-associated polymorphism. SNPs&GO [37] is a method based on SVMs that predicts disease-associated mutations from protein sequence, evolutionary information, and functions encoded in gene ontology terms. In this method, a probability score greater than 0.5 predicts that the mutation will have a disease-related effect on the parent protein function. The SNAP (screening for non-acceptable polymorphisms) method is based on neural networks and utilises an advanced machine-learning approach to predict the functional effects of nsSNPs in proteins [36]. It utilises sequence information and structural features, such as secondary structure, solvent accessibility, and residue conservation within sequence families, to determine whether amino acid changes in a protein confer a gain or a loss in protein function. SNAP predicts whether the mutation is neutral or non-neutral with the required accuracy.
Biophysical characterisation
Align-GVGD [41, 42] provides a class probability based on evolutionary conservation and the chemical natures of amino acid residues to predict whether a mutation is deleterious or neutral. This method compares the chemical and physical characteristics obtained by exchanging residues with the frequencies of substitution. The relevant output is the “C-score,” which provides seven discrete grades ranging from C0 to C65, which indicate the mutations that are least likely to be neutral (class 65) to those that are the most likely to be neutral (class 0) in terms of the function of the protein. Functional Analysis Through Hidden Markov Models (fathmm) is a species-independent method with optional species-specific weights for the prediction of the functional effects of protein missense variants [38]. Fathmm combines sequence conservation within hidden Markov models (HMMs), which represent the alignment of homologous sequences and conserved protein domains, with "pathogenicity weights", which represent the tolerance of the corresponding model to mutations. SNPeffect 4.0 [46] integrates aggregation prediction (TANGO), amyloid prediction (WALTZ), chaperone-binding prediction (LIMBO), and protein stability analysis (FoldX) for structural phenotyping. Mutations are classified as mutations that increase (dTANGO>50), decrease (dTANGO< -50), or do not affect (dTANGO between -50 and 50) the propensity of the protein to aggregate and as mutations that increase (dWALTZ>50), decrease (dWALTZ< -50), or do not affect (dWALTZ between-50 and 50) the amyloid propensity of the protein.
Prediction of protein stability upon mutation
In general, the stability of a protein is represented by the change in its Gibbs free energy upon folding; a more negative Gibbs free energy indicates greater stability. A single amino acid substitution in a protein sequence can result in a significant change in the protein's stability (ΔΔG); a positive ΔΔG represents a destabilising mutation, and a negative value represents a stabilising mutation. In this study, we employed three stability predictors, namely PoPMusic 2.1, I-mutant 3.0, and Dmutant [35, 39, 40]. The PoPMusic 2.1 program is a tool for the computer-aided design of mutant proteins with controlled stability properties. It predicts the thermodynamic stability change produced by single-site mutations in proteins using a combination of statistical methods. I-mutant 3.0 was built based on unsupervised classification using support vector machines and trained with the most comprehensive dataset derived from ProTherm [55] for the prediction of the protein stability changes caused by nsSNPs. This method calculates the energy difference between native and variant proteins based on Gibbs free energy values, and the predicted free energy change is denoted by the DDG value. I Mutant 3.0 classify predictions into three classes: neutral mutations (-0.5≤ Kcal/mol), mutations that produce a large decrease in Gibbs free energy (-0.5<kcal/mol), and mutations that produce a large increase (0.5>kcal/mol). Dmutant [39] uses a statistical potential approach with a distance-dependent, residue-specific, all-atom, and knowledge-based potential to predict mutation-induced changes in folding stability. New reference-state, distance-scaled, finite ideal-gas reference (DFIRE) is utilised to predict stabilising and de-stabilising mutations.
Evolutionary conservation analysis
The importance of a given residue in maintaining the structure of a protein can usually be inferred from the degree of conservation of the residue in a multiple sequence alignment of the protein and its homologues. The conservation pattern of a protein can be calculated by ConSurf [44], which quantifies the degree of conservation at each aligned position. This program provides evolutionary conservation profiles of protein or nucleic acid sequences and structures by first identifying the conserved positions using MSA and then calculating the evolutionary conservation rate using an empirical Bayesian inference. ConSurf scores range from 1 to 9: 1 denotes rapidly evolving (variable) sites, 5 denotes sites that are evolving at an average rate, and 9 denotes slowly evolving (evolutionarily conserved) sites. Scorecons [45] is a suite that measures and quantifies residue conservation in a multiple sequence alignment.
Functional characterisation of SNPs
The F-SNP [47] database aims to provide a comprehensive collection of functional information on SNPs related to splicing, transcription, translation, and post-translation modifications from 16 bioinformatics tools and databases. F-SNP provides comprehensive, quantitative information regarding the functional significance (FS) of each SNP by measuring the potential deleterious effects of the SNP on the biomolecular function of the genomic region in which it is found. The F-SNP-Score (FS Score) system combines assessments from multiple independent computational tools using a probabilistic framework that takes into account the certainty of each prediction as well as the reliability of the different tools. In the new integrative scoring system used in this method, the F-SNP-Score for neutral SNPs is 0.1764, whereas the median F-SNP-Score for disease-related SNPs is in the range of 0.5 to 1. FASTSNP [48] (Function Analysis and Selection Tool for Single Nucleotide Polymorphisms) was used to predict the potential functional effect of SNPs in the 5' UTR, 3' UTR, and intronic regions of a gene. FASTSNP employs a complete decision tree to assign risk rankings for SNP prioritisation. The decision tree assigns these risks based on rankings of 0, 1, 2, 3, 4, and 5, which signify no, low, medium, high, and very high effects, respectively.
Statistical analysis
The prediction accuracies of the nine computational methods (SIFT, PolyPhen2, PhD-SNP, SNPs&GO, SNAP, PoPMusic 2.1, fathmm, I mutant 3.0, and D Mutant) were validated using six statistical parameters: namely accuracy, precision, sensitivity, specificity, NPV, and MCC. We defined disease-associated nsSNPs as 'positive' and neutral nsSNPs as 'negative'. True positives (tp), true negatives (tn), false positives (fp), and false negatives (fn) were calculated. An MCC value of one defines the best possible prediction, whereas an MCC of -1 indicates the worst possible prediction, and an MCC equal to 0 indicates that the prediction is the result of chance. To permit the correlation of the quality parameters found for different programs with different sizes of the test datasets containing different numbers of positive and negative cases, the numbers of negative cases were normalised to the number of positive cases used with each program.
Primary sequence analysis
The primary sequence of a protein provides the most direct and readily available information regarding possible functional mutation sites; such information can be extracted from the amino acid sequence in cases where no structural information is available. To investigate the amino acid conservation pattern of human GCK proteins, we performed MSA using MUSCLE (Multiple Sequence Comparison by Log-Expectation), a web-based tool that can be used to align multiple sequences from several vertebrate species, including humans [56]. We searched the protein sequence against a sequence database to find sequences of homologous proteins. The sequence logo analysis was performed using WebLogo [57]. This program provides a graphical representation of amino acids, displaying the patterns in a set of aligned sequences. The overall height of the stack indicates the functional conservation and amino acid composition at that position.
Molecular dynamics simulation
Potential energy minimisation and MD simulation analysis were performed using the GROMACS 4.5.3 software [49]. The GROMOS96 43a1 [58] force field was used in all MD simulations. The energy-minimised structure of the native protein and three mutant complexes were used as the starting points for the MD simulations. These protein complexes were solvated in a cubic 0.9 nm of SPC [59] water molecules. A periodic boundary condition was applied such that the number of particles, the pressure, and the temperature remained constant throughout the simulation period. The simulation setup was neutralised by the addition of chlorine ions to the system; this can be achieved by adding Cl- ion to both the native and the mutant topology files and results in the replacement of random water molecules with chlorine ions to obtain a neutralised simulation setup. The standard temperature was maintained by applying the Berendsen algorithm [60] with a coupling time of 0.2. All protein-protein complex atoms were placed at an equal distance of 1 nm from the cubic box edges. The minimised simulation setup was then equilibrated for 10000 ps at 300 K through the position-restrained MD simulation method to soak the macromolecules into the water molecules. The equilibrated simulation setup was then subjected to MD simulation for 40 ns. During the course of the simulation, the temperature was maintained constant at 300 K. To treat long-range coulombic interactions, the particle mesh Ewald method [61] was used, and the simulations were performed using the SANDER method [62]. The SHAKE algorithm [63] was utilised to measure the bond lengths between hydrogen atoms, and a time step of 2 fs was allowed. The coulomb interactions were truncated at 0.9 nm, and the Van der Waals force was maintained constant at 1.4 nm.
Analysis of trajectory files
The trajectory files generated by MD simulations were analysed using the GROMACS basic utilities g_rmsd and g_rmsf to obtain the root-mean-square deviation (RMSD) and root-mean square fluctuation (RMSF) values. The total number of hydrogen bonds formed between proteins during the simulation was calculated using the g_hbond utility. The number of hydrogen bonds was determined based on a donor-hydrogen-acceptor angle greater than 90 nm and a donor-acceptor distance lesser than 3.9 nm [64]. The distances between proteins were calculated using g_dist. Furthermore, the solvent-accessible surface area was calculated using the g_sas utility. To generate the three-dimensional backbone of the protein, the RMSD, RMSF, hydrogen bonding, distance between two proteins, and solvent-accessible surface area (SASA) analysis were plotted for all four simulations using the Graphing, Advanced Computation, and Exploration (GRACE) program.
Results
Prediction of deleterious nsSNPs
In our data search, we cross-examined the variant information available in dbSNP and UniProt, removed invalid variants based on the incorrect sequence and alignment, and removed or merged the data with other nsSNPs in dbSNP. As a result, a total of 450 nsSNPs in our dataset of the human GCK gene were considered for further analysis. The NCBI GI number OR RefSeq ID, wild-type protein FASTA sequences, and the wild-type and new residues after mutation (single-letter amino acid code) were submitted as the inputs to the nine different computational methods. Figure 2 shows the distribution of the predicted deleterious and neutral nsSNPs in the human GCK gene. SIFT, PolyPhen2, PhD-SNP, SNAP, SNPs&GO, and fathmm predicted that 356 (79%), 398 (88%), 372 (83%), 293 (65%), 450 (100%), and 450 (100%) of these nsSNPs, respectively, were deleterious. In contrast, SIFT, PolyPhen2, PhD-SNP, and SNAP predicted that 94 (21%), 52 (12%), 78 (17%), and 157 (35%) of these nsSNPs, respectively, were neutral (Supplementary Material: Table S1). There was a significant similarity in the distribution of deleterious nsSNPs in the GCK gene obtained with SNPs&GO and fathmm. Of the nsSNPs that occurred at strongly conserved residues, 112 (25%) had a GD of at least 65 (Supplementary Material: Table S2). These were classified as the class (C65) of substitutions most likely to interfere with function. The remaining SNPs were classified as class 0 (45%), class 15 (14%), class 25 (3%), class 35 (5%), class 45 (2%), and class 55 (5%). A total of 327 nsSNPs were identified as deleterious by the nine disease pathogenicity prediction methods (highlighted in bold in Supplementary Material: Table S1). These predicted nsSNPs may alter both the structure and the function of the protein and may play a significant role in the causation of disease.
Figure 2
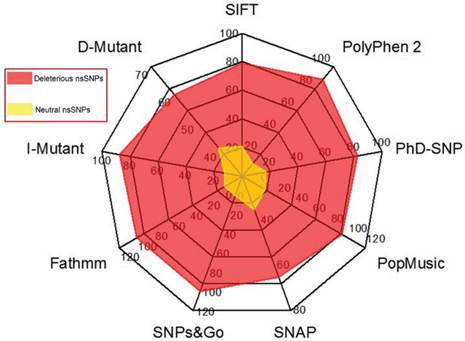
Distribution of predicted deleterious and neutral nsSNPs in the GCK gene. The colour codes are described in the radar chart.
Prediction of stability changes
Predicting the stability of a protein upon mutation is necessary for understanding the structure- function relationship of the protein. All 450 of the nsSNPs submitted to the pathogenic prediction tools were also subjected to protein stability analysis using tools such as I-mutant 3.0, PoPMusic 2.1, and D mutant. The results from I-mutant 3.0 indicate that 394 nsSNPs (88%) with negative DDG values are less stable and deleterious. In contrast, the results from Dmutant predicted that 264 nsSNPs (60%) of the GCK gene affect the stability of the protein, and the remaining 178 nsSNPs (43%) were identified as stabilising mutations. The PoPMusic 2.1 scores can be used to classify mutations as deleterious (positive values) and non-deleterious (negative values). A total of 416 nsSNPs (94%) were found to be deleterious, and the remaining 27 nsSNPs (6%) were non-deleterious (Supplementary Material: Table S1).
Molecular phenotype analysis
SNPeffect4.0 aids in the molecular characterisation of disease through the identification of deleterious polymorphic variants of human disease-related proteins. This software classifies SNPs based on changes in aggregation, amyloidogenicity, chaperone binding sites and structural stability changes and thereby permits the determination of whether a given mutation will affect the structure of the protein. SNPeffect 4.0 was used to predict the intrinsic aggregation and amyloid-prone regions in GCK using TANGO and WALTZ. Of 450 nsSNPs, 332 (74%) were found to be associated with one or more of these changes. The results of this determination are presented in Supplementary Material: Table S3. Notably, three nsSNPs, P59L, T149I, and S212F, were found by TANGO and WALTZ to be associated with an increased tendency of the GCK protein to aggregate. As shown in Table 1, the second stretch of the sequence showed a significant increase in aggregation tendency: the TANGO score of the native protein was 12.43, whereas the TANGO scores of the P59L, T149I, and S212F mutants were 11.22, 32.64, and 30.43, respectively. Supplementary Material: Figure S1 depicts the per-residue TANGO aggregation scores of native GCK and the three mutant GCK proteins.
Table 1
Predicted TANGO regions in the native and mutant proteins of GCK.
| Protein | Start | End | Stretch | Score |
|---|---|---|---|---|
| Native | 303 | 311 | LVLLRLVD | 8.99 |
| 449 | 455 | ALVSAV | 12.43 | |
| P59L | 56 | 62 | MLLTYV | 11.22 |
| T149I | 145 | 151 | LGFIFS | 32.64 |
| S212F | 205 | 215 | TVATMIFCYY | 30.43 |
Functional characterisation of SNPs
The functional SNPs in the regulatory region of the GCK gene were analysed and scored, and their known effects were characterised according to the location of each SNP (splice site, ESE, TFBS, and coding region) using FASTSNP and F-SNP. FASTSNP classifies and prioritises the phenotypic risk and deleterious effects associated with each SNP found in coding and non-coding regions based on the influence of individual SNPs on 3D structure, pre-mRNA splicing, levels of transcription of the sequence, premature translation termination, transcription factor binding at the promoter, and other parameters. The FASTSNP results predicted that three SNPs in the intronic region of the GCK gene have possible functional impact on the splicing site region with a risk ranking of 3-4. One SNP in the 3' UTR region was predicted have functional significance for splicing regulation with a risk ranking of 2-3. Eleven SNPs in the 5' upstream region were predicted to have functional significance in the promoter/regulatory region with a risk ranking of 1-3 (Table 2). To locate and predict each SNP within TFBS and to identify exonic splicing enhancers, tools such as TFSearch, Consite, ESEfinder, ESRSearch, and PESX were utilised by F-SNP. Each SNP was assigned an 'S' score ranging from 0.05 to 1 (Supplementary Material: Table S4). In the GCK gene, 92 SNPs located in the intronic region were associated with the functional category of transcriptional regulation, three SNPs located in the 5PRIME_UTR region were associated with the functional category of splicing regulation, three SNPs located in the 3PRIME_UTR region were associated with the functional category of transcriptional regulation, and four SNPs located in the UPSTREAM region were categorised as involved in transcriptional regulation. The function of one SNP located in the SPLICE_SITE region was categorised as splicing regulation. In total, nine SNPs in the intronic region of the GCK gene, namely rs2908274, rs2908274, rs887688, rs2971680, rs887687, rs887686, rs2010825, rs2268575, rs2268573, and rs13306387, were predicted to be functional by FASTSNP and F-SNP.
Concordance between the functional consequences of each SNP
To increase the prediction accuracy of the computational methods utilised in this study, we calculated the concordance of each prediction using three different combinations: (i) concordance between the evolution-based sequence methods SIFT, fathmm, and PhD-SNP; (ii) concordance between the evolution-based structure methods PolyPhen2, SNAP, SNPs&GO, and PoPMusic 2.1; and (iii) concordance between the evolutionary sequence and structure-based methods I-mutant 3.0 with D Mutant, Align-GVGD, and SNPeffect 4.0. The concordances between these combinations are shown in Figure 3. Lower prediction scores obtained with SIFT and I-mutant 3.0 classify an nsSNP as deleterious, whereas a higher PolyPhen2 score classifies an SNP as deleterious. Of 450 SNPs in GCK, 79%, 88%, 83%, 100%, 65%, 94%, 100%, 88%, 60%, 25%, and 74% were uniquely found to be deleterious by SIFT, PolyPhen2, PhD-SNP, SNPs&GO, SNAP, PoPMusic 2.1, fathmm, I mutant 3.0, D Mutant, Align-GVGD, and SNPeffect 4.0, respectively, and 7% of the SNPs were predicted to be functionally significant by all eleven tools. In combination, the evolution-based methods SIFT and fathmm predicted that 89% of the SNPs are functionally significant; in contrast, the combination of fathmm and PhD-SNP, the combination of SIFT and PhD-SNP, and the combination of SIFT, fathmm, and PhD-SNP predicted that 91%, 80%, and 65% of the SNPs, respectively, are functionally significant. The structure-based methods PolyPhen2 and SNAP in combination predicted 76% of the SNPs to be functionally significant, whereas the combination of PolyPhen2 and SNPs&GO, the combination of PolyPhen2 and PoPMusic 2.1, the combination of SNAP and SNPs&GO , the combination of SNAP and PoPMusic 2.1, the combination of SNPs&GO and PoPMusic 2.1, and the combination of PolyPhen2, SNPs&GO, SNAP, and PoPMusic 2.1 predicted 94%, 90%, 82%, 78%, 96%, and 86% of the SNPs to be functionally significant. In combination, I Mutant 3.0 and Dmutant predicted that 73% of the nsSNPs are deleterious. Align-GVGD and SNPeffect 4.0 predicted 24% and 73% of the SNPs to be deleterious, respectively.
Table 2
Characterization of functional SNPs in GCK gene by FASTSNP
| IDs | Possible Functional Effects | Risk Level | Region |
|---|---|---|---|
| rs2908274 | Splicing site | Medium-High (3-4) | Intronic |
| rs35548117 | Splicing regulation | Low-Medium (2-3) | 3UTR |
| rs2971680 | Promoter/regulatory region | Very Low-Medium (1-3) | 5upstream |
| rs887687 | Promoter/regulatory region | Very Low-Medium (1-3) | 5upstream |
| rs887686 | Promoter/regulatory region | Very Low-Medium (1-3) | 5upstream |
| rs2010825 | Promoter/regulatory region | Very Low-Medium (1-3) | 5upstream |
| rs73112256 | Promoter/regulatory region | Very Low-Medium (1-3) | 5upstream |
| rs2268575 | Promoter/regulatory region | Very Low-Medium (1-3) | 5upstream |
| rs35606092 | Promoter/regulatory region | Very Low-Medium (1-3) | 5upstream |
| rs35786405 | Promoter/regulatory region | Very Low-Medium (1-3) | 5upstream |
| rs35907141 | Promoter/regulatory region | Very Low-Medium (1-3) | 5upstream |
| rs2268573 | Promoter/regulatory region | Very Low-Medium (1-3) | 5upstream |
| rs17172591 | Promoter/regulatory region | Very Low-Medium (1-3) | 5UTR |
| rs13306387 | Intronic enhancer | Very Low-Low (1-2) | Intronic |
| rs887688 | Intronic enhancer | Very Low-Low (1-2) | Intronic |
Figure 3
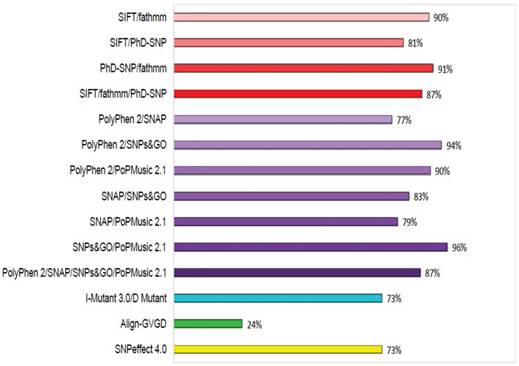
Concordance between the computational methods. Functional consequences of each SNP based on the evolution-based methods SIFT, fathmm, and PhD-SNP, the structure-based methods PolyPhen2, SNAP, SNPs&GO, PoPMusic 2.1, and I-Mutant 3.0, Dmutant, Align-GVGD, and SNPeffect 4.0.
Ranking scheme
We adopted a ranking system to classify the nsSNPs associated with GCK based on the scores obtained from SIFT, PolyPhen2, PhD-SNP, SNAP, SNPs&GO, fathmm, and I-Mutant 3.0. PoPMusic 2.1 and Dmutant were not able to predict the scores for few nsSNPs (Supplementary Material: Table S1). After combining the scores obtained using these seven tools, we assigned each nsSNP a ranking from 1 to 4 and designated it as pathogenic (if seven to six tools predicted that it was pathogenic), most likely pathogenic (if five to four of the seven tools predicted pathogenicity), possibly pathogenic (if three to two of the seven tools predicted pathogenicity), and most likely benign (if zero to one tool predicted pathogenicity) (Supplementary Material: Table S1).
Statistical analysis of the performance of in silico prediction methods
To evaluate the performance of the tools used to predict deleterious nsSNPs, we used six statistical measures: accuracy, precision, specificity, sensitivity, negative predictive value (NPV), and Matthews correlation coefficient (MCC). The test dataset of experimentally determined pathogenic nsSNPs of the GCK gene was obtained from the Swiss-Prot database and the literature. Based on the predictions made by the computational methods, the test dataset was evaluated to obtain tp (true positive), tn (true negative), fp (false positive), and fn (false negative) values in order to calculate the statistics measures (Table 3). Of the nine computational methods, SNPs&GO (0.891) and fathmm (0.891) performed best in terms of accuracy, PolyPhen2 (0.907) and SNAP (0.907) performed best in terms of precision, SNPs&GO (1) and fathmm (1) performed best in terms of sensitivity, SNAP performed best in terms of specificity (0.448), and PolyPhen2 performed best in terms of NVP (0.23) and MCC (0.14). In contrast, SNAP performed worst in terms of accuracy (0.64), I Mutant 3.0 performed worst in terms of precision (0.88), D Mutant performed worst in terms of sensitivity (0.59), and SNPs&Go and fathmm performed worst in terms of specificity (0), NVP (0), and MCC (0). PolyPhen2 yielded significantly higher values for MCC than did the other tools used in this study. Overall, it is evident from our statistical analysis that PolyPhen2 outperformed the other computational methods in the prediction of deleterious and functional nsSNPs in the GCK gene.
GCK protein sequence conservation analysis
A comparative analysis of amino acid conservation between species based on protein sequence alignment provides an understanding of the importance of individual amino acid residues within a protein and reveals localised evolution. The homologous protein sequences utilised in the MUSCLE analysis of the GCK protein are shown in Supplementary Material: Table S5. The aligned sequences from MUSCLE (Supplementary Material: Figure S2) were submitted to WebLogo to demonstrate the patterns of sequence alignment. The WebLogo pattern (Supplementary Material: Figure S3) of the GCK protein displays the sequence logos of up to 140 sequences. Importantly, the information from the sequence logo of the GCK protein indicates that GCK sequences are highly conserved in different species. Similarly, an analysis using the Bayesian analyser ConSurf indicates that most of the amino acids in the GCK protein are highly conserved (Figure 4). In general, the substitution of conserved residues is deleterious. Consistent with this generalisation, the majority of the substituted amino acids in GCK were predicted to be deleterious in nature by all of the computational prediction methods.
Table 3
Statistical evaluation of various computational methods
| Condition | SIFT | PolyPhen 2 | PhD-SNP | PopMusic 2.1 | SNAP | SNPs & GO | fathmm | I Mutant | Dmutant | |
|---|---|---|---|---|---|---|---|---|---|---|
| True Positive | 321 | 361 | 336 | 372 | 266 | 401 | 401 | 347 | 233 | |
| True Negative | 14 | 12 | 13 | 4 | 22 | 0 | 0 | 2 | 17 | |
| False Positive | 35 | 37 | 36 | 44 | 27 | 49 | 49 | 47 | 31 | |
| False Negative | 80 | 40 | 65 | 23 | 135 | 0 | 0 | 54 | 161 | |
| Total | 450 | 450 | 450 | 443 | 450 | 450 | 450 | 450 | 442 | |
| Remarks | - | - | - | 7 NA | - | - | - | - | 8 NA | |
| Accuracy | 0.744 | 0.828 | 0.775 | 0.848 | 0.64 | 0.891 | 0.891 | 0.775 | 0.565 | |
| Precision | 0.901 | 0.907 | 0.903 | 0.894 | 0.907 | 0.891 | 0.891 | 0.88 | 0.882 | |
| Sensitivity | 0.8 | 0.9 | 0.83 | 0.94 | 0.66 | 1 | 1 | 0.86 | 0.59 | |
| Specificity | 0.285 | 0.324 | 0.265 | 0.083 | 0.448 | 0 | 0 | 0.04 | 0.354 | |
| NVP | 0.148 | 0.23 | 0.16 | 0.14 | 0.14 | 0 | 0 | 0.03 | 0.09 | |
| MCC | 0.06 | 0.14 | 0.08 | 0.03 | 0.07 | 0 | 0 | 0.08 | 0.03 |
NA-Not available
Figure 4
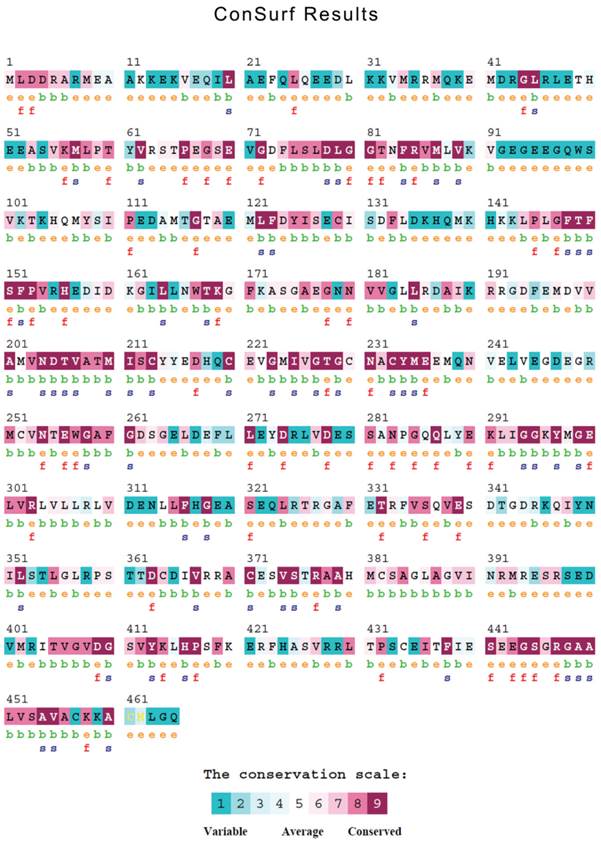
Conservation analysis of the GCK protein sequence from 1 to 465 aa using ConSurf. The amino acids are coloured based on their conservation grades and conservation levels. A grade of 1 indicates rapidly evolving (variable) sites, which are colour-coded in turquoise; 5 indicates sites that are evolving at an average rate, which are coloured white; and 9 indicates slowly evolving (evolutionarily conserved) sites, which are colour-coded in maroon.
Amino acid composition of native and mutated proteins
To measure the effects of deleterious amino acid substitutions on the GCK protein, we determined the amino acid composition of the protein in both its native and mutated states using Statistical Analysis of Protein Sequences [65]. Supplementary Material: Figure S4 shows the amino acid composition of the native GCK protein, which contains 465 amino acid residues. Of these, the occurrence of leucine was found to be highest, followed by lysine, glutamic acid, glycine, and valine. Supplementary Material: Figure S5 compares the distribution of the amino acid composition in the mutant GCK proteins. The mutant proteins showed a higher relative composition of glycine and proline, followed by arginine and valine. Leu→Pro, Glu→Lys, Gly→Asp, Gly→Arg, Gly→Ser, Ala→Thr, Ala→Val, Met→Thr, Val→Met, and Gly→Val were the most frequent substitutions in GCK. Of these substitutions, Leu to Pro was the most frequent, and 12 of the 16 Leu to Pro substitutions were recorded as pathogenic by all of the prediction methods used. In addition, the formation of disulphide bonds in the GCK protein was calculated using SCRATCH Protein Predictor [66]. Eight of the Cys residues in GCK (those at positions 213, 220, 233, 252, 364, 371, 457, and 461) were found to be involved in disulphide bond formation. The bonds occurred between Cys 213 and Cys 220, Cys 364 and Cys 371, Cys 233 and Cys 252, and Cys 457 and 461. Mutations at many of these positions (namely C129F, C129Y, C213R, C213Y, C220Y, C233R, C252Y, C371F, C371R, C371W, C371Y, C382G, and C457W) were predicted to be markedly deleterious by SIFT, PolyPhen2, PhD-SNP, SNAP, SNPs&GO, fathmm, and I-mutant 3.0.
Impact of mutations on the local environment
The definition of the local environment in the context of hydrogen bonds and solvent accessibility can portray distinct patterns of amino acid substitutions. Figure 5 illustrates the positions of mutants Gln 70, Ala 188, and Trp 257 in the GCK protein with PDB ID: 1V4S. We used the HOPE server [67] to analyse the size, charge, and hydrophobicity values of the native and mutant amino acids in the E70K, A188T, and W257R mutants of the protein. E70K (glutamate) is a highly conserved residue located in one of the connecting loops. The change in size and charge between the glutamate and the mutant lysine residue disrupts the hydrogen bond formed by the original wild-type residue and also disturbs the interaction of this region with other molecules and other parts of the protein. Thus, this mutation may result in a slight modification of enzyme activity and/or stability. The A188T mutation, in which a highly conserved, hydrophobic, small alanine residue is replaced by a large, less hydrophobic, polar residue tyrosine, can result in the loss of hydrophobic interactions in the core of the protein. In the 3D structure, the wild-type residue is located in the α4 helix of the small domain. The mutation converts the wild-type residue to a residue that does not prefer α-helices as its secondary structure. The formation of hydrogen bonds at the hydroxyl group of the mutant residue can disturb the core structure of this important domain and thereby affect the catalytic activity of the protein. W257R-Trp257 is a highly conserved residue located in the α-helix of the large domain. The substitution of the more hydrophobic residue tryptophan by the less hydrophobic arginine will cause the loss of hydrophobic interactions in the core of the protein, and the change in the size of this residue from large to small will result in empty space in the core of the protein. In addition, the change in the charge of a buried residue from neutral to positive can lead to protein folding problems.
Figure 5
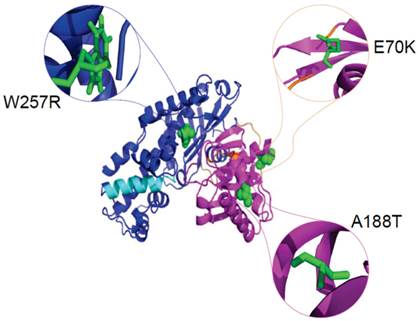
Cartoon structure of the GCK protein with PDB ID 1V4S. The structure was visualised using PyMol. The large domains (1-64 and 206-439) are shown in blue, the small domains (72-201 and 445-465) are shown in magenta, and the connecting loops, which extend from residues 65-71, 202-205, and 440-444, are shown in orange. The α13 helix, which elongates from residue 295-311, is shown in cyan colour. The native amino acids glutamate at position 70 (green colour), alanine at position 188 (green colour), and tryptophan at position 257 (green colour) are represented as spheres in the close version and as sticks in the zoomed-in version.
We calculated the surrounding residues and local environments of the native and mutant amino acid residues in GCK within the range of 4 Å using PyMol [68]. The substitution of lysine for glutamate at the 70th position introduces two new residues, Cys457 and Cys461, in the local environment, and the substitution of alanine by tyrosine at position 188 places residue Glu120 within the range of 4 Å (Supplementary Material: Figure S6, S7). The substitution of tryptophan by arginine at position 257 leads to the loss of four contacts, namely Val 389, Leu386, Gly385, and Cys382, in the native protein and the gain of two contacts with Val226 and Ile225 (Supplementary Material: Figure S8). The scores, amino acid properties, protein stability, and local environment predictions obtained through computational methods and modelling studies provide clues regarding the possible effects of disease-causing mutations on protein structure. However, it is intriguing to consider how residue changes in sites other than functionally important regions in the GCK protein can result in changes in protein structure that have deleterious effects on protein function. Lastly, we used MD simulations to investigate to what extent the E70K, A188T, and W257R mutations affect protein structure and thereby lead to functionally disruptive effects and conformational changes in the mutant protein structure with respect to its native conformation.
Molecular dynamics: conformational flexibility and stability analysis
Molecular dynamics simulation approaches pave the way for an in-depth analysis of the effects of mutations on protein structure. Based on this principle, various substitutions, such as E70K, A188T, and W257R, were investigated using 40-ns MD simulation trajectories. The overall protein stability changes upon mutation were evaluated through Root Mean Square Deviations (RMSD) values. We calculated the backbone RMSD for all of the systems from the average simulated structure and considered the calculated value as a primary criterion for measuring the convergence of the system. The backbone RMSD was calculated for both the native and the mutant structures of the GCK protein (Figure 6). We observed a substantial structural deviation in the structures of the E70K, A188T, and W257R mutants compared with the native GCK protein. The values for the native and mutant proteins showed a standard deviation range of ~0.2 to ~0.3 nm throughout the 40-ns simulation period. All four systems reached equilibrium states after 20 ns of simulation. The structures of the A188T and W257R mutants presented lower RMSD values in the equilibration period compared with the native structure, whereas the structure of the E70K mutant attained a high deviation. Both the native and mutant structures reached more converged states during the simulation period of ~20 to ~40 ns. Hence, all further analyses were performed using the more equilibrated states (~30 to ~40 ns) of the native and mutant structures. Although the mutant proteins exhibited little deviation in the RMSD from the native protein, the minor deviation in the RMSD reflects a protein stability change and shows the impact of the substitution of amino acids in the GCK protein.
Figure 6
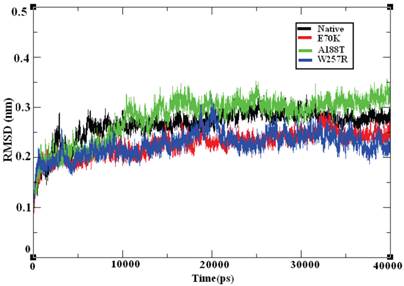
Backbone RMSD of the native and mutant structures of the GCK protein. The ordinate is RMSD (nm), and the abscissa is time (ps). The black, red, green, and blue lines indicate the native, E70K, A188T, and W257R mutant structures, respectively.
MD provides valuable information on long-range and correlated motions and permits thermal fluctuations and long period motions to be distinguished [69]. To evaluate the structural flexibility of wild-type and mutant GCK, we calculated the Root Mean Square Fluctuations (RMSFs) from the last 10 ns of the simulation trajectory files. The RMSF values of the native and mutant structures are shown in Figure 7. The native GCK protein showed fluctuation in the range of ~0.05 to ~0.27 nm, whereas the E70K mutant showed fluctuation in the range of ~0.05 to ~0.3 nm. Almost all of the residues in the mutant protein exhibited the same fluctuation as those of the native protein structure, but changes in the fluctuations were observed for residues ~80, ~125, ~250-300, and ~400-440. The A188T and W257R mutant proteins showed higher fluctuation ranges of ~0.05 to ~0.35 nm and ~0.05 to ~0.3 nm, respectively, compared with the native structure. In the A188T mutant structure, notable changes in fluctuation were observed for residues ~30-40, ~80, ~140-160, ~250-350, and ~446, whereas the mutant structure W257R revealed changes in fluctuation for residues ~40-200, ~250-350, and ~400-446. The RMSFs of all the mutant structures notably deviated from the native structure in the overall proportions of different residues. These changes in the RMSFs indicate the mode of the flexibility changes in the mutant complexes and also reflect the impact of the substituted deleterious missense mutations on the GCK protein.
Figure 7
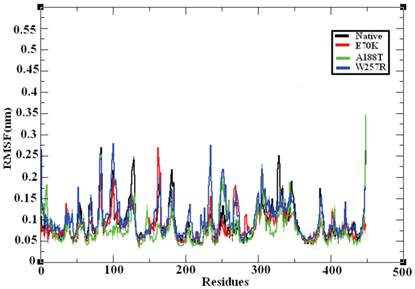
Central alpha-carbon RMSF of the native and mutant models of the GCK protein. The ordinate is RMSF (nm), and the abscissa is residues. The black, red, green, and blue lines indicate the native, E70K, A188T, and W257R mutant structures, respectively.
Hydrogen bonding and salt bridge analysis in native and mutant GCK proteins
Hydrogen bonds are the most significant weak interactions observed in chemistry and biology [70]. A hydrogen bond occurs when a hydrogen atom covalently bound to a molecule interacts with an electronegative atom on the same molecule or on a different molecule. Because these bonds are responsible for maintaining the stability of a protein structure, the determination of the location of hydrogen bonds provides significant information on the stability of a protein [71]. Therefore, the examination of the number of hydrogen bonds in native and mutant GCK proteins is essential to understanding the stability between the residues in these proteins. Figure 8 depicts the number of hydrogen bonds formed in the GCK protein in its native state and in several mutants. The native GCK protein exhibits an average of ~350 to ~400 hydrogen bonds throughout the last 10 ns of the simulation period. The average maximum number of hydrogen bonds formed in the structures of the E70K, A188T, and W257R mutants were calculated to be ~340 to ~400, ~350 to ~400, and ~350 to ~390, respectively, in the last 10 ns of the simulation period. Notably, the number of hydrogen bonds in the three mutant proteins varied compared with the number of hydrogen bonds in the native protein. The change in the number of hydrogen bonds in the mutant proteins reflects the impact of deleterious amino acid substitutions and their ability to destroy hydrogen bond formation in the GCK protein.
Figure 8
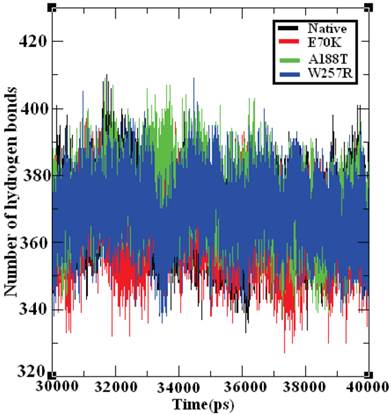
Number of hydrogen bonds formed in the native and mutant structures of the GCK protein. The ordinate is the number of hydrogen bonds in the protein, and the abscissa is time (ps). The black, red, green, and blue lines indicate the native, I63R, H135R, and T285M mutant structures, respectively.
The salt bridge distances in the native and mutant structures of GCK protein were calculated from the last 10 ns of the trajectory data (Figure 9). The native structure of the GCK protein contained salt bridges and maintained a different range of distances throughout the last 10 ns of the simulation period. In the ~32-34 ns, ~36 ns, and ~40 ns periods, the native protein exhibited a maximum salt bridge distance of ~0.7 nm, and an average range distance of ~0.5 nm was observed throughout the last 10 ns of the simulation period. The structures of all three mutants (E70K, A188T, and W257R) showed different ranges of distance compared with the native protein, and the structure of the W257R mutant exhibited a different range of salt bridge distances in the maximum simulation period compared with the native, E70K, and A188T structures. Based on this analysis, we infer that the changes in the salt bridge distances of the three mutant structures in comparison with the native structure may be due to the incorporation of deleterious amino acid substitutions.
Figure 9
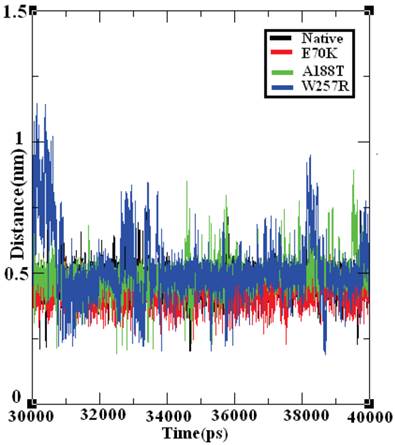
Salt bridge formation and distances in the native and mutant structures of the GCK protein. The ordinate is distance (nm), and the abscissa is time (ps). The black, red, green, and blue lines indicate the native, E70K, A188T, and W257R mutant structures, respectively.
Effect of deleterious GCK variants in the SASA of native and mutant proteins
The SASA of a protein is the protein surface in contact with the solvent molecule. The solvation effect plays an important role in the maintenance of protein stability and folding. Similarly, solvation effects accompany the protein binding process and the rearrangement of protein structure. These solvation effects can be measured by explicit solvent models; for example, MD simulations typically use a sphere of water molecules [72]. The solvation energy can be determined from the SASA in a rapid linear way with an accuracy comparable to those of theoretical models [73]. Accessible surface area (ASA) models have become commonly accepted within available implicit solvent treatments and have been used successfully in many applications, such as protein MD [74] and structure prediction [75]. The SASA was calculated for both the native and mutant structures of the GCK protein. Figure 10 shows that the native GCK protein displayed a SASA of ~88 nm2 to ~99 nm2 in the last 10 ns of the simulation period, whereas the models of the E70K, A188T, and W257R protein structures displayed a somewhat lower SASA than the native GCK protein. At a few simulation points, all three mutant structures displayed different SASAs. The observed changes in the SASA of the mutant structures indicate that a repositioning of amino acid residues from buried regions to accessible areas, or vice versa, may occur. Collectively, these observations show that changes in the GCK protein structure accompany the substitution of deleterious amino acids.
Figure 10
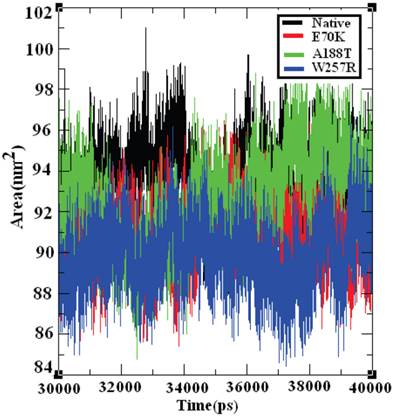
Solvent-accessible surface area of the native and mutant structures of the GCK protein. The ordinate is distance (nm), and the abscissa is time (ps). The black, red, green, and blue lines indicate the native, E70K, A188T, and W257R mutant structures, respectively.
Discussion
The most common genetic variants are SNPs, which occur at a frequency of approximately 1 in 1650 bp throughout the human genome [76]. Because many diseases have a strong genetic component, the identification of SNPs and an understanding of their roles in pathological conditions are expected to shed light on disease susceptibility and aid in the development of more effective treatments. As of Nov. 7, 2013, approximately 44,278,189 human SNPs had been identified, validated, and deposited in the National Centre for Biotechnology Information (NCBI) database. The most identifiable group of SNPs is the nsSNPs, a small proportion (1%) of which are located within the coding regions of genes, where they can therefore lead to alterations in the amino acid sequences of the corresponding proteins. These changes can cause a loss of thermodynamic stability, as well as the aberrant folding and aggregation of proteins. Most nsSNPs have been identified through the sequencing and genotyping of DNA samples from general populations, and many were identified during the course of the HapMap project, a key resource for the identification of genetic variants that affect human disease. Half of all genetic changes related to human diseases are attributable to nsSNPs. Hence, these nSNPs are considered to be deleterious because they lead to marked phenotypic consequences [77, 78]. Distinguishing deleterious nsSNPs from neutral nsSNPs is essential for characterising the genetic basis and pathogenesis of human disease. By distinguishing between these polymorphisms, we are able to assess an individual's susceptibility to disease [79]. It is assumed that nsSNPs that occur in the protein-coding sequences observed in living organisms have survived natural selection. Disease-causing or deleterious mutations are most likely to occur in evolutionarily conserved positions in a protein-coding sequence [41, 80]. Therefore, our hypothesis was that amino acids conserved across species are more likely to be functionally significant than non-conserved amino acids. This suggests that the application of a molecular evolutionary approach may allow the prioritisation of SNPs that should be genotyped in future molecular epidemiological studies. Several studies of human disease-causing genes, such as p53, p16, CFTR, G6PD, L1CAM, PAH, and other genes [81-88], have confirmed this assumption. Therefore, the present study will provide useful information for the selection of SNPs that are likely to have a potential functional impact in MODY 2 disease susceptibility.
In this study, we performed a systematic computational analysis of the GCK gene to determine the potential deleterious nsSNPs associated with this gene and performed MD simulations to determine the structural and functional significance of these nsSNPs. To identify the deleterious nsSNPs in the GCK gene, we employed the widely used evolution-based multiple methods SIFT, PolyPhen2, PhD-SNP, SNAP, SNPs&GO, fathmm, Align GVGD, and SNPeffect 4.0, which predicted 356 (79%), 398 (88%), 372 (83%), 293 (65%), 450 (100%), 450 (100%), 112 (25%), and 332 (74%) of the identified nsSNPs within this gene to be deleterious, respectively. Among these methods, SNPs&GO and fathmm performed best in terms of accuracy, SNPs&GO and fathmm performed best in terms of sensitivity, SNAP performed best in terms of specificity (0.448), and PolyPhen2 performed best in terms of NVP and MCC. To quantify the destabilisation effect of known mutations in the GCK gene, we computed the protein stability changes in the mutant proteins using three different approaches with increasing levels of complexity. Importantly, all three approaches (PoPMusic 2.1, I mutant 3.0, and Dmutant) revealed a consistent trend in the destabilisation effects of mutations on the GCK structure. The methods utilised by the above-mentioned in silico tools vary in the approach used to make their predictions, and the predictions (deleterious and neutral) are therefore expected to differ to some extent. All of the methods, however, follow a similar procedure in which every single missense variant is first labelled with the properties related to the damage it may cause to the protein structure or function. The resulting feature vector is then utilised to decide whether the variant is pathogenic. The computational methods used to make these predictions differ in the properties of the variant taken into account, as well as in the reference databases and the training of the classification methods used for the decision-making. However, similar positive predictions from all of the utilised computational methods may indicate a high possibility of the similar predicted behaviour. Most of the available computational prediction methods available online were benchmarked by the curators with their known datasets and shown to perform well. The increasing number of studies that have compared the prediction scores from various sets of tools using the same dataset indicate that no single method can be rated as the best predictor [89, 90]. The results obtained from these studies indicate that the use of a combination of methods with sequence and structure information may provide wider coverage and more accurate predictions in the study of nsSNPs. In addition, we adopted a ranking strategy to prioritise nsSNPs based on the prediction scores obtained from these computational methods. This ranking strategy can be applied to any gene, protein, or disease to assist the prioritisation of functional nsSNPs on a large scale before further experimental investigation.
Mutations lead to changes in amino acid properties that, in turn, lead to the loss or gain of hydrogen bonds and other interactions. These changes may disrupt the local environment because of structural interactions near the substitution sites; such substitutions manifest their deleterious effects by introducing changes in the protein's structural characteristics, such as its size, surface charge distribution, hydrophobic contacts, and residue-solvent interactions [91]. An analysis of the protein's primary sequence provides the most direct and readily available information regarding possible functional mutation sites. Recent studies have explored the occurrence of particular amino acids and their biophysical characteristics in various native and mutant proteins [92, 93]. Based on these studies, arginine and glycine were found to be the most common amino acids in the native state, whereas tryptophan, tyrosine, and cysteine residues were found to be the most common in the mutant state. The occurrence of mutated residues was found to increase the probability that the nsSNPs are disease-related. In our analysis, we first investigated the occurrence of amino acid residues in wild-type and mutated GCK proteins. As is clearly shown in Supplementary Material: Figure S5, glycine occurs most frequently among the mutant residues, followed by alanine and arginine, whereas proline, arginine, and valine were found to be the most commonly mutated residues in GCK. In addition, a comparative analysis of amino acid conservation from multiple species by protein sequence alignment was performed, and this analysis provided an indication of which amino acid residues are truly conserved and which changes represent localised evolution. Conversely, most of the substituted amino acids in GCK were deleterious in nature according to all of the computational methods used. These amino acids yielded the tallest stacks in the sequence logos generated using WebLogo and were also located in highly conserved regions, as determined through ConSurf analysis. Population genetic studies have reported that a significant fraction of functional nsSNPs are present in highly conserved regions of gene sequences. Residues that evolve under strong selective pressure are found to be significantly associated with human diseases [94]. A number of studies have indicated that substituted amino acids play a role in the causation of disease [93] and the tryptophan and cysteine play a role in the determination of protein stability [94]. A few studies have also illustrated the importance of cysteine residues in a protein sequence because most protein folding depends on disulphide bonds [95]. SNP-associated residue changes to or from cysteine are likely to destabilise a protein structure. Taking these findings into consideration, we extended our analysis to assess the propensity of each amino acid in the native and mutant states to affect the function of GCK, including the formation of disulphide bonds (due to changes in cysteine residues).
Studying the impact of mutations at the structural level provides valuable insight into the effects of mutations (alterations in the properties of a protein) and their disease phenotypes. This can be achieved by mapping a specific nsSNP onto the known crystallised 3D structure of a protein and then inducing a mutation at the corresponding residues. This method can reveal whether a given mutation alters protein folding or results in the loss or gain of hydrophobic contacts. This type of analysis is laborious and time-consuming in an experimental setup; most importantly, analysing the impact of all such mutations at the structural level is impossible, making it essential to use computational methods such as MD to predict the structural effects of functional nsSNPs. Based on the frequency of substitutions and the pathogenic output generated by the computational prediction methods used in the present study, we selected three deleterious substitutions for further analysis at the molecular level. Thus, the catalytic properties of three missense mutations associated with diabetes (E70K, A188T, and W257R of GCK) were chosen for our MD study. E70K, A188T, and W257R were selected for this further study because they are found in the connecting loop region, the small domain, and the large domain of the GCK protein, respectively, and because all three of these regions are highly conserved.
Five basic parameters (RMSD, RMSF, hydrogen bonds, salt bridges, and SASA) were analysed in the last 10 ns of the simulation trajectories. Although RMSD and RMSF are similar to each other, the important distinction between these measures is that RMSD depicts the deviation from the minimised crystal structure (molecular stability) (i.e., it provides an overall picture of the extent to which each part of the protein has changed over the course of the simulation), whereas RMSF illustrates the deviation from the mean structure over a dynamic ensemble (flexibility changes) (i.e., stability is the fundamental property that enhances bimolecular function, activity, and regulation). The results of the GCK protein stability analysis showed that the structures of the three mutants (E70K, A188T, and W257R) exhibited different RMSD values from that of the native structure. Greater deviations increase the stability of the molecule, and vice versa; higher stability results in increased protein rigidity, and decreased stability results in increased protein flexibility. Although conformational changes are required for a protein to perform its normal functions [96], conformational flexibility and rigidity must be finely balanced [97]. The stability analysis of the native and mutant GCK proteins revealed that the mutant structures presented increased rigidity due to the incorporation of deleterious amino acids. The RMSF analysis revealed flexibility changes in all three mutant structures. In particular, the mutant structures showed higher fluctuations in the residue range of ~200 to ~350 than the native structure. Thus, consistent with the RMSD results, the RMSF analysis indicated that the amino acid substitutions adversely affected the flexibility of the GCK protein. In addition to various electrostatic forces, the hydrogen bonds in a protein are the primary contributors to the stability of the protein. The presence of deleterious mutations may change the pattern of hydrogen bond formation within proteins. The pattern of hydrogen bonds within a protein is an important characteristic that can be used to infer how perturbations result from mutations [98]. Changes in the number of hydrogen bonds were observed in the three GCK mutants, suggesting that the presence of these mutations affects the stability of the protein. The salt bridge analysis revealed that both the native and the mutant structures of the GCK protein present different patterns of salt bridge distances. Changes in salt bridge distances reflect the displacement of cationic or anionic side chains of amino acid residues in mutant proteins. All of the mutants studied exhibited changes in the bonding distance, and such changes in residue distance may cause a loss of thermodynamic stability. Furthermore, although the native and mutant structures displayed almost similar SASAs in the last 10 ns of the equilibrated state, a lower SASA was observed for all three mutant proteins at certain points in time during the equilibrated state compared with the native GCK protein. The reduced solvent-accessible area in the mutant proteins indicates that the mutations may decrease the probability of their interaction with other molecules. Thus, SASA analysis elucidates how the presence of deleterious polymorphisms in the GCK protein may introduce a change in the hydrophilic and hydrophobic regions of the protein.
Previous studies using both experimental and computational methods have demonstrated the structural and functional impact of missense mutations on the GCK protein. The results of these studies showed that these techniques can be used to differentiate disease-related and neutral mutations [99, 100]. Takeda et al. (1993) described the catalytic properties of several missense mutants [101] and showed that the W257R mutation produces an enzyme that has an activity of less than 0.6% of that of native human β-cell glucokinase. In contrast, the E70K and A188T mutant proteins display a Vmax that is 20-100% of the normal value, but their Km for glucose is 8- to 14-fold greater than that found for the wild-type enzyme. These findings illustrate that mutations at residues involved in catalysis and substrate binding can lead to a complete loss of enzyme activity. Hence, the MD approach can support our comprehension of the changes in the native form of the enzyme that lead to non-insulin-dependent diabetes mellitus and MODY. Thus, by combining the primary sequence, the physicochemical properties of amino acids, the 3D structure of the protein, and energy calculations, it is possible to successfully predict the molecular effects of deleterious mutations in GCK that may cause MODY2. This type of evolution-based modelling approach can further our understanding of how these deleterious mutations can alter protein function and, in turn, may reveal the molecular basis of diseases, such as MODY2.
Recent advances in low-cost, high-throughput DNA sequencing and computational technologies have resulted in a rapid expansion in the rate of identification and deposition of SNPs in databases. The identification and characterisation of disease-related phenotypes has a unique role in the diagnosis and treatment of disease, but the marked increase in the number of identified SNPs poses a major challenge to experimental biologists. A big part of this challenge is the connection of loss or gain of function due to mutation with disease phenotype. To meet this challenge, a systematic computational approach was designed to efficiently assess the pathogenicity associated with each SNP. The proposed computational architecture has an advantage over previous studies due to the inclusion of MD. Our analysis uses a cost-effective computational methodology in combination with evolution-based deleterious nsSNP prediction methods, sequence conservation analysis, structural modelling, and MD simulations to measure changes in the local environment of a protein upon mutation. In this study, our primary aim was to emphasise the degree of uniformity between computational methods rather than their performance. The amount of information about SNPs that is available in public databases, such as dbSNP and Ensembl, is increasing owing to the development of cost-effective sequencing technologies. We hope that this type of combinatorial computational pipeline, which was developed from a biophysical perspective, will help to achieve a better understanding of the molecular mechanisms by which mutations alter the structural dynamics and stability of proteins and the impact of these changes. This cost-effective computational procedure presented in this manuscript provides valuable insight into the mechanistic basis of GCK mutations.
Supplementary Material
Supplementary figures and tables.
Abbreviations
GCK, Glucokinase; DM, Diabetes Mellitus; NPV, Negative Predictive Value; MCC, Matthews's correlation coefficient; NIDDM, Non-insulin-Dependent DM; MODY, Maturity Onset Diabetes of the Young; SIFT, Sorting Intolerant From Tolerant; SNPs, Single Nucleotide Polymorphisms; nsSNPs, Non-synonymous Single Nucleotide Polymorphisms; DFIRE, Distance-scaled, Finite Ideal-gas Reference; GRACE, Graphing, Advanced Computation and Exploration; MSA, Multiple Sequence Alignment; RMSD, Root mean square deviation; RMSF, Root mean square fluctuation; SASA, solvent-accessible surface area; MD, Molecular Dynamics.
Acknowledgements
This work was supported by the Research Grants Council of Hong Kong [212111 and 212631], Faculty Research Grant [12-13/061], and partially supported by the National Natural Science Foundation of China (61134013 and 91029301). The authors take this opportunity to thank the management of VIT and Galgotias University for providing the facilities and encouragement to carry out this work.
Competing Interests
The authors have declared that no competing interest exists.
References
1. American Diabetes Association. Diagnosis and classification of diabetes mellitus. Diabetes Care. 2011;33(Suppl 1):S62-S69
2. Hattersley A, Bruining J, Shield J. et al. The diagnosis and management of monogenic diabetes in children and adolescents. Pediatr Diabetes. 2009;10(Suppl 12):33-42
3. Molven A, Njolstad PR. Role of molecular genetics in transforming diagnosis of diabetes mellitus. Expert Rev Mol Diagn. 2011;11:313-320
4. Fajans SS, Bell GI, Polonsky KS. Molecular mechanisms and clinical pathophysiology of maturity-onset diabetes of the young. N Engl J Med. 2001;345:971-980
5. Kropff J, Selwood MP, McCarthy MI. et al. Prevalence of monogenic diabetes in young adults: a community-based, cross-sectional study in Oxfordshire, UK. Diabetologia. 2011;54:1261-1263
6. Shields BM, Hicks S, Shepherd MH. et al. Maturity-onset diabetes of the young (MODY): how many cases are we missing? Diabetologia. 2010;53:2504-2508
7. DellaManna T, Silva MR, Chacra AR. et al. Clinical follow-up of two Brazilian subjects with glucokinase-MODY (MODY2) with description of a novel mutation. Arq Bras Endocrinol Metabol. 2012;56(Suppl 8):490-5
8. Iynedjian PB. Mammalian glucokinase and its gene. Biochem J. 1993;293:1-13
9. Colowick SP. The hexokinases. In Boyer PD, Ed. The Enzymes Vol 9. New York: Academic. 1973:1-48
10. Lawrence GM, Trayer IP. Hexokinase isoenzymes: antigenic cross-reactivities and amino acid compositional relatedness. Comp Biochem Physiol B Comp Biochem. 1984;79:233-38
11. Nishi S, Susumu S, Bell Gl. Human hexokinase: sequences of amino- and carboxyl-terminal halves are homologous. Biochem Biophys Res Commun. 1988;157:937-43
12. Magnuson MA. Glucokinase gene structure. Functional implications of molecular genetic studies. Diabetes. 1990;39(Suppl 5):523-7
13. Matschinsky FM, Porte D. Glucokinase activators (GKAs) promise a new pharmacotherapy for diabetics. F1000 Med Rep. 2010;2:43
14. Murphy R, Tura A, Clark PM. et al. Glucokinase, the pancreatic glucose sensor, is not the gut glucose sensor. Diabetologia. 2009;52(Suppl 1):154-9
15. Stefanovski D, Youn JH, Rees M. et al. Estimating hepatic glucokinase activity using a simple model of lactate kinetics. Diabetes Care. 2012;35(Suppl 5):1015-20
16. Gloyn AL. Glucokinase (GCK) mutations in hyper- and hypoglycemia: maturity-onset diabetes of the young, permanent neonatal diabetes, and hyperinsulinemia of infancy. Hum Mutat. 2003;22:353-362
17. Glaser B, Kesavan P, Heyman M. et al. (1998) Familial hyperinsulinism caused by an activating glucokinase mutation. N. Engl. J. Med. 1998;338:226-230
18. Njolstad PR, Sovik O, Cuesta-Munoz A. et al. Neonatal diabetes mellitus due to complete glucokinase deficiency. N Engl J Med. 2001;344:1588-1592
19. Vionnet N, Stoffel M, Takeda J. et al. Nonsense mutation in the glucokinase gene causes early-onset non-insulin-dependent diabetes mellitus. Nature (London). 1992;356:721-722
20. Kamata K, Mitsuya M, Nishimura T. et al. Structural basis for allosteric regulation of the monomeric allosteric enzyme human glucokinase. Structure. 2004;12(Suppl 3):429-38
21. Froguel P, Vaxillaire M, Sun F. et al. Close linkage of glucokinase locus on chromosome 7p to early-onset non-insulin-dependent diabetes mellitus. Nature. 1992;356(6365):162-4
22. Osbak KK, Colclough K, Saint-Martin C. et al. Update on mutations in glucokinase (GCK), which cause maturity onset diabetes of the young, permanent neonatal diabetes, and hyperinsulinemic hypoglycemia. Hum Mutat. 2009;30:1512-1526
23. Krawczak M, Ball EV, Fenton I. et al. Human gene mutation database—a biomedical information and research resource. Hum Mutat. 2000;15:45-51
24. García-Herrero C-M, Rubio-Cabezas O, Azriel S. et al. Functional Characterization of MODY2 Mutations Highlights the Importance of the Fine-Tuning of Glucokinase and Its Role in Glucose Sensing. PLoS ONE. 2012;7(1):e30518
25. Murphy R, Ellard S, Hattersley AT. Clinical implications of a molecular genetic classification of monogenic beta-cell diabetes. Nat Clin Pract Endocrinol Metab. 2008;4:200-213
26. Sunyaev S, Hanke J, Aydin A. et al. Prediction of nonsynonymous single nucleotide polymorphisms in human disease associated genes. J Mol Med. 1999;77:754-60
27. Chasman D, Adams RM. Predicting the functional consequences of non-synonymous single nucleotide polymorphisms: structure based assessment of amino acid variation. J Mol Biol. 2001;307:683-706
28. Ng PC, Henikoff S. Predicting deleterious amino acid substitutions. Genome Res. 2001;11:863-874
29. Ng PC, Henikoff S. Predicting the effects of amino acid substitutions on protein function. Annu Rev Genomics Hum Genet. 2006;7:61-80
30. Mooney S. Bioinformatics approaches and resources for single nucleotide polymorphism functional analysis. Brief Bioinform. 2005;6:44-56
31. Laskowski RA, Thornton JM. Understanding the molecular machinery of genetics through 3D structures. Nat Rev Genet. 2008;9:141-151
32. Kumar P, Henikoff S, Ng PC. Predicting the effects of coding non-synonymous variants on protein function using the SIFT algorithm. Nat Protoc. 2009;4:1073-81
33. Adzhubei IA, Schmidt S, Peshkin L. et al. A method and server for predicting damaging missense mutations. Nat Methods. 2010;7:248-249
34. Capriotti E, Calabrese R, Casadio R. Predicting the insurgence of human genetic diseases associated to single point protein mutations with support vector machines and evolutionary information. Bioinformatics. 2006;22:2729-2734
35. Dehouck Y, Kwasigroch JM, Gilis D. et al. Popmusic 2.1: a web server for the estimation of protein stability changes upon mutation and sequence optimality. BMC Bioinformatics. 2011;12:151
36. Bromberg Y, Rost B. SNAP: predict effect of non-synonymous polymorphisms on function. Nucleic Acids Res. 2007;35:3823-3835
37. Calabrese R, Capriotti E, Fariselli P. et al. Functional annotations improve the predictive score of human disease-related mutations in proteins. Human Mutation. 2009;30:1237-1244
38. Shihab HA, Gough J, Cooper DN. et al. Predicting the Functional, Molecular and Phenotypic Consequences of Amino Acid Substitutions using Hidden Markov Models. Hum Mutat. 2013;34:57-65
39. Capriotti E, Fariselli P, Rossi I. et al. A three-state prediction of single point mutations on protein stability changes. BMC Bioinformatics. 2008;9(Suppl 2):S6
40. Zhou H, Zhou Y. Distance-scaled, finite ideal-gas reference state improves structure-derived potentials of mean force for structure selection and stability prediction. Protein Sci. 2002;11(Suppl 11):2714-26
41. Tavtigian SV, Deffenbaugh AM, Yin L. et al. Comprehensive statistical study of 452 BRCA1 missense substitutions with classification of eight recurrent substitutions as neutral. J Med Genet. 2006;43(Suppl 4):295-305
42. Mathe E, Olivier M, Kato S. et al. Computational approaches for predicting the biological effect of p53 missense mutations: a comparison of three sequence analysis based methods. Nucleic Acids Res. 2006;34(Suppl 5):1317-25
43. International Diabetes Federation. IDF Diabetes Atlas, 6th edn. Brussels, Belgium: International Diabetes Federation. 2013
44. Landau M, Mayrose I, Rosenberg Y. et al. ConSurf 2005: the projection of evolutionary conservation scores of residues on protein structures. Nucleic Acids Research. 2005;33:W299-W302
45. Valdar WSJ. Scoring residue conservation. Proteins: Structure, Function, and Genetics. 2002;43(Suppl 2):227-241
46. Reumers J, Schymkowitz J, Ferkinghoff-Borg J. et al. SNPeffect 4.0: on-line prediction of molecular and structural effects of protein-coding variants. Nucleic Acids Res. 2012;40(Suppl 1):D935-9
47. Lee PH, Shatkay H. F- SNP: computationally predicted functional SNPs for disease association studies. Nucleic Acids Res. 2008;36:D820-4
48. Yuan HY, Chiou JJ, Tseng WH. et al. FASTSNP: an always up-to-date and extendable service for SNP function analysis and prioritization. Nucleic Acids Res. 2006;34:W635- W641
49. Hess B, Kutzner C, van der Spoel D. et al. GROMACS 4: Algorithms for Highly Efficient, Load-Balanced, and Scalable Molecular Simulation. J Chem Theory Comput. 2008;4:435-447
50. Sherry ST, Ward MH, Kholodov M. et al. dbSNP: the NCBI database of genetic variation. Nucleic Acids Res. 2001;29(Suppl 1):308-311
51. Amos B, Rolf A. The SWISS-PROT Protein Sequence Data Bank and Its New Supplement TREMBL. Nucleic Acids Res. 1996;24(Suppl 1):21-25
52. Stenson PD, Mort M, Ball EV. et al. The Human Gene Mutation Database (HGMD®): 2008 Update. Genome Med. 2009;1(Suppl 1):13
53. Amberger J, Bocchini CA, Scott AF. et al. McKusick's Online Mendelian Inheritance in Man (OMIM). Nucleic Acids Res. 2009;37:793-796
54. Kouranov A, Xie L, de la Cruz J. et al. The RCSB PDB information portal for structural genomics. Nucleic Acids Res. 2006;34:D302-305
55. Bava KA, Gromiha MM, Uedaira H. et al. ProTherm version 4.0: Thermodynamic database for proteins and mutants. Nucleic Acids Res. 2004;32:120-121
56. Edgar RC. MUSCLE: multiple sequence alignment with high accuracy and high throughput". Nucleic Acids Research. 2004;32(Suppl 5):1792-97
57. Crooks GE, Hon G, Chandonia JM. et al. WebLogo: A sequence logo generator. Genome Research. 2004;14:1188-1190
58. Van Gunsteren WF, Billeter SR, Eising AA. et al. Biomolecular Simulation: The GROMOS96 Manual and User Guide; vdf Hochschulverlag AG an der ETH Zurich and BIOMOS b.v: Zurich, Groningen 1996.
59. Jorgensen WL, Chandrasekhar J, Madura JD. et al. Comparison of simple potential functions for simulating liquid water. J Chem Phys. 1983;79:926
60. Berendsen HJC, Postma JPM, van Gunsteren WF. et al. Molecular dynamics with coupling to an external bath. J Chem Phys. 1984;81:3684-3690
61. Essmann U, Perera L, Berkowitz ML. et al. A smootparticle meshes Ewald method. J Chem Phys. 1995;103:8577-8593
62. Case DA, Pearlman DA, Caldwell JW. et al. AMBER Simulation Software Package. San Francisco, CA, University of California. 2002
63. Ryckaert J-P, Ciccotti G, Berendsen HJC. Numerical Integration of the Cartesian Equations of Motion of a System with Constraints: Molecular Dynamics of n-Alkanes. Journal of Computational Physics. 1977;23:327-341
64. Baker EN, Hubbard RE. Hydrogen bonding in globular proteins. Prog Biophys Mol Biol. 1984;44:97-179
65. Brendel V, Bucher P, Nourbakhsh I. et al. Methods and algorithms for statistical analysis of protein sequences. Proc. Natl. Acad. Sci. USA. 1992;89:2002-2006
66. Cheng J, Randall AZ, Sweredoski MJ. et al. SCRATCH: a protein structure and structural feature prediction server. Nucleic Acids Res. 2005;33:W72-W76
67. Venselaar H, Te Beek TA, Kuipers RK. et al. Protein structure analysis of mutations causing inheritable diseases. An e-Science approach with life scientist friendly interfaces. BMC Bioinformatics. 2010;11:548
68. W. L. DeLano, The PyMOL Molecular Graphics System, DeLano Scientific LLC, San Carlos, CA, USA. 2002
69. Cui Q, Bahar I. Normal mode analysis: Theory and applications to biological and chemical systems. Chapman & Hall/CRC, Boca Raton, FL. 2006
70. Desiraju G, Steiner T. The Weak Hydrogen Bond-In Structural Chemistry and Biology; Oxford University Press: Oxford, 1999.
71. Gerlt JA, Kreevoy MM, Cleland WW. et al. Understanding enzymic catalysis: the importance of short, strong hydrogen bonds. Chem Biol. 1997;4:259-267
72. Becker O, Mackerell A Jr, Roux B. et al. Computer simulation of biomolecular system: Theoritical and experimental. Computational Biochemistry & Biophysics, Marcel Dekker, New York. 2001
73. Eisenberg D, McClachlan A. Solvation energy in protein folding and binding. Nature. 1986;319:199-203
74. Ferrara P, Apostolakis J, Caflisch A. Evaluation of a fast implicit solvent model for molecular dynamics simulations. Proteins. 2002;46:24-33
75. Koehl P, Delarue M. Polar and nonpolar atomic environments in the protein core Implications for folding and binding. Proteins. 1994; 20: 264-278.
76. Shastry BS. SNP alleles in human disease and evolution. J Hum Genet. 2002;47(Suppl 11):561-6
77. Sunyaev S, Ramensky V, Koch I. et al. Prediction of deleterious human alleles. Hum Mol Genet. 2001;10(6):591-597
78. Yue P, Moult J. Identification and analysis of deleterious human SNPs. J Mol Biol. 2006;356(5):1263-1274
79. Dimmic MW, Sunyaev S, Bustamante CD. Inferring SNP function using evolutionary, structural, and computational methods. Pac Symp Biocomput. 2005:382-384
80. Thusberg J, Vihinen M. Pathogenic or not? And if so, then how? Studying the effects of missense mutations using bioinformatics methods. Hum Mutat. 2009;30:703-714
81. Greenblatt MS, Beaudet JG, Gump JR. et al. Detailed computational study of p53 and p16: using evolutionary sequence analysis and disease-associated mutations to predict the functional consequences of allelic variants. Oncogene. 2003;22:1150-1163
82. Miller MP, Kumar S. Understanding human disease mutations through the use of interspecific genetic variation. Hum Mol Genet. 2001;10:2319-2328
83. Mooney SD, Klein TE. The functional importance of disease-associated mutation. BMC Bioinformatics. 2002;3:24
84. Sunyaev S, Ramensky V, Bork P. Towards a structural basis of human non-synonymous single nucleotide polymorphisms. Trends Genet. 2000;16:198-200
85. Rishishwar L, Varghese N, Tyagi E. et al. Relating the Disease Mutation Spectrum to the Evolution of the Cystic Fibrosis Transmembrane Conductance Regulator (CFTR). PLoS ONE. 2012;7:e42336
86. Rajith B, George Priya Doss C. Path to facilitate the prediction of functional amino acid substitutions in red blood cell disorders--a computational approach. PLoS One. 2011;6(9):e24607
87. George Priya Doss C, Sethumadhavan R. Structural and Functional Analysis of Deleterious Nonsynonymous Single Nucleotide Polymorphisms in PAH Associated with Phenylketonuria. Advanced Science Letters. 2009;2(3):364-371
88. Wei Q, Wang L, Wang Q. et al. Testing computational prediction of missense mutation phenotypes: functional characterization of 204 mutations of human cystathionine beta synthase. Proteins. 2010;78(Suppl 9):2058-2074
89. Hicks S, Wheeler DA, Plon SE. et al. Prediction of missense mutation functionality depends on both the algorithm and sequence alignment employed. Hum Mutat. 2011;36(Suppl 6):661-668
90. Hao DC, Feng Y, Xiao R. et al. Non-neutral nonsynonymous single nucleotide polymorphisms in human ABC transporters: the first comparison of six prediction methods. Pharmacol Rep. 2011;63(4):924-934
91. Chen H, Zhou HX. Prediction of solvent accessibility and sites of deleterious mutations from protein sequence. Nucleic Acids Res. 2005;33:3193-3199
92. Khan S, Vihinen M. Spectrum of disease-causing mutations in protein secondary structures. BMC Struct Biol. 2007;7(Suppl 1):1-18
93. Vitkup D, Sander C, Church G. The amino-acid mutational spectrum of human genetic disease. Genome Biol. 2003;4(Suppl 11):R72
94. Arbiza L, Duchi S, Montaner D. et al. Selective pressures at a codon level predict deleterious mutations in human disease genes. J Mol Biol. 2006;358:1390-1404
95. Song X, Geng Z, Zhu J. et al. Structure-function roles of four cysteine residues in the human arsenic (+3 oxidation state) methyltransferase (hAS3MT) by sitedirected mutagenesis. Chemico-Biological Interactions. 2009;179:321-8
96. Vihinen M. Relationship of protein flexibility to thermostability. Protein Eng. 1987;1:477-480
97. Bikadi Z, Demko L, Hazai E. Functional and structural characterization of a protein based on analysis of its hydrogen bonding network by hydrogen bonding plot. Arch Biochem Biophys. 2007;461:225-234
98. Ahmad S, Gromiha MM, Sarai A. Analysis and Prediction of DNA-binding proteins and their binding residues based on composition, sequence and structural information. Bioinformatics. 2004;20:477-486
99. Takeda J, Gidh-Jain M, Xu LZ. et al. Structure/function studies of human beta-cell glucokinase. Enzymatic properties of a sequence polymorphism, mutations associated with diabetes, and other site-directed mutants. J Biol Chem. 1993;268:15200-15204
100. Capuano M, Garcia-Herrero CM, Tinto N. et al. Glucokinase (GCK) Mutations and Their Characterization in MODY2 Children of Southern Italy. PLoS ONE. 2012;7(Suppl 6):e38906
101. Tinto N, Zagari A, Capuano M. et al. Glucokinase Gene Mutations: Structural and Genotype-Phenotype Analyses in MODY Children from South Italy. PLoS ONE. 2008;3(Suppl 4):e1870
Author contact
![]() Corresponding authors: Tel: (852) 3411 7636; Fax: (852) 3411 7892; Email: hlzhuhkbu.edu.hk (H Zhu); georgecp77co.in (GPD C)
Corresponding authors: Tel: (852) 3411 7636; Fax: (852) 3411 7892; Email: hlzhuhkbu.edu.hk (H Zhu); georgecp77co.in (GPD C)
Citation styles
APA
George, D.C.P., Chakraborty, C., Haneef, SA.S., NagaSundaram, N., Chen, L., Zhu, H. (2014). Evolution- and Structure-Based Computational Strategy Reveals the Impact of Deleterious Missense Mutations on MODY 2 (Maturity-Onset Diabetes of the Young, Type 2). Theranostics, 4(4), 366-385. https://doi.org/10.7150/thno.7473.
ACS
George, D.C.P.; Chakraborty, C.; Haneef, SA.S.; NagaSundaram, N.; Chen, L.; Zhu, H. Evolution- and Structure-Based Computational Strategy Reveals the Impact of Deleterious Missense Mutations on MODY 2 (Maturity-Onset Diabetes of the Young, Type 2). Theranostics 2014, 4 (4), 366-385. DOI: 10.7150/thno.7473.
NLM
George DCP, Chakraborty C, Haneef SAS, NagaSundaram N, Chen L, Zhu H. Evolution- and Structure-Based Computational Strategy Reveals the Impact of Deleterious Missense Mutations on MODY 2 (Maturity-Onset Diabetes of the Young, Type 2). Theranostics 2014; 4(4):366-385. doi:10.7150/thno.7473. https://www.thno.org/v04p0366.htm
CSE
George DCP, Chakraborty C, Haneef SAS, NagaSundaram N, Chen L, Zhu H. 2014. Evolution- and Structure-Based Computational Strategy Reveals the Impact of Deleterious Missense Mutations on MODY 2 (Maturity-Onset Diabetes of the Young, Type 2). Theranostics. 4(4):366-385.
This is an open access article distributed under the terms of the Creative Commons Attribution (CC BY-NC) License. See http://ivyspring.com/terms for full terms and conditions.