Impact Factor
 Global reach, higher impact
Theranostics 2014; 4(1):24-35. doi:10.7150/thno.7188 This issue Cite
Research Paper
Towards Stratifying Ischemic Components by Cardiac MRI and Multifunctional Stainings in a Rabbit Model of Myocardial Infarction
Yuanbo Feng1, Feng Chen1, Zhanlong Ma2, Frederik Dekeyzer1, Jie Yu1, Yi Xie3, Marlein Miranda Cona1, Raymond Oyen1, Yicheng Ni1 ![]()
1. KU Leuven, Department of Imaging and Pathology, Theragnostic Laboratory, Radiology Section, University Hospital Gasthuisberg, Leuven, Belgium
2. Departments of Radiology, the First Affiliated Hospital, Nanjing Medical University, China
3. Departments of Electronics and Information System (ELIS), Ghent University, Belgium
Received 2013-7-18; Accepted 2013-9-10; Published 2013-12-1
Abstract
Objectives: We sought to identify critical components of myocardial infarction (MI) including area at risk (AAR), MI-core and salvageable zone (SZ) by using cardiac magnetic resonance imaging (cMRI) and multifunctional stainings in rabbits.
Materials and Methods: Fifteen rabbits received 90-min coronary artery (CA) ligation and reopening to induce reperfused MI. First-pass perfusion weighted imaging (PWI90') was performed immediately before CA reperfusion. Necrosis avid dye Evans blue (EB) was intravenously injected for later MI-core detection. One-day later, cMRI with T2-weighted imaging (T2WI), PWI24h and delayed enhancement (DE) T1WI was performed at a 3.0T clinical scanner. The heart was excised and CA was re-ligated with aorta infused by red-iodized-oil (RIO). The heart was sliced into 3-mm sections for digital radiography (DR), histology and planimetry with myocardial salvage index (MSI) and perfusion density rate (PDR) calculated.
Results: There was no significant difference between MI-cores defined by DE-T1WI and EB-staining (31.13±8.55% vs 29.80±7.97%; p=0.74). The AAR was defined similarly by PWI90' (39.93±9.51%), RIO (38.82±14.41%) and DR (38.17±15.98%), underestimated by PWI24h (36.44±5.31%), but overestimated (p<0.01) by T2WI (56.93±8.87%). Corresponding MSI turned out to be 24.17±9.5% (PWI90'), 21.97±9.41% (DR) and 22.68±9.65% (RIO), which were significantly (p<0.01) higher and lower than that with PWI24h (15.15±7.34%) and T2WI (45.52±7.5%) respectively. The PDR differed significantly (p<0.001) between normal myocardium (350.6±33.1%) and the AAR (31.2±15%), suggesting 11-times greater blood perfusion in normal myocardium over the AAR.
Conclusion: The introduced rabbit platform and new staining techniques together with the use of a 3.0T clinical scanner for cMRI enabled visualization of MI components and may contribute to translational cardiac imaging research for improved theranostic management of ischemic heart disease.
Keywords: area at risk, myocardial infarction, rabbits, MRI, Evans blue
Introduction
Among the tissue components in myocardial infarction (MI), the area at risk (AAR) refers to the region that becomes potentially at risk for infarction after occlusion of its supplying coronary artery (CA) which is thought to encompass both irreversibly damaged MI-core and reversibly injured salvageable zone (SZ)1. The myocardium salvage index (MSI) is defined by a ratio of the SZ over the AAR, which has been used as a key predictor for cardiac death after acute MI and for the benefit of reperfusion therapy in preclinical and clinical settings 2, 3. Therefore, accurate determination of the AAR and MI-core is crucial for further deduction of the SZ or MSI and management of ischemic heart disease (IHD).
Attempts have been made to visualize the AAR and to distinguish irreversible MI-core from injured but reversible myocardium by using echocardiography 4, computed tomography 5 and nuclear imaging6, which yet suffer from limited acoustic windows, ionizing radiation and/or poor resolution. During recent decades, cardiac magnetic resonance imaging (cMRI) has evolved into a robust technique with high spatial and temporal resolutions, and is widely used for detection of IHD and assessment of myocardial perfusion by integrating anatomical, functional and metabolic information in a single session 7, 8. Delayed contrast enhanced cMRI (DE-cMRI) has been routinely applied for detection and quantification of MI9,10.
However, cMRI in IHD can still be challenging11-14. Several cMRI methods are available for AAR evaluation. First, T2 weighted imaging (T2WI) reveals hyperintense myocardial edema as an indicator to delineate and quantify AAR, but with controversies 12. Second, first-pass perfusion weighted imaging (PWI) demarcates normal myocardium from the AAR utilizing dynamic contrast enhancement 15, which requires ultrafast techniques to increase temporal resolution to catch the first-pass of injected contrast agent. So far, PWI has been mainly performed in larger animals such as dogs, sheep, and pigs, due to their lower heart rates and larger cardiac mass 16, 17. Third, cMRI coronary angiography has been validated for estimation of the AAR, which is based on Aldrich score for individual assessment of the length and caliber of the coronary arteries 18. And fourth, more recently, endocardial surface length (ESL) measured by contrast-enhanced cMRI has been reported for AAR evaluation 19, though appropriate validation appears necessary.
Experimentally, endeavors have been made to directly stain the MI and AAR in animal models with different methods using dyes or tracers as postmortem “gold” references. At the end of most experiments, Evans blue (EB) was retrograde injected during re-occlusion of the coronary artery branch to define the AAR as a filling defect by the dye, meanwhile cardiac viability was assessed by triphenyltetrazolium chloride (TTC) enzymatic histochemical staining 20, 21. Radiolabeled or fluorescent microspheres were injected during re-occlusion to delineate AAR 22. However, these methods have their own limitations. For instances, water-soluble EB dye has recently been found with necrosis affinity 23-25 and may interfere with subsequent TTC staining 26, of which the reliability was debated 27, 28. Radiolabeled microspheres impose potential hazard for radiation exposure, while colored microspheres require tissue lysis for counting without morphometric information. Besides, these techniques often determine either AAR or MI, but few can adequately visualize both regions to estimate myocardial salvageability. Differentiation between MI-core and SZ within AAR remains troublesome. Therefore, there still exist rooms for further technical improvement.
Given the above-specified problems, by using an established rabbit model of acute MI and a technical platform 29, the present experiment was conducted with the following aims: 1) to develop a multifunctional staining technique as a postmortem standard reference for simultaneous visualization of the AAR, MI-core and SZ; 2) to validate the feasibility of first-pass PWI in rabbits as medium size animals at a clinical 3.0T scanner; 3) to compare first-pass PWI for AAR evaluation under both occlusive and reperfused conditions; and 4) to correlate the AAR, MI-core and SZ derived from in vivo cMRI with those parameters from ex vivo imaging and histopathology.
Methods
Animal model of reperfused myocardial infarction
A total of 15 New Zealand white rabbits (Animal Facility, KU Leuven) weighing about 4.5 kg were recruited. The experimental protocol was approved by the Animal Care and Use Committee of KU Leuven, Belgium.
The model of acute reperfused MI was prepared according to a previously introduced method with slight modifications 29. Briefly, after sedation, tracheal intubation and mechanical ventilation, the rabbit received intravenous (IV) infusion of pentobarbital (Nembutal, Sanofi Sante Animale, Brussels, Belgium) at 40 mg/kg/h to maintain anesthesia for open-chest operation. To mimic more closely clinical scenarios, a coronary artery (CA) branch, either left anterior descending (n=7) or left circumflex (n=8), was exposed after opening the left 4th intercostal thoracic wall and pericardium. A 1/2 circle triangular needle (Sutura, Inc. Fountain Valley, CA, USA) with two eyes at the end was used to place 2 silk sutures underneath the CA branch for making removable coronary ligation in vivo and precise re-ligation ex vivo. The thicker 2-0 silk suture was used for CA ligation and reperfusion, while the thinner 5-0 suture was spared for later CA re-occlusion to facilitate multifunctional staining. MI was induced by tying the thicker suture with a single detachable knot for 90 minutes, and CA reperfusion was achieved by pulling the exteriorized end of suture in the closed-chest condition as previously detailed 29, 30. The ECG was monitored (Accusync® 71, Milford, Connecticut, USA) to detect arrhythmia, which if present was treated with Lidocaine IV at 2 mg/kg. Buprenorfine hydrochloride (Temgesic; Schering-Plough, Brussels, Belgium) of 0.216 mg was intramuscularly injected to relieve pain. All the animals were allowed to recover and kept alive till euthanasia by overdose of Nembutal.
Preparation of the dyes for multifunctional staining
The two staining dyes were prepared. First, 1% Evans blue (EB, Sigma‐Aldrich, USA) solution was made by dilution with sterile physiological saline (0.9% NaCl), stored at 4 °C for later use, and IV injected at 0.5 ml/kg to specifically stain necrosis or MI-core in vivo, which is a newly validated usage that differs from what reported previously for this dye 30. Secondly, a novel custom-made dye called red iodized oil (RIO) 30 was formulated by diluting 20 mg oil-red-O dye (Sigma-Aldrich, USA) in 100 ml of commercially available iodized oil of any brand such as Lipiodol ultra fluid (Guerbet, France), which is also known as ethiodized oil consisting of 30-40% iodine in poppyseed oil originally used as a contrast agent to outline structures for radiography and in combination for transarterial chemoembolization of malignant tumors 31.
Experimental protocol
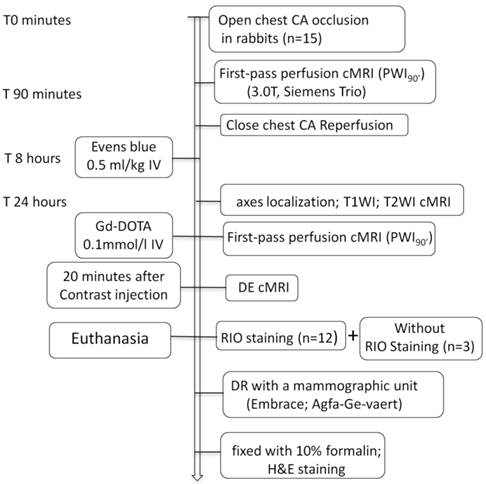
As illustrated in Figure 1, 15 rabbits underwent open-chest CA occlusion for 90 minutes and close-chest reperfusion to induce MI. The cMRI first-pass perfusion weight imaging (PWI90') was first time acquired before pulling the exteriorized end of suture for reperfusion. After 8 hours, EB solution was IV injected for later postmortem localization of MI-core. Sixteen hours later, all animals were subjected to cMRI of T1WI, T2WI, first-pass PWI (PWI24h) and DE sequences. Upon completion of cMRI, 12 animals were sacrificed for RIO staining and the other 3 served as the blank controls. The excised hearts were sliced into 3-mm sections for postmortem morphological and quantitative analyses.
Flowchart of study protocol. CA: coronary artery; cMRI: cardiac magnetic resonance imaging; T1WI: T1 weighted imaging; T2WI: T2 weighted imaging; DE: delayed enhancement; RIO: red iodized oil; DR: digital radiography; H&E: hematoxylin and eosin; IV: intravenous; Gd-DOTA: gadolinium-tetraazacyclododecanetetraacetic acid.
MR Imaging
The rabbit was gas-anesthetized through a mask with 2% isoflurane in the mixture of 20% oxygen and 80% room air, and placed supinely in a holder. Using a commercial 8-channel phased array knee coil, the rabbit was imaged at a 3.0T clinical MRI scanner (Trio, Siemens, Erlangen, Germany) with a maximum gradient capability of 45 mT/m. The cMRI was triggered by both ECG and respiration using a small animal monitoring and gating system (SA Instruments, Inc. Stony Brook, New York). All data were acquired during free breathing of the animal. Six to 10 short-axial slices of the left ventricle (LV) were acquired with a slice thickness of 3.0 mm without gap for all the MRI sequences. Turbo spin echo (TSE) T1WI/T2WI sequences were applied for cardiac morphology and edema with the imaging parameters of TR: 621/750ms; TE: 15/74ms; FOV: 240×195 mm²; FA: 180°; and in-plane resolution: 0.9×0.9 mm². After IV injection of gadolinium-tetraazacyclododecanetetraacetic acid (Gd-DOTA, Dotarem®, Guerbet, France) at 0.2 mmol/kg, three contiguous short-axis first-pass PWI measurements were acquired using segmented turbo-FLASH sequence with 80 dynamic acquisitions with parameters of TR/TE: 241.96/1.95ms; FOV: 240×180 mm²; TI: 150 ms; flip angle: 15°; matrix: 128×90 mm²; and in-plane resolution: 1.88×1.98 mm². After 20 min, the images of DE-cMRI were acquired by a 3D segmented k-space inversion recovery turbo fast low angle shot (IR-turbo-FLASH) sequence with parameters of TR: 396ms; TE: 1.54ms; TI 360ms; FOV: 240×180 mm²; FA: 15°; and in-plane resolution: 1.1×0.8 mm² 32.
Postmortem procedures
Macroscopic Multifunctional staining
Staining techniques using the two dyes of EB and RIO were applied to visualize, locate and delineate the real AAR, MI-core and SZ simultaneously. While the MI-core was already stained by the intravital necrosis avid dye EB, the bifunctional RIO dye was aimed to 1) demarcate well perfused normal myocardium as an oil-red-O stained reddish region and the SZ as an unstained region, and 2) define normal myocardium as a contrast-opaque region and the AAR as a nonopacified region on DR. Briefly, after in vivo cMRI, the rabbit was IV injected with Heparin at 300 IU/kg to prevent coagulation. By euthanasia and thoracotomy, the heart was excised with a section of the aortic arch isolated and pericardial tissue trimmed. For retrograde infusion of RIO dye, a catheter filled with 0.9% saline was inserted into the aorta and anchored with its tip above the aortic valves, the other side was connected to a 10 ml syringe fixed in the injection bump (BD PILOT, Becton Dickinson Infusion System, France). Under a pressure around 100 mmHg, 10 ml normal saline was infused to wash out remaining blood in the vascular bed. Then, the 5-0 suture spared at the coronary occlusion site during open-chest operation was tightened for causing re-occlusion, and the AAR was determined by infusion of 4 ml of RIO dye for 15 minutes. By this staining, the normal myocardium stained brick red and the AAR remained uncolored 30.
Digital radiography (DR)
After RIO infusion, the heart was imbedded in a mold with 3% agar and cut into 6-8 serial slices of 3.0 mm to match with the corresponding short axis cMRI, and then exposed to DR at 25KVand 18mA with a mammographic unit (Embrace; Agfa-Ge-vaert, Belgium).
Histology
After photography by a digital camera, the heart sections were fixed with 10% formalin for 24 hours, paraffin-imbedded, and cut into 5 μm slices that could be mounted entirely on standard glass slides, followed by hematoxylin-eosin (HE) staining for macroscopic and microscopic assessment. Photomicrographs were interpreted cross-referencing to the corresponding cMRI, and multifunctional staining results.
Imaging analyses
cMRI and postmortem data were analyzed using an off-line workstation with SyngoMR A30 (Siemens) and Image J 1.38x (NIH) software with planimetry method 29, 30 by 3 blinded observers.
Measurements of MI-core
The in vivo MI-core was assessed semi-automatically on DE-cMRI by counting all enhanced pixels within each short-axis slice. Enhanced pixels were defined as the pixels with signal intensity (SI) more than 5 SDs above SI of the remote normal myocardium 33. The dark area in the center of the hyperenhanced regions due to microvascular obstruction was also included. The ex vivo MI-core was determined as EB-stained region on heart sections. The size of MI-core was expressed as a percentage size (%) of the whole LV volume.
Measurements of AAR by different techniques
The AAR was defined by 1) the hyperintense region on T2WI; 2) the perfusion deficit regions on first-pass PWI acquired pre- (PWI90') and post (PWI24h) reperfusion; 3) the non-opaque region in DR; and 4) the RIO-unstained region on heart sections. The AAR was quantified on T2WI by delineating the area with SI of 2 SDs above the mean SI obtained in the remote myocardium 33. If present, any central hypointense dots within hyperintense area due to hemorrhagic MI was included. On the first-pass PWI, areas that showed distinct and constant low enhancement compared with the enhanced normal myocardium were considered with perfusion defect. The AAR size was expressed as the percentage of LV volume.
Myocardial salvage index (MSI)
The MSI was defined as the ratio of the percentage SZ over the percentage AAR, and calculated by the equation: MSI= (AAR% - MI-core%)/AAR%.
PWI analyses
The region of interest (ROI) was positioned separately within left ventricular cavity (VC), ventricle septum (VS) of normal myocardium and the AAR to depict dynamic signal changes on first-pass PWI-cMRI. Signal intensity (SI) versus time curves obtained pre (90') and post (24h) reperfusion from VC, VS and AAR were plotted to generate cardiac PWI parameters including time-to-the-peak (TTP) enhancement, peak intensity value (PIV), initial absolute maximal upslope (ISabs), and area under the curve within 15 minutes (AUC15') of contrast injection. All the data from PWI was in-house implemented in MATLAB® (The MathWorks, Inc., Novi, MI).
Measurement of perfusion density rate (PDR)
The PDR was derived from DR images by density measurement of the heart sections using the same software Image J 1.38x. The blank myocardial density was measured without RIO staining from the 3 controls. The AAR of low density and the normal myocardium of high density were delineated in all RIO-stained sections with an operator-defined region of interest. The mean gray value (GV) of all sections were automatically generated and normalized by the background GV. PDR% refers to the increased perfusion density relative to background, which was calculated by the following formula: PDR % = (GVregion of interest-GVblank myocardial density)/GVbackground × 100.
The AAR and the normal myocardium were compared by their PDRs to reflect coronary perfusion levels. We also compared the in vivo (AUC15) and ex vivo (PDR) perfusion parameters to functionally quantify AAR.
Statistics
Numerical data were expressed as mean ± standard deviation. Between two techniques for evaluation of MI components, results were compared with paired t test after checking for normal distribution of each data sub-set using a Shapiro-Wilk test. A clustered linear regression and Bland-Altman analysis were used to compare correlation and agreement of the MI-core in DE-cMRI and multifunctional staining or pathology. Linear regression was used to assess the correlation between two different techniques on evaluation of AAR. All tests were two tailed. A difference was considered statistically significant if the p value was less than 0.05. The statistical analyses were performed with Analyse-it ®2.14 for Excel, GraphPad Prisma® 5.0.
Results
General aspects
All animals survived the systemic anesthesia, open-chest surgery for inducing acute MI and subsequent cMRI. They all tolerated well intravenous administrations of EB dye and contrast agent. The presence of MI in all cases was suggested in vivo by characteristic ECG profiles and abnormal SI at the CA-insulted LV territory on T2WI, PWI, and DE-cMRI, and proven postmortem by multifunctional staining and histopathology.
Visualize and stratify infarct components by cMRI and multifunctional stainings
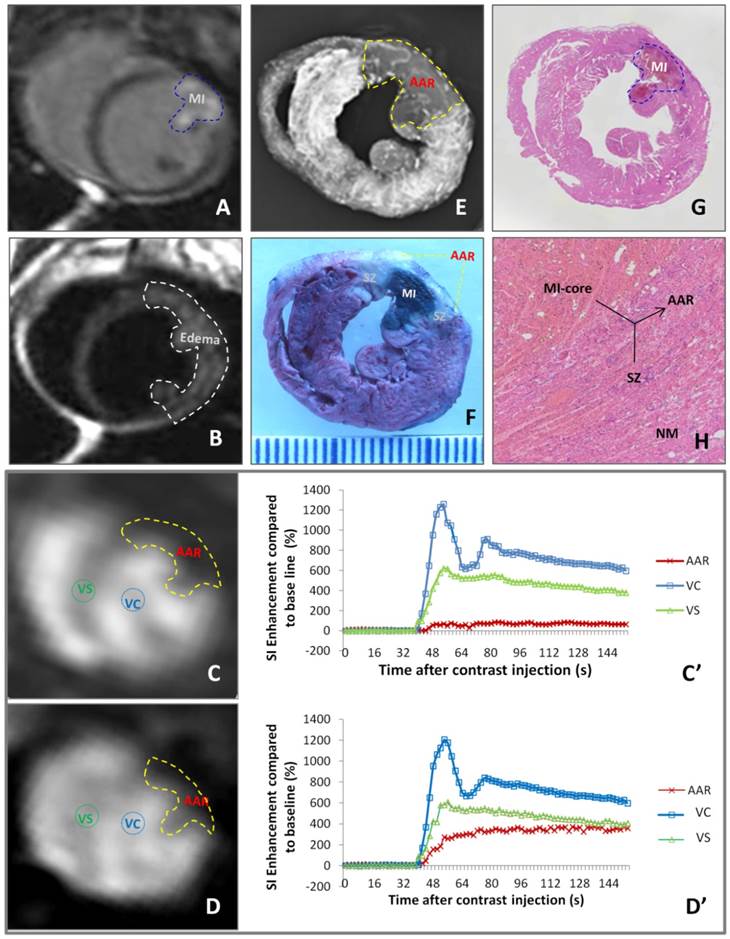
As exemplified by Figure 2, different imaging techniques demonstrated a case of reperfused MI. DE-cMRI indicated the necrotic MI-core as a transmural hyperenhanced zone involving a part of anterior papillary muscle (Fig. 2A). T2WI revealed a more extensive hyperintense area, suggestive of edematous AAR (Fig. 2B). PWI90' and PWI24h depicted the perfusion deficits or the AARs of different sizes (Fig. 2C,D), both larger than the MI-core (Fig. 2A) but smaller than the area of edema (Fig. 2B). Reduce of blood perfusion in AAR relative to normal ventricular septum was evidenced by SI-time curves (Fig. 2C',D'). The deficit on PWI90' (Fig. 2C) matched well with the non-opaque region on ex vivo DR (Fig. 2E) and non-stained region by RIO-dye (Fig. 2 F). The in vivo necrosis avid dye EB-stained zone (Fig. 2F) simulated closely DE-cMRI-defined MI-core (Fig. 2A). The SZ appeared whitish in-between the blue-stained MI-core and red-stained normal heart (Fig. 2E). These imaging findings were proven by HE stained macro- (Fig. 2G) and microscopic (Fig. 2H) histopathology.
Evaluation of myocardial infarction core (MI-core), area at risk (AAR) and salvageable zone (SZ) in a rabbit with reperfused MI by in vivo and ex vivo imaging techniques and dynamic imaging quantification. A: DE-cMRI displays the MI-core as a transmural hyperenhanced area involving anterior papillary muscle; B: T2WI shows an extensive hyperintense region in the anterolateral wall; C: PWI90' presents a perfusion deficit region by the left anterior descending (LAD) artery ligation, which appeared smaller than T2WI-abnormal region (B) but larger than the MI-core (A); D: PWI24h presents a perfusion deficit region after the LAD reperfusion, which is somewhat smaller than that with PWI90'; C' and D': The SI-time curves derived from PWI90' (C) and PWI24h (D) indicate a slower and lower contrast enhancement in the ARR compared to that in ventricular septum (VS) and ventricular cavity (VC) with apparently increased perfusion in the AAR by PWI24h; E: DR of the RIO-stained heart section shows a filling defect with few collateral vessels in the anterolateral wall in contrast to the rest of opaque left ventricle; F: photograph of the heart section stained by multifunctional staining depicts the MI-core as a EB-stained blue lesion simulating what is seen in A, shows normal ventricular wall in red leaving the AAR (including the blue MI-core) unstained, which perfectly matched with the AAR in C and E, and whitish zones are suggestive of the SZ; G: photomacroscopy of HE-stained heart slice views the MI-core as a hemorrhagic infarct similar in size with the blue lesion in F; H: photomicroscopy (×100) of HE-stained heart slice confirms the presence of the AAR (necrotic MI-core plus the viable but inflammatory SZ) and remote normal myocardium (NM).
In vivo and ex vivo quantification of myocardial infarction core
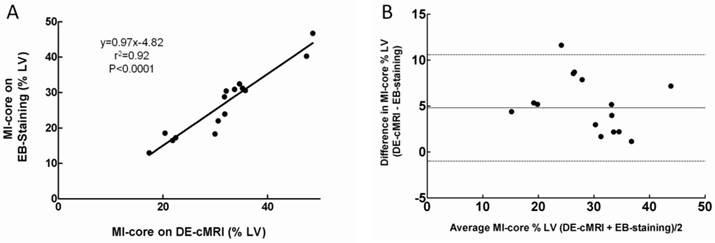
The location and extent of the MI-core were clearly shown as the hyperenhanced region on DE-cMRI and EB-stained region on heart sections in all cases. MI-core (% LV) ranged from 10.12% to 48.56% (mean 31.13±8.55%) and from 8.7% to 46.61% (mean 29.80±7.97%) as derived from DE-cMRI and EB intravital staining, respectively. Linear regression analysis showed a good correlation between DE-cMRI and EB staining (r2=0.92) for defining the MI-core (Fig 3A). By Bland-Altman analysis, there was a 2.4% bias with 95% CIs of -2.8% to 10.4%, indicating good agreement of the two methods (Fig. 3B). Although there was no significant difference (p=0.74) between them (Table 1), in comparison to EB necrosis staining, DE-cMRI tended to slightly overestimate the real MI-core likely due to the nonspecific nature of the contrast agent Gd-DOTA.
Correlation of MI-core determined by DE-cMRI and EB-staining. A: Plots of linear regression analysis on MI-core determined by DE-cMRI versus EB staining. B: Plots of Bland-Altman analysis on the differences between the methods against their means: horizontal lines represent limits of agreement between DE-cMRI and EB-staining evaluations of the MI-core.
The area at risk (AAR), myocardial infarction (MI) core and myocardial salvage index (MSI) determined by different cMRI techniques in comparison to postmortem multifunctional staining histopathology.
| cMRI | Postmortem | ||||
|---|---|---|---|---|---|
| AAR | T2WI | 56.63±8.87%* | DR | 38.07±8.4% | |
| PWI90' | 40.53±6.87% | RIO | 38.52±8.58% | ||
| PWI24h | 36.39±5.06% | ||||
| MI-core | DE | 31.13±8.55% | EB | 29.80±7.97% | |
| MIS | (T2WI-DE)/T2WI | 45.52±7.5%* | (DR-EB)/DR | 21.97±9.41% | |
| (PWI90'-DE)/PWI90' | 24.17±9.5% | (RIO-EB)/RIO | 22.68±9.65% | ||
| (PWI24h-DE)/PWI24h | 15.15±7.34%* | ||||
Data are presented as mean±SD
cMRI: cardiac magnetic resonance imaging; T2WI: T2 weighted imaging; PWI: perfusion weighted imaging; DE: delayed enhancement; DR: digital radiography; RIO: red-oil-O stained region; EB: Evens blue stained region
*: significantly difference (p<0.05) as compared with postmortem.
Comparing area at risk (AAR) and myocardial salvage index (MSI) with different techniques
The mean AARs (% LV) determined by T2WI, PWI90', PWI24h, DR and RIO staining were 56.93±8.87%, 39.93±9.51%, 36.44±5.31%, 38.17±15.98% and 38.82±14.41%, respectively (Table 1). Although they had good correlations (T2WI vs PWI90', r2=0.74; T2WI vs PWI24h, r2=0.73; T2WI vs DR, r2=0.69; PWI90' vs PWI24h, r2=0.70; PWI90' vs DR, r2=0.79; PWI24h vs DR, r2=0.68; DR vs RIO, r2=0.99), The PWI90' showed the AAR with the closest size compared to multifunctional staining data, thus with the greatest accuracy for detection of AAR, whereas the AAR by T2WI was significantly greater than that by multifunctional staining. But, the AAR by PWI24h was smaller than that by PWI90', apparently due to CA reperfusion.
The contour of non-opaque region on DR was almost identical to that of RIO staining (r2=0.99, 0.46% bias with 95% CIs of -0.85% to 1.75%), suggesting the accuracy of using this multifunctional dye.
As shown in Table 1, MSI based on T2WI (45.52±7.5%) or PWI24h (15.15±7.34%) was significantly higher (P<0.01) and lower (P<0.01) compared to that on multifunctional stainings, i.e. DR (21.97±9.41%) and RIO (22.68±9.65%). However, there was no significant difference on the MSI between in vivo PWI90' and ex vivo multifunctional staining method (p=0.7), suggesting that PWI90' is more accurate than T2WI and PWI24h to define the MSI as well as the AAR.
Quantifying regional perfusion in vivo and perfusion density rate (PDR) ex vivo
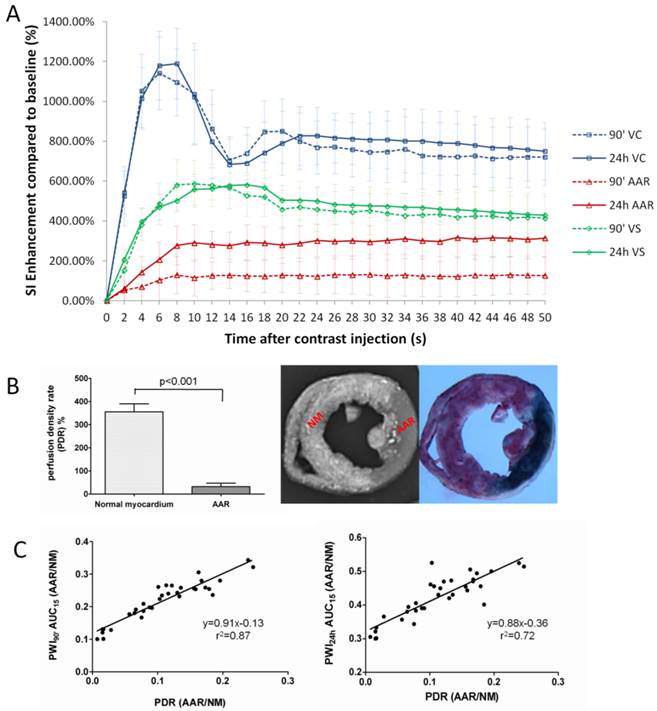
The SI-time curves revealed dynamic SI changes within 50 seconds after contrast administration during 90' CA ligation and 24h reperfusion in VC, VS and AAR (Fig. 4A). The PWI of VC was characterized by a rapid contrast wash-in and wash-out, while the PWI of VS with normal myocardium displayed a constantly higher SI than that of AAR in both CA occluded and CA reperfused conditions. The perfusion in the AAR was apparently lower during 90' occlusion in comparison to that after 24h reperfusion. As summarized in Table 2, the PWI parameters of TTP, PIV, ISabs, and AUC15' differed significantly between AARs by PWI90' and PWI24h (p<0.001).
Quantification of regional perfusion weighted imaging (PWI) in vivo and perfusion density rate (PDR) ex vivo. A: Time-SI contrast enhancement curves of the left ventricular cavity (VC), normal ventricular septum (VS) and area at risk (AAR) defined by firs-pass PWI90' (dotted lines) and PWI24h (solid lines). The VC (blue lines) is characterized by a rapid contrast wash-in and wash-out; VS (green lines) presents a moderate contrast enhancement; whereas the AAR (red lines) shows slower and lower signal intensity rise. The perfusion in the AAR on PWI90' appears obviously lower than that on PWI24h. B: comparison of perfusion density ratio (PDR) between the AAR and normal myocardium. Coronary artery occlusion causes a significant decrease of blood perfusion in ischemic region (AAR) compared to non-ischemic normal myocardium (P<0.001). C: The linear regression analyses show good correlations on AAR/Normal myocardium between in vivo and ex vivo methods (left: PWI90' AUC15' vs PDR; right: PWI24h AUC15' vs PDR).
The parameters of different regions from first-pass perfusion imaging (PWI) for quantitative evaluation of myocardial perfusion after acute myocardial infarction
| Regions | TTP (sec) | PIV (SI) | ISabs (SI/sec) | AUC15 (SI*sec) |
|---|---|---|---|---|
| AAR90' | 62.69±36.46* | 1.87±0.32* | 10.37±2.43* | 11.44±9.89* |
| AAR24h | 35.66 ±22.13 | 4.10±1.66 | 20.32±11.66 | 23.91±10.96 |
| VS90' | 12.30±6.29 | 6.89±0.88 | 45.12±13.97 | 51.20±9.56 |
| VS24h | 13.46±8.61 | 6.17±0.73 | 43.08±14.07 | 54.62±8.53 |
| VC90' | 8.27±2.34 | 14.56±2.12 | 96.88±25.90 | 133.27±20.17 |
| VC24h | 7.80±2.7 | 13.98±1.59 | 94.01±29.63 | 123.11±16.62 |
Data are presented as mean±SD
AAR: area at risk; VS: ventricular septum; VC: ventricular cavity; SI: signal intensity; TTP: time to peak; PIV: peak intensity value; ISabs: initial absolute maximal upslope; AUC15: area under curve from base to 15 seconds.
*: significant difference (P <0.001) as compared with AAR24h
After retrograde injection of RIO dye when the CA branch was re-ligated, the PDR of normal myocardium and AAR were measured as 350.6±33.1% and 31.2±15%, i.e. more than 11-times difference in blood perfusion, suggesting insufficient collateral blood supply during the 90-min CA occlusion (Fig. 4B). In vivo AUC15' of PWI90' showed a closer correlation than AUC15' of PWI24h relative to the PDR derived from ex vivo stainings (Fig. 4C).
Histopathological findings
Macroscopic view of the HE stained slide clearly marked the reperfused hemorrhagic MI-core in contrast to the lightly stained surrounding myocardium (Fig. 2G), which topographically simulated the heart section with an EB-stained lesion (Fig. 2E). Microscopic (magnification ×100) view of HE stained slide further proved the presence of the necrosis core, adjacent AAR with inflammatory infiltration and remote normal myocardium (Fig. 2H).
Discussion
In ischemic heart disease, accurate determination of myocardial salvage index (MSI) through measuring the AAR and MI-core beforehand is essential for both medicinal and interventional reperfusion therapies 2. In the present study, we studied myocardial AAR and MI-core in a rabbit model of acute reperfused MI by using cMRI and histopathology. In particular, a new multifunctional staining technique was applied as a gold reference to identify both the AAR and MI-core and to calculate MSI. The major contributions of this study are: 1) the newly identified necrosis-avid property was confirmed with the intravital dye EB 23-25, which was successfully injected in vivo as a biomarker to delineate MI-core on postmortem sections; 2) the first-pass PWI was validated, both before (PWI90') and after (PWI24) CA reperfusion, in rabbits as a medium size animal model using a 3.0T clinical MR scanner; 3) a multifunctional staining method was newly developed as a standard reference to stratify ex vivo the AAR, MI-core and SZ on the same cardiac section; 4) comparing to other cMRI techniques, first-pass PWI90' most precisely depicted the AAR for MSI calculation; and 5) the PDR was 11 times lower in the AAR compared to the normal myocardium, suggesting both functions of morphometry and perfusion quantification for the new staining method.
Necrotic core determined by cMRI and EB-staining
The infarcted myocardium or necrotic MI-core can be identified by DE-cMRI after IV injection of a gadolinium chelate, which preferentially distributes in the enlarged extracellular space of damaged myocardium 9, 34. To verify DE-cMRI findings, triphenyltetrazolium chloride (TTC) staining has been the mostly used gold standard for macroscopic identification of viable myocardium. However, TTC staining only indirectly displays necrotic MI-core by a negative staining. Besides, TTC is known to be toxic and may cause instant heart beat cessation, and cannot be used for intravital staining 35. Therefore, in this experiment we used a synthetic dye EB with known safety 36 for IV injection to stain in vivo and inspect ex vivo the MI-core macroscopically. We found that EB-stained region highly corresponded to the MI-core showed on DE-cMRI and confirmed by histology. EB has been widely used as a non-toxic and low cost dye to study hemodynamics due to its strong albumin-binding capacity 36. It was also used to evaluate blood vessels and cellular membrane permeability in different pathologies 37, 38, and was found more sensitive than an antibody to serum albumin to detect membrane permeability in damaged muscle 38. Matsuda et al reported that EB dye could identify damaged skeletal muscular dystrophy 39. More recently, EB has been validated with high necrosis avidity and used to mark necrotic tissues in rat models of liver infarction and tumor necrosis 24, 25. At present, the use of EB for direct labeling myocardial necrosis in correlation with in vivo cardiac imaging has not been reported. Although albumin- bond EB deposited in necrotic tissues was proposed as a hypothesis 38, the exact mechanisms behind the necrosis avidity of EB still need to be elucidated. Indeed, systemic injection of EB in animal models of pathologies provides a clear-cut distinction between viable and necrotic tissues 24, 25, which proved crucial for tissue stratification during macroscopic inspection in this study.
T2WI and PWI on AAR evaluation
T2WI measurement has been reported to closely correlate to coronary angiography 19, fluorescein staining 40, fluorescent microspheres 41 and first-pass PWI-cMRI 42 to define the AAR in clinical and preclinical studies, while some studies found that T2WI only delineated the area of acute MI rather than the AAR 43,44. However, direct comparison of T2WI-abnormal region with the AAR defined by histopathology has not been reported. PWI-cMRI offers dynamic information about the passage of a contrast medium through the entire heart for the assessment of relative blood perfusion in ischemic versus remote normal myocardium. In this study, we evaluated T2WI, PWI90' and PWI24h for the determination of AAR. The areas of signal abnormalities were correlated well between T2WI and PWI, and both were significantly larger than the MI-core. Using DE-cMRI as an in vivo indicator and EB staining as an ex vivo marker for the MI-core, we found that the first-pass PWI90' was more accurate than T2WI to depict the AAR, extrapolate the SZ and calculate the MSI. From the imaging perspective, T2WI has been shown to successfully visualize infarct-related edema, and results indicated its clinical applicability for differentiating acute from chronic infarctions 11. In acute MI, water contents are increased in both extra- and intracellular compartments of injured but viable myocardium, resulting in edema near the peri-infarct zone 45. This effect lasts for a few days following initial ischemic insult. Within acutely infarcted myocardium, there is a conversion of intracellular space into extracellular space as a result of cytolysis 45. Because of the increased water content and mobility, both infarct and peri-infarct zones appear hyperintense on T2WI 41. Choi et al. showed that the high SI on T2WI reflects both irreversible infarct and reversibly injured but essentially viable peri-infarct zone 16, 17. Aletras et al. showed a high accuracy of T2WI in identifying the spatial extent of the AAR 41. However, Mewton et al. reported that the two different T2WI techniques overestimated post-reperfusion AAR due to the presence of edema outside of the boundaries of the AAR 1, which appears in agreement with our findings of this study. Thus, to answer the unsettled clinical question of which is more accurate for AAR evaluation, T2WI or PWI, we are inclined to conclude that PWI may mildly underestimate the AAR (especially after coronary reperfusion), but T2WI may largely overestimate the AAR in acute MI.
The AAR refers to a territory perfused by the insulted branch of coronary artery, and it would be inappropriate to define the AAR by using a nonperfusion-based technique such as T2WI. Therefore, in this study, we tried to use first-pass PWI to detect perfusion deficit in rabbits with acute reperfused MI. The profiles of Gd-DOTA first-passage were compared in different regions and analyzed to extract perfusion parameters in ventricular cavity, normal myocardium and hypoperfused AAR. In the AAR, signal increase was less pronounced and delayed. The delayed entrance and persistent accumulation of bolus-injected Gd-DOTA in the AAR and particularly MI-core are likely due to an increased distribution volume secondary to the loss of cell membrane integrity and prolonged wash-in and wash-out kinetics following decreased functional capillary density in the dominated coronary region 34. The significant differences of parameters on the AAR derived from PWI90' and PWI24h in our study suggest lower contrast distribution dynamics in the AAR during CA occlusion compared to that with 24 hours CA reperfusion. This confirms the validity of PWI90' as in vivo standard reference for AAR evaluation in this rabbit model of MI. There was no significant difference between the hypoenhanced area on first-pass PWI90' and the ischemic area defined by RIO-dye, both of which indicate the AAR that is consistently larger than the MI-core defined by DE-cMRI and pathology. This is the first study where PWI was elaborated at a clinical 3.0T MR scanner to evaluate perfusion deficit in a midsized animal model of MI. Comparing to pigs and dogs, rabbits are of multiple advantages and can provide an ideal animal model for cardiovascular imaging research 29, 46-48. Rabbit models are beneficial due to their low costs, high reproductivity, and ease of housing and handing during the experiment. Relative to rats and mice, their larger size greatly facilitates surgical and postsurgical procedures. Compared to larger animals, rabbits still retain clinically relevant cardioelectrophysiology but present lower risk of ventricular fibrillation after CA occlusion and reperfusion, in addition to their less labor-intensiveness in the experiment. Another advantage of using rabbits for cardiac imaging study is the fact that a transverse section of the entire heart can be mounted perfectly on an ordinary glass slide for quantitative microscopic analysis 29, 32.
Multifunctional staining techniques
An adequate staining method may help draw clear borderlines between normal myocardium and various pathologies including the AAR, necrotic MI-core and ischemic SZ, all of which are crucial for detailed interpretations of cardiac imaging findings. Many techniques can determine MI-core or AAR 20, 21, 49-51, but few can image both for deducing the SZ. In this study, we introduced a new multifunctional staining technique that determines both the MI-core and AAR by combined use of EB dye and a postmortem bifunctional RIO dye 30 which to our knowledge has not been reported in the literature. This method has triple functions: 1) depict the MI-core within the AAR in blue by IV injected EB after coronary occlusion/reperfusion in vivo; 2) stain the normal myocardium in red by the lipophilic oil-red-O of the custom-made RIO dye, leaving the AAR uncolored; and 3) image by DR and quantify by densitometry the opaque normal myocardium and the non-opaque AAR by utilizing the iodized oil of the RIO dye. Thus, these synergic functions facilitated delineation, quantification and comparison for comprehensive morphometry of all the MI-related elements including the AAR, MI-core and SZ as demonstrated herewith.
The perfusion density rate (PDR) was a side-product of the above-described multifunctional staining as a parameter to evaluate the collateral blood flow to the AAR. Using the PDR derived from DR microangiography, the blood perfusion to viable versus necrotic tumors was evaluated 52. In our experiment, the PDR was significantly lower in AAR, about 11% of that in normal myocardium, which is close to the results of Connelly et al on myocardial blood flow measured by radioactive microspheres on a similar animal setting 53.
Myocardial salvage index (MSI) as a potential outcome predictor
The accurate identification of the SZ within the AAR in acute MI is crucial to plan upcoming reperfusion therapies. Our study suggests that in the experimental setting the SZ can be assessed by comparing fist-pass PWI (or T2WI in clinical setting) and DE-cMRI, which can be quantitatively expressed by the MSI as a potential outcome predictor for the success of revascularization therapy.
In conclusion, the methodology involving a rabbit model and a new multifunctional staining technique as introduced in this study may contribute to translational cardiac imaging research and eventually help to improve the theranostic management of ischemic heart disease.
Acknowledgements
This study was partially supported by the grants awarded by a EU project Asia-Link CfP 2006-EuropeAid/123738/C/ACT/Multi-Proposal No. 128-498/111, the KU Leuven Molecular Small Animal Imaging Center MoSAIC (KUL EF/05/08) and KU Leuven the center of excellence In vivo Molecular Imaging Research (IMIR). The corresponding author Ni Y is currently a Bayer Lecture Chair holder.
Competing Interests
The authors have declared that no competing interest exists.
References
1. Mewton N, Rapacchi S, Augeul L. et al. Determination of the myocardial area at risk with pre- versus post-reperfusion imaging techniques in the pig model. Basic Res Cardiol. 2011;106:1247-1257
2. Berry C, Kellman P, Mancini C. et al. Magnetic resonance imaging delineates the ischemic area at risk and myocardial salvage in patients with acute myocardial infarction. Circ Cardiovasc Imaging. 2010;3:527-535
3. Darsee JR, Kloner RA, Braunwald E. Demonstration of lateral and epicardial border zone salvage by flurbiprofen using an in vivo method for assessing myocardium at risk. Circulation. 1981;63:29-35
4. Villanueva FS, Glasheen WP, Sklenar J. et al. Characterization of spatial patterns of flow within the reperfused myocardium by myocardial contrast echocardiography - implications in determining extent of myocardial salvage. Circulation. 1993;88:2596-2606
5. Zhu LJ, Gao Y, Mohan V. et al. Estimation of myocardial volume at risk from CT angiography. Proc SPIE. 2011:7963
6. Lombardo A, Rizzello V, Galiuto L. et al. Assessment of resting perfusion defects in patients with acute myocardial infarction: comparison of myocardial contrast echocardiography, combined first-pass/delayed contrast-enhanced magnetic resonance imaging and (TC)-T-99m-sestamibi SPECT. Int J Cardiovasc Imaging. 2006;22:417-428
7. Cullen JHS, Horsfield MA, Reek CR. et al. A myocardial perfusion reserve index in humans using first-pass contrast-enhanced magnetic resonance imaging. J Am Coll Cardiol. 1999;33:1386-1394
8. Friedrich MG, Abdel-Aty H, Taylor A. et al. The salvaged area at risk in reperfused acute myocardial infarction as visualized by cardiovascular magnetic resonance. J Am Coll Cardiol. 2008;51:1581-1587
9. Bondarenko O, Beek AM, Hofman MB. et al. Standardizing the definition of hyperenhancement in the quantitative assessment of infarct size and myocardial viability using delayed contrast-enhanced CMR. J Cardiovasc Magn Reson. 2005;7:481-485
10. Kim RJ, Fieno DS, Parrish TB. et al. Relationship of MRI delayed contrast enhancement to irreversible injury, infarct age, and contractile function. Circulation. 1999;100:1992-2002
11. Arai AE, Leung S, Kellman P. Controversies in cardiovascular MR imaging: reasons why imaging myocardial T2 has clinical and pathophysiologic value in acute myocardial infarction. Radiology. 2012;265:23-32
12. Croisille P, Kim HW, Kim RJ. Controversies in cardiovascular MR imaging: T2-weighted imaging should not be used to delineate the area at risk in ischemic myocardial injury. Radiology. 2012;265:12-22
13. Friedrich MG, Kim HW, Kim RJ. et al. T2-Weighted Imaging to Assess Post-Infarct Myocardium at Risk. JACC Cardiovasc Imaging. 2011;4:1014-1021
14. Wright J, Adriaenssens T, Dymarkowski S. et al. Quantification of myocardial area at risk with T2-weighted CMR: comparison with contrast-enhanced CMR and coronary angiography. JACC Cardiovasc Imaging. 2009;2:825-831
15. Atkinson DJ, Burstein D, Edelman RR. First-pass cardiac perfusion: evaluation with ultrafast MR imaging. Radiology. 1990;174:757-762
16. Arteaga C, Revel D, Zhao S. et al. Myocardial "low reflow" assessed by Dy-DTPA-BMA-enhanced first-pass MR imaging in a dog model. J Magn Reson Imaging. 1999;9:679-684
17. Choi SI, Jiang CZ, Lim KH. et al. Application of breath-hold T2-weighted, first-pass perfusion and gadolinium-enhanced T1-weighted MR imaging for assessment of myocardial viability in a pig model. J Magn Reson Imaging. 2000;11:476-480
18. Fuernau G, Eitel I, Franke V. et al. Myocardium at risk in ST-segment elevation myocardial infarction comparison of T-2-weighted edema imaging with the MR-assessed endocardial surface area and validation against angiographic scoring. JACC Cardiovasc Imaging. 2011;4:967-976
19. Ortiz-Perez JT, Meyers SN, Lee DC. et al. Angiographic estimates of myocardium at risk during acute myocardial infarction: validation study using cardiac magnetic resonance imaging. Eur Heart J. 2007;28:1750-1758
20. Michael LH, Entman ML, Hartley CJ. et al. Myocardial ischemia and reperfusion: a murine model. Am J Physiol. 1995;269:H2147-2154
21. Redel A, Jazbutyte V, Smul TM. et al. Impact of ischemia and reperfusion times on myocardial infarct size in mice in vivo. Exp Biol Med (Maywood). 2008;233:84-93
22. Epstein FH, London JF, Peters DC. et al. Multislice first-pass cardiac perfusion MRI: Validation in a model of myocardial infarction. Magn Reson Med. 2002;47:482-491
23. Ni Y, Dymarkowski S, Chen F. et al. Occlusive myocardial infarction enhanced or not enhanced with necrosis-avid contrast agents at MR imaging. Radiology. 2002;225:603-605 author reply 605-606
24. Li J, Cona MM, Chen F. et al. Exploring theranostic potentials of radioiodinated hypericin in rodent necrosis models. Theranostics. 2012;2:1010-1019
25. Wang HJ, Cona MM, Chen F. et al. Comparison between nonspecific and necrosis-avid gadolinium contrast agents in vascular disrupting agent-induced necrosis of rodent tumors at 3.0T. Invest Radiol. 2011;46:531-538
26. Khalil PN, Siebeck M, Huss R. et al. Histochemical assessment of early myocardial infarction using 2,3,5-triphenyltetrazolium chloride in blood-perfused porcine hearts. J Pharmacol Toxicol Methods. 2006;54:307-312
27. Liszczak TM, Hedleywhyte ET, Adams JF. et al. Limitations of tetrazolium salts in delineating infarcted brain. Acta Neuropathol. 1984;65:150-157
28. Vivaldi MT, Kloner RA, Schoen FJ. Triphenyltetrazolium staining of irreversible ischemic-injury following coronary-artery occlusion in rats. Am J Pathol. 1985;121:522-530
29. Feng Y, Xie Y, Wang H. et al. A modified rabbit model of reperfused myocardial infarction for cardiac MR imaging research. Int J Cardiovasc Imaging. 2009;25:289-298
30. Feng Y, Ma Z, Chen F. et al. A bifunctional staining for ex vivo determination of area at risk in rabbits with reperfused myocardial infarction. World J of Methodology. 2013;3:27-38
31. Giunchedi P, Maestri M, Gavini E. et al. Transarterial chemoembolization of hepatocellular carcinoma. Agents and drugs: an overview. Part 1. Expert Opin Drug Deliv. 2013;10:679-690
32. Feng Y, Chen F, Xie Y. et al. Lipomatous metaplasia identified in rabbits with reperfused myocardial infarction by 3.0 T magnetic resonance imaging and histopathology. BMC Med Imaging. 2013;13:18
33. Eitel I, Desch S, Fuernau G. et al. Prognostic significance and determinants of myocardial salvage assessed by cardiovascular magnetic resonance in acute reperfused myocardial infarction. J Am Coll Cardiol. 2010;55:2470-2479
34. Kim RJ, Chen EL, Lima JA. et al. Myocardial Gd-DTPA kinetics determine MRI contrast enhancement and reflect the extent and severity of myocardial injury after acute reperfused infarction. Circulation. 1996;94:3318-3326
35. Sun YY, Yang D, Kuan CY. Mannitol-facilitated perfusion staining with 2,3,5-triphenyltetrazolium chloride (TTC) for detection of experimental cerebral infarction and biochemical analysis. J Neurosci Methods. 2012;203:122-129
36. Foldager N, Blomqvist CG. Repeated plasma volume determination with the Evans Blue dye dilution technique: the method and a computer program. Comput Biol Med. 1991;21:35-41
37. Tidball JG, Berchenko E, Frenette J. Macrophage invasion does not contribute to muscle membrane injury during inflammation. J Leukoc Biol. 1999;65:492-498
38. Hamer PW, McGeachie JM, Davies MJ. et al. Evans Blue Dye as an in vivo marker of myofibre damage: optimising parameters for detecting initial myofibre membrane permeability. J Anat. 2002;200:69-79
39. Matsuda R, Nishikawa A, Tanaka H. Visualization of dystrophic muscle-fibers in mdx mouse by vital staining with evans blue - evidence of apoptosis in dystrophin-deficient muscle. J Biochem. 1995;118:959-964
40. Garciadorado D, Oliveras J, Gili J. et al. Analysis of myocardial edema by magnetic-resonance-imaging early after coronary-artery occlusion with or without reperfusion. Cardiovas Res. 1993;27:1462-1469
41. Aletras AH, Tilak GS, Natanzon A. et al. Retrospective determination of the area at risk for reperfused acute myocardial infarction with T2-weighted cardiac magnetic resonance imaging - Histopathological and displacement encoding with stimulated echoes (DENSE) functional validations. Circulation. 2006;113:1865-1870
42. Tilak GS, Hsu LY, Hoyt RF Jr. et al. In vivo T2-weighted magnetic resonance imaging can accurately determine the ischemic area at risk for 2-day-old nonreperfused myocardial infarction. Invest Radiol. 2008;43:7-15
43. Johnston DL, Brady TJ, Ratner AV. et al. Assessment of myocardial ischemia with proton magnetic-resonance - effects of a 3 hour coronary-occlusion with and without reperfusion. Circulation. 1985;71:595-601
44. Miller DD, Johnston DL, Dragotakes D. et al. Effect of hyperosmotic mannitol on magnetic-resonance relaxation parameters in reperfused canine myocardial-infarction. Magn Reson Imaging. 1989;7:79-88
45. Li G, Xiang B, Dai GP. et al. Tissue edema does not change gadolinium-diethylenetriamine pentaacetic acid (Gd-DTPA)-enhanced T-1 relaxation times of viable myocardium. J Magn Reson Imaging. 2005;21:744-751
46. Fonge H, Vunckx K, Wang H. et al. Non-invasive detection and quantification of acute myocardial infarction in rabbits using mono-[123I]iodohypericin microSPECT. Eur Heart J. 2008;29:260-269
47. van der Laarse A, van der Wall EE. Rabbit models: ideal for imaging purposes? Int J Cardiovasc Imaging. 2009;25:299-301
48. Feng Y, Xie Y, Wang H. et al. Animal models of ischemic heart disease for cardiac MR imaging research. Int J MIC. 2010;9:288-310
49. Ohzono K, Koyanagi S, Urabe Y. et al. Transmural distribution of myocardial-infarction - difference between the right-and-left-ventricles in a Canine Model. Circ Res. 1986;59:63-73
50. Poulsen RH, Botker HE, Rehling M. Postreperfusion myocardial technetium-99m-sestamibi defect corresponds to area at risk Experimental results from an ischemia-reperfusion porcine model. Nucl Med Biol. 2011;38:819-825
51. Bohl S, Medway DJ, Schulz-Menger J. et al. Refined approach for quantification of in vivo ischemia-reperfusion injury in the mouse heart. Am J Physiol Heart Circ Physiol. 2009;297:H2054-2058
52. Wang HJ, Sun XH, Chen F. et al. Treatment of rodent liver tumor with combretastatin A4 phosphate noninvasive therapeutic evaluation using multiparametric magnetic resonance imaging in correlation with microangiography and histology. Invest Radiol. 2009;44:44-53
53. Connelly CM, Leppo JA, Weitzman PW. et al. Effect of coronary occlusion and reperfusion on myocardial blood flow during infarct healing. AM J Physiol. 1989;257:H365-374
Author contact
![]() Corresponding author: Prof. Dr. Yicheng Ni MD, PhD. Radiology Section, University Hospitals, KU Leuven, Herestraat 49, 3000 Leuven, Belgium. Email: yicheng.nikuleuven.be. Tel: 0032-16-330165; Fax: 0032-16-343765
Corresponding author: Prof. Dr. Yicheng Ni MD, PhD. Radiology Section, University Hospitals, KU Leuven, Herestraat 49, 3000 Leuven, Belgium. Email: yicheng.nikuleuven.be. Tel: 0032-16-330165; Fax: 0032-16-343765