Theranostics
13.3
Impact Factor
 Global reach, higher impact
Theranostics 2013; 3(11):916-926. doi:10.7150/thno.6943 This issue Cite
Research Paper
Using C-Arm X-Ray Imaging to Guide Local Reporter Probe Delivery for Tracking Stem Cell Engraftment
Dorota A. Kedziorek1, Meiyappan Solaiyappan1, Piotr Walczak1,2, Tina Ehtiati3, Yingli Fu1, Jeff W.M. Bulte1,2, Steven M. Shea1,3, Alexander Brost4, Frank K. Wacker1,5, Dara L. Kraitchman1 ![]()
1. Russell H. Morgan Department of Radiology and Radiological Science, Division of MR Research, Johns Hopkins University School of Medicine, Baltimore, Maryland, United States.
2. Cellular Imaging Section and Vascular Biology Program, Institute for Cell Engineering, Johns Hopkins University School of Medicine, Baltimore, Maryland, United States.
3. Center for Applied Medical Imaging, Corporate Technology, Siemens Corporation, Baltimore, Maryland, United States.
4. Pattern Recognition Lab, University of Erlangen, Erlangen, Germany.
5. Department of Radiology, Hannover Medical School, Hannover, Germany.
Received 2013-6-18; Accepted 2013-11-28; Published 2013-12-17
Citation:
Kedziorek DA, Solaiyappan M, Walczak P, Ehtiati T, Fu Y, Bulte JWM, Shea SM, Brost A, Wacker FK, Kraitchman DL. Using C-Arm X-Ray Imaging to Guide Local Reporter Probe Delivery for Tracking Stem Cell Engraftment. Theranostics 2013; 3(11):916-926. doi:10.7150/thno.6943. https://www.thno.org/v03p0916.htm
Other stylesAbstract
Poor cell survival and difficulties with visualization of cell delivery are major problems with current cell transplantation methods. To protect cells from early destruction, microencapsulation methods have been developed. The addition of a contrast agent to the microcapsule also could enable tracking by MR, ultrasound, and X-ray imaging. However, determining the cell viability within the microcapsule still remains an issue. Reporter gene imaging provides a way to determine cell viability, but delivery of the reporter probe by systemic injection may be hindered in ischemic diseases.
In the present study, mesenchymal stem cells (MSCs) were transfected with triple fusion reporter gene containing red fluorescent protein, truncated thymidine kinase (SPECT/PET reporter) and firefly luciferase (bioluminescence reporter). Transfected cells were microencapsulated in either unlabeled or perfluorooctylbromide (PFOB) impregnated alginate. The addition of PFOB provided radiopacity to enable visualization of the microcapsules by X-ray imaging. Before intramuscular transplantation in rabbit thigh muscle, the microcapsules were incubated with D-luciferin, and bioluminescence imaging (BLI) was performed immediately. Twenty-four and forty-eight hours post transplantation, c-arm CT was used to target the luciferin to the X-ray-visible microcapsules for BLI cell viability assessment, rather than systemic reporter probe injections. Not only was the bioluminescent signal emission from the PFOB-encapsulated MSCs confirmed as compared to non-encapsulated, naked MSCs, but over 90% of injection sites of PFOB-encapsulated MSCs were visible on c-arm CT. The latter aided in successful targeting of the reporter probe to injection sites using conventional X-ray imaging to determine cell viability at 1-2 days post transplantation. Blind luciferin injections to the approximate location of unlabeled microcapsules resulted in successful BLI signal detection in only 18% of injections. In conclusion, reporter gene probes can be more precisely targeted using c-arm CT for in vivo transplant viability assessment, thereby avoiding large and costly systemic injections of a reporter probe.
Keywords: mesenchymal stem cells, reporter gene, microencapsulation, bioluminescence, c-arm CT, probe targeting.
Introduction
Stem cell transplantation for the treatment of peripheral arterial disease (PAD) has the potential to restore the blood supply to the ischemic tissue by enhancing arteriogenesis [1-6]. However, poor cell survival after administration and the inability to monitor cell delivery and engraftment are problems that plague cellular transplantation studies. While it is unclear exactly why large numbers of cells die rapidly after administration, several culprits may include: poor oxygenation and nutrient supply; inflammation; and the loss of cell-to-cell contact leading to early graft death [7-9]. These issues have motivated the development of microencapsulation methods to protect cells from early destruction and possibly avoid the need for immunosuppressive regimes for allogeneic or xenogeneic cells. In the early 1980s, Lim and Sun developed a microencapsulation method for islet cells using alginate-poly-L-lysine-alginate (APA) microencapsulation [10], to create a biocompatible [11], semi-permeable membrane to protect cells from immune rejection by blocking antibodies yet permitting the diffusion of nutrients, cytokines, and waste products. Recently, it has been demonstrated that the addition of a contrast agent to this biocompatible coating may enable cell tracking by MR, ultrasound, and X-ray imaging [12-15]. However, the viability of the cell within the microcapsule after transplantation cannot be directly interrogated.
Reporter gene imaging methods, such as bioluminescence imaging (BLI), provide a means for in vivo longitudinal monitoring of cell survival [16]. BLI reporter gene imaging is based on the insertion of the gene producing luciferase, a non-mammalian enzyme initially isolated from the firefly. This enzyme catalyzes oxidation of luciferin to oxyluciferin with energy release in the form of photons, by which means transfected stem cells can be imaged with BLI [17-23].
The present study uses mesenchymal stem cells (MSCs) transfected with a triple reporter gene and encapsulated in a multimodal, biocompatible, contrast agent (perfluorooctylbromide, PFOB) [24-27] impregnated microcapsules. While PFOB allows non-invasive microcapsule tracking by fluorine magnetic resonance imaging (19F MRI), ultrasound (perfluorocarbon) and X-ray (bromine), the current study used X-ray imaging only, which is frequently used for interventional radiology procedures. The purpose of this study was to enable cell viability determination and tracking by imaging techniques in preparation for future studies of therapeutic arteriogenesis in PAD. Typically, reporter probes are injected systemic. In the current study, we sought to avoid large systemic doses of the reporter probe and minimize any issues associated with poor delivery to ischemic tissue by directly targeting the reporter probe to the PFOB-impregnated microcapsules using c-arm CT for needle trajectory planning and overlay.
Methods
MSCs culture and transfection
All animal studies were approved by the Institutional Animal Care and Use Committee. Male rabbit bone marrow-derived mesenchymal stem cells were expanded in culture medium (DMEM- low glucose (Gibco) with 1% antibiotics (Gibco) and 10% selected fetal bovine serum (FBS, HyClone), as previously described [6], prior to transfection.
The triple fusion (TF) construct containing firefly luciferase (fluc), monomeric red fluorescence protein (mrfp) and truncated thymidine kinase (ttk) cloned into the lentiviral transfer vector driven by the human ubiquitin-C promoter (LV-pUb-fluc-mrfp-ttk) was kindly provided by Drs. Sam Gambhir and Joseph Wu [18]. MSCs were expanded for three passages. While frequently permanent transfection is performed using a self-inactivating lentiviral vector, this technique was not successful with rabbit MSCs. Thus, we used a plasmid-based transient transfection technique. When 50-80% confluence was achieved, the MSCs were transiently transfected with plasmid-bearing triple fusion reporter gene using lipofectamine 2000 (Invitrogen) as previously described [18]. Plasmid and Lipofectamine 2000 were suspended separately in Opti-MEM I reduced serum medium (Invitrogen) and then combined and incubated at room temperature for 1 hour to form complexes, which were then combined with 1% FBS, no antibiotic DMEM-low glucose medium, to achieve a final concentration of 2 µg/ml of DNA and 7 µl/ml of Lipofectamine 2000. This transfection medium (7 ml/T150 flask) was added to the MSCs, which were incubated overnight at 37°C in a CO2 enriched atmosphere. Then 20 ml of full growth medium was added without removing the transfection mixture. After a few hours, the solution was replaced with fresh, complete medium. The MSCs were cultured for 24 hours before microencapsulation to allow full expression of the TF reporter gene proteins (TF-MSCs).
To determine whether MSC multipotency was affected by transfection, adipogenic (Cambrex Corporation) and osteogenic (Stem Cell Technologies) differentiation assays were performed according to manufacturers' protocols and fixed cells were then stained with oil red O for adipocyte identification or a modified von Kossa's staining for the presence of phosphapte depositions for osteogenesis.
The efficiency of transfection was determined based on BLI for luciferase activity. Increasing numbers of cells were plated into 24- or 48-well cell culture plates. To every 200 µl of medium containing cells, D-luciferin (30 mg/ml, Caliper Life Sciences) was added to obtain final working solution of 15 µg/ml. The bioluminescent signal generated by luciferase was detected by a highly sensitive charge-coupled device camera (IVIS 200, Caliper Life Sciences).
Microencapsulation of transfected MSCs
Unlabeled alginate-poly-L-lysine-laginate (APA) microcapsules were created by suspending TF-MSCs in 2% alginate (Pronova UP LVG) at a concentration of 106 cells/ml. The APA-TF-MSC mixture was extruded from a syringe pump (Harvard Apparatus) using a blunt 27G needle connected to an electrostatic generator. Spherical beads were collected in 100 mM calcium chloride solution and incubated for 10 minute in this solution. After rinsing with 0.9% saline, the microcapsules were suspended in 0.05% poly-L-lysine (Sigma, molecular mass = 22-24kDa) and gently shaken for 10 minutes. After washing with saline, the microcapsules containing TF-MSCs were placed in 0.15% alginate (Pronova UP LVM) for 10 minutes while maintaining a continuous slow rotation.
To create X-ray-visible microcapsules, equal volume emulsions of lecithin and perfluorooctylbromine (PFOB) were sonified and mixed with the dissolved sodium alginate (Pronova UP LVG) to create a final concentration of 12% PFOB in 2% alginate [24]. TF-MSCs were suspended in PFOB alginate, and the microencapsulation process was performed as stated for unlabeled APA capsules. The viability of unlabeled and PFOB-labeled encapsulated TF-MSCs was determined from live-dead staining [28], i.e., calcein/propidium iodide staining.
Phantom studies
The effect of microencapsulation on BLI signal intensity was determined in a 24-well plate phantom containing increasing number of transfected, unencapsulated (naked) MSCs, transfected APA-encapsulated MSCs (APA-TF-MSCs), or transfected PFOB-APA-encapsulated MSCs (PFOB-TF-MSCs). D-luciferin was added to each well to achieve a final concentration of 15 µg/µl, and serial BLI was performed. Regions of interest (ROIs) were drawn over each well in the BLI, and the number of released photons was quantified (Living Image Software version 2.50.1). A linear regression analysis was performed to determine the relationship between BLI signal intensity and the number of cells. In the case of microencapsulated cells, the total number of cells was determined based on the average number of cells per capsule calculated from calcein fluorescence staining.
In vivo studies
All animal studies were approved by the institutional animal care and use committee. MSCs were transfected approximately 48 hours before injection and encapsulated on the same day of transplantation. Immediately prior to the transplantation, the microcapsules were incubated with D-luciferin (150 µg/ml) for 5 minutes. Female, six months old New Zealand White Rabbits (n=8) were sedated with intramuscular ketamine (40 mg/kg) and acepromazine (1 mg/kg), and an intravenous catheter was placed in the marginal ear vein. Rabbits were intubated, and general anesthesia was maintained with intravenous boluses of sodium thiopental. Animals were randomized to receive two to six 0.2-0.5 ml intramuscular injections of PFOB and APA capsules (~3000 - 4000 capsules/injection containing ~5x10⁵ TF-MSCs/injection) in the right and left medial thigh, respectively. One rabbit (#1) received three injections of unencapsulated TF-MSCs (5x10⁵ MSCs/injection) only (Table 1). BLI was performed immediately after microcapsule transplantation.
C-arm CT and luciferin injections
Targeted reporter probe injections were performed at 1 and 2 days post transplantation using the sedation and anesthesia technique described above in seven animals that received viable PFOB microencapsulated TF-MSCs; one rabbit that received non-viable PFOB-TF-MSCs was excluded from CT-targeted reporter probe injections. In 2 rabbits, luciferin was injected blinded (without imaging guidance) into the area containing PFOB-TF-MSCs. In the remaining 5 rabbits, c-arm CT (Axiom Artis dFA, Siemens) was performed using an 8 sec DR preset (DynaCT, Siemens Medical Solutions) with 8 sec acquisition time, 240° total projection angle, 0.5° projection increment, and 0.36 µGy dose per pulse reconstructed to 0.4 mm3 resolution for needle trajectory planning and overlay [29](Fig.1). Hypodermic needles for luciferase injection (15 mg per injection site) were placed percutaneously under fluoroscopic guidance in proximity to PFOB-TF-MSCs transplantation sites, to target the reporter probe to the microencapsulated cells.
After needle placement, digital subtraction angiogram (DSA) Dyna CT images (8 sec rotation) were acquired after a 16 ml injection of IV iodinated contrast agent (Iohexol, 8 sec X-ray delay with 2 ml/s for 8 sec) to investigate vessel location relative to the PFOB-TF-MSCs transplantation sites. Subsequently, luciferin was administrated through the positioned needles, and BLI was performed. For APA-TF-MSCs and naked TF-MSCs, which were not visible under X-ray, luciferin was injected blindly into the medial thigh muscles in the approximate locations that were marked in the skin on the day of initial injection.
Table 1
Description of MSC injection sites in each rabbit with numbers of visible injection sites by c-arm CT and BLI at each time point.
| Right leg | ||||||||
| Injections | CT | BLI | ||||||
| Animal # | Number | Description | Day 0 | Day 1 | Day 2 | Day 0 | Day 1 | Day 2 |
| *1 | 3 | 2 injections of PFOB-TF-MSCs, 1 injection of TF-MSCs | N/A | N/A | N/A | + | - | N/A |
| *2 | 2 | 2 injections of PFOB-TF-MSCs | N/A | N/A | N/A | + | - | N/A |
| 3 | 2 | 2 injections of PFOB-TF-MSCs | 2 | 2 | 2 | + | + | + |
| 4 | 6 | 6 injections of PFOB-TF-MSCs | N/A | 4 | 4 | + | + | - |
| 5 | 6 | 6 injections of PFOB-TF-MSCs | N/A | 6 | 6 | - | + | N/A |
| 6 | 6 | 6 injections of PFOB-TF-MSCs | 6 | 6 | 6 | + | + | N/A |
| *7 | 6 | 6 injections of PFOB-TF-MSCs | N/A | N/A | N/A | - | N/A | N/A |
| 8 | 6 | 6 injections of PFOB-TF-MSCs | N/A | 6 | 6 | + | + | + |
| Left leg | ||||||||
| Injections | CT | BLI | ||||||
| Animal # | Number | Description | Day 0 | Day 1 | Day 2 | Day 0 | Day 1 | Day 2 |
| *1 | 7 | 1 injection of not transfected MSCs, 2 injections of TF-MSCs, 4 injections of PFOB-TF-MSCs | N/A | N/A | N/A | + | - | N/A |
| *2 | 2 | 2 injections of APA-TF-MSCs | N/A | N/A | N/A | + | - | N/A |
| 3 | 2 | 2 injections of APA-TF-MSCs | 0 | 0 | 0 | + | - | - |
| 4 | 6 | 6 injections of APA-TF-MSCs | N/A | 0 | 0 | + | + | - |
| 5 | 6 | 6 injections of APA-TF-MSCs | N/A | 0 | 0 | + | + | N/A |
| 6 | 6 | 6 injections of APA-TF-MSCs | 0 | 0 | 0 | + | + | N/A |
| *7 | 6 | 6 injections of APA-TF-MSCs | N/A | N/A | N/A | - | N/A | N/A |
| 8 | 6 | 6 injections of APA-TF-MSCs | N/A | 0 | 0 | + | + | + |
* No needle targeted study. + - injection site visible; - - injection site not visible.
Figure 1
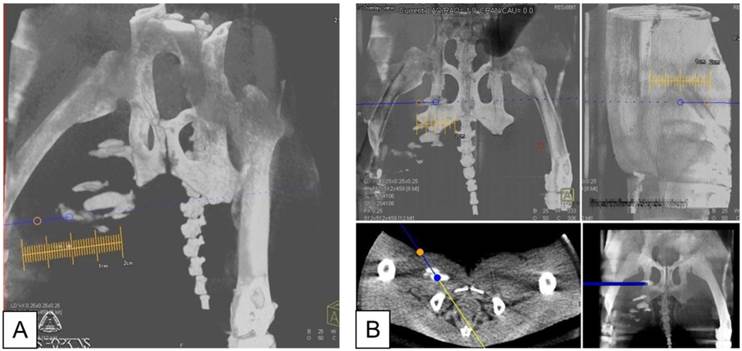
A: X-ray fluoroscopic overlay in oblique projection on the c-arm CT in preparation for needle targeting to PFOB and APA microcapsules injection sites. Orange circle indicates the skin entry point; blue circle shows the target point. B: Planning of the needle entry to the target point in coronal (top left), sagittal (top right), axial (bottom left), and multi-planar reformat (bottom right).
Using the c-arm CT data, the distance between the needle tips and each PFOB-TF-MSCs transplantation's center of mass (COM) as well as the shortest extent between injection COM and skin surface were calculated using ImageJ (National Institutes of Health, Bethesda, MD, http://rsbweb.nih.gov/ij/). Briefly, the Dicom images were imported as an image sequence, and a rectangular ROI was specified around each injection site and its closest needle tip. A boundary of the PFOB-TF-MSCs injection site was marked on each image slice of a cropped ROI and then tabulated together into a 3D sub-volume. The coordinates of its COM and closest needle tip were used to calculate the distance.
Histological analysis
Immediately after BLI on the second day, the rabbits were humanely euthanized, and tissue samples containing the microencapsulated cells were obtained. Hematoxylin and eosin staining was performed to evaluate microcapsule integrity.
Statistical analysis
In vitro comparison of the BLI signal intensity between unencapsulated TF-MSCs and PFOB-APA-TF-MSCs or APA-TF-MSCs was performed using a paired t-test.
Results
Transfection efficiency and effect of PFOB microencapsulation on BLI
Transfection efficiency of rabbit MSCs was generally low (<4%). After transfection,the MSCs retained their ability to differentiate into adipogenic and osteogenic cell lines, as confirmed by oil red O staining and von Kossa's staining (Fig. 2).
As expected of transiently transfected cells, the BLI signal intensity decreased over time in unencapsulated MSCs as well as in APA- and PFOB-encapsulated cells. BLI signal could still be detected up to 5 days post transfection from rabbit MSCs in vitro. The BLI signal was proportional to the number of cells in each study (R2=0.93 to 0.99 at two days post-transfection, Fig. 3), albeit the signal intensity (transfection efficiency) for a given number of cells varied somewhat from study to study (Fig. 4). The viability of encapsulated cells by live/dead staining immediately post encapsulation was high (87.6% ± 6% for APA-TF-MSCs and 92.9% ± 9% for PFOB-TF-MSCs) except in one case where all the cells of PFOB alginate encapsulation were dead shortly after encapsulation (Fig.5.A-E). The bioluminescence signal of MSCs in vitro was not decreased by alginate microencapsulation, with or without impregnation with PFOB (P=NS, Fig. 6).
Figure 2
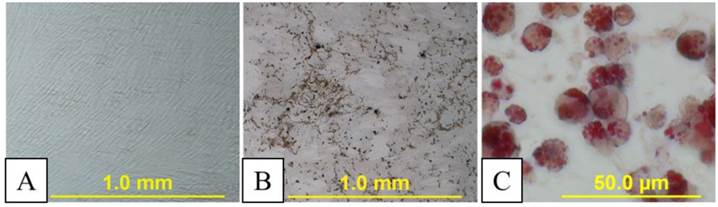
A: Undifferentiated in vitro cultured transiently transfected rabbit mesenchymal stem cells (MSCs). B: Osteocytic differentiation stimulated phosphate deposition as demonstrated by von Kossa staining (black staining). C: Adipocytic differentiation assay led to lipid vacuoles formation as shown by red oil O staining (red vacuoles).
Figure 3
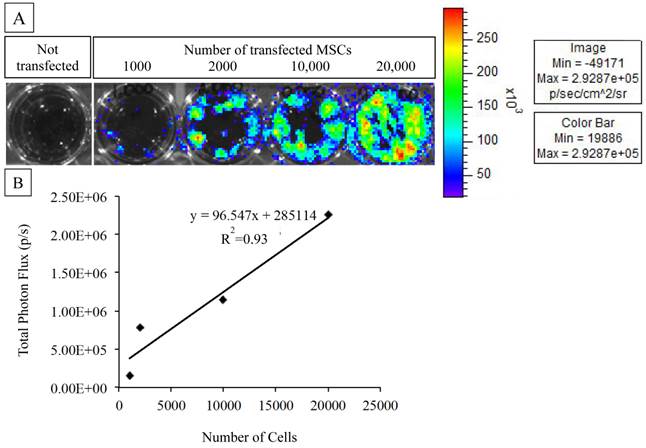
A: MSCs transfected with the triple fusion reporter (TFR) gene reveal bioluminescent activity as compared to MSCs that were not transfected. B: BLI signal quantification and correlation with cell number. The photon emission from transfected MSCs is highly correlated to the number of plated cells.
Figure 4
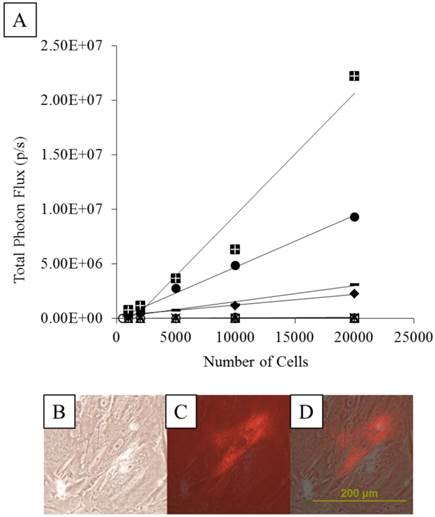
A: The transfection efficiency based on BLI signal intensity obtained from each transfection for a given number of cells. Different symbols represent cells from different transfection batches. A linear relationship was found but the efficiency varied for each transfection study. B-D: Microscopic images of transfected MSCs expressing red fluorescent protein in bright field (B), fluorescent light (C), and merged composite of B and C (D).
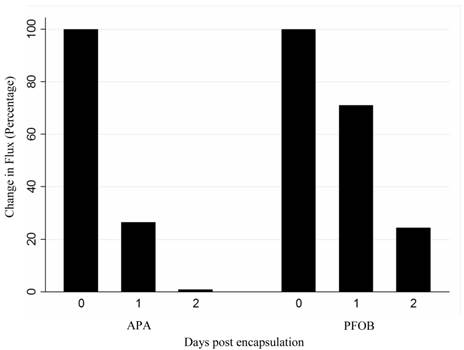
Figure 5
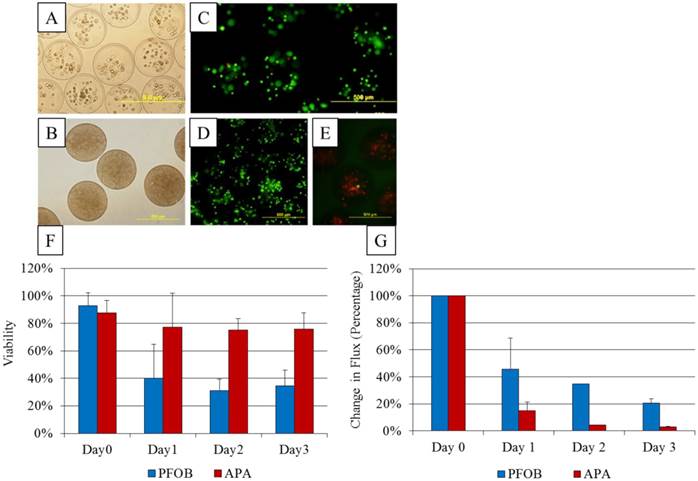
A, B: Microscopic images of (A) unlabeled APA and (B) PFOB-labeled microcapsules containing transfected MSCs. C, D: Viability staining with calcein (green, live cells) and propidium iodide (red, dead cells) for APA (C) and PFOB (D) microcapsules cultured in vitro. E: Calcein and propidium iodide staining reveals mostly dead cells inside one batch of PFOB microcapsules. F: In vitro viability assessment of PFOB (blue bars) and APA (red bars) encapsulated cells, based on live-dead staining with calcein and propidium iodide. G: In vitro bioluminescent activity comparing change in flux from baseline of PFOB-TF-MSCs (blue bars) and APA-TF-MSCs (red bars) immediately, 1 and 2 days post encapsulation
Figure 6
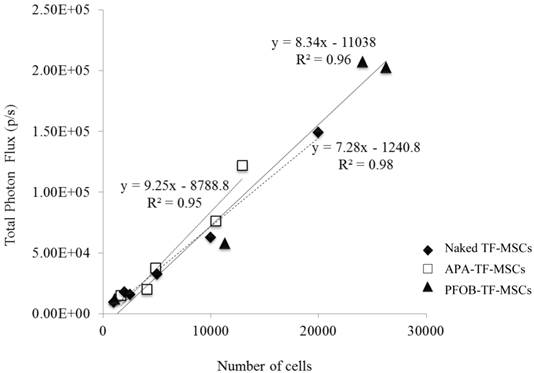
Representative comparison of the BLI signal intensity versus the number of TF-MSCs. APA (white squares), PFOB-encapsulated (black triangles) and unlabeled, unencapsulated MSCs (black circles) show a linear relationship between BLI signal intensity and cell number.
Figure 7
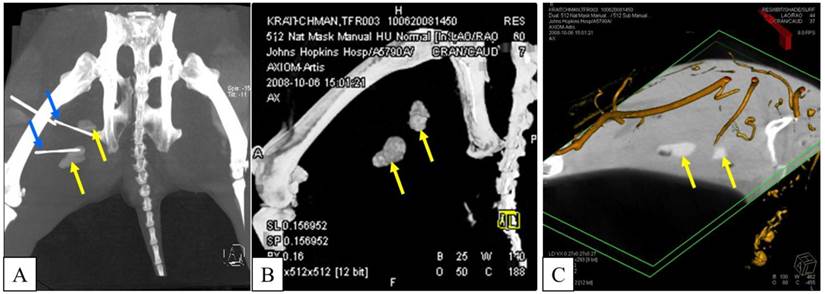
A, B: APA-TF-MSCs (left side of the image) are not visible on c-arm CT, while PFOB-TF-MSCs injections (yellow arrows, right thigh) are easily detectable. Blue arrows indicate needles guided to the PFOB-TF-MSCs transplant locations. C: In the same animal case, an embedded multiplanar reconstruction of c-arm CT with a digital subtraction angiogram indicates the localization of transplanted PFOB-TF-MSCs (yellow arrows) relative to vasculature (orange).
C-arm CT imaging and targeted injection of luciferin
APA-TF-MSCs were not detectable on c-arm CT images, whereas 92% of PFOB-TF-MSCs injection sites were visible on day one and two post-transplantation (Table 1), Moreover, the PFOB-TF-MSC injection locations relative to the vasculature could also be discerned (Fig. 7). The undetected PFOB injection sites most likely represented injection failures where only vehicle (phosphate buffered saline) was delivered rather than a failure in sensitivity by the imaging method, since post-mortem analysis of the tissue showed no gross evidence of the capsules, which are visible by the naked eye.
On day 1 and 2 post-transplantation, needle targeting under CT fluoroscopy guidance was attempted to 26 of 40 (~65%) PFOB-TF-MSCs injection sites. The remaining sites were not targeted because of their proximity to adjacent PFOB-TF-MSC injection. The mean distance between the needle tip final placement site and the injection center of mass was 4.6 ± 2.0 mm. Based on the c-arm CT images, the mean shortest distance from the center of mass of each injection to skin surface was 13.5 ± 4.5 mm.
In vivo bioluminescence imaging
BLI performed immediately post cell transplantation detected strong signal from viable TF-MSCs encapsulated in PFOB and APA microcapsules as well as from the naked TF-MSCs injected into one animal. There was no BLI signal immediately post-transplantation from the microcapsules containing dead cells (animal #7). Therefore, c-arm CT and BLI were not pursued at 24 and 48 hours in this animal. In general, BLI performed 24 and 48 hours post transplantation after targeted luciferin delivery demonstrated viable PFOB-TF-MSCs but was inconsistent for APA-TF-MSCs (Fig 8). The BLI signal from PFOB-TF-MSCs was in agreement with the results of in vitro viability staining (Fig. 9). Interestingly, in two cases (animals #4 and 5), the BLI signal from PFOB-TF-MSCs was higher on day 1 post injection as compared to immediately post-transplantation of capsules incubated with luciferin. In the two cases, where BLI was performed one day post transplantation after non-targeted injections of luciferin into the thigh muscles containing PFOB-encapsulated TF-MSCs, no signal was obtained from the transplantation sites (animals #1 and 2), whereas in vitro BLI of PFOB-TF-MSCs cultured for 24 hours demonstrated viable cells. For these two rabbits, BLI was not performed on day two. Similarly, BLI signal from APA-TF-MSCs in all animals after non-targeted luciferin injections was observed only one third of the time on day 1 and never on day 2, whereas in vitro BLI of microcapsules showed high viability.
Histological analysis
Post-mortem histological examination revealed intact microcapsules (Fig. 11), which was in agreement with c-arm CT images showing a lack of capsule dispersion.
Figure 8
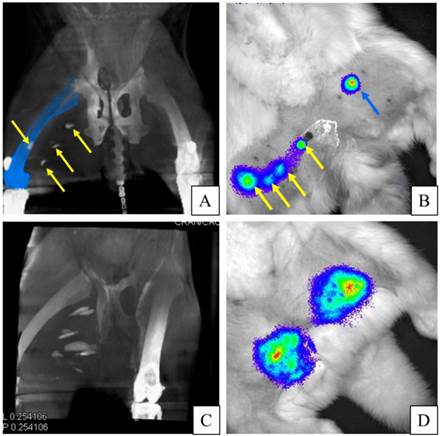
A: C-arm CT image demonstrates the visualization of PFOB-TF-MSCs injections (yellow arrows) in the right hind leg. (Femur is recolored blue to enhance visibility of one injection site.) B: In the same rabbit as in A, targeted luciferin injections 24 hours post transplantation reveal viable PFOB-TF-MSCs in the right thigh (yellow arrows) that correspond to c-arm CT and only one visible injection site of APA-TF-MSCs after non-targeted injections of luciferin into the left thigh (blue arrow). C: C-arm CT image of another animal showing PFOB-TF-MSCs injection sites in the medial thigh of right hindlimb. D: BLI of the same rabbit as in C dmonstrates one spot of viable PFOB-TF-MSCs in the left thigh and one spot of APA-TF-MSCs in the right thigh. Because of proximity of multiple injection sites, one cannot delineate the BL signal from each PFOB-TF-MSCs cluster. However, the multiple peaks in the signal intensity suggest that they are superposed.
Figure 9
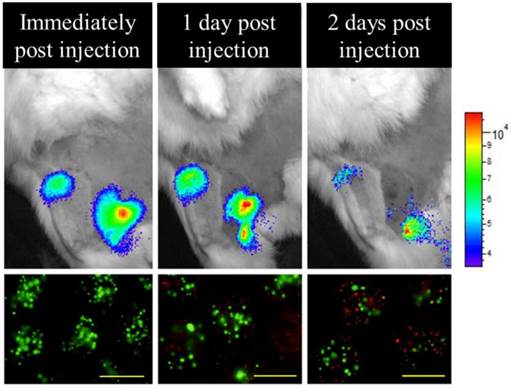
Bioluminescence imaging performed immediately, 24, and 48 hours after transplantation and targeted luciferin delivery demonstrates viable PFOB-TF-MSCs in agreement with the results of in vitro viability staining with calcein (green, alive cells) and propidium iodide (red, dead cells). Reduction in BLI signal intensity is expected after transient transfection (scale bar =500 μm).
Figure 10
In vivo change in flux (number of emitted photons per second) of PFOB-TF-MSCs and APA-TF-MSCs relative to baseline at 24 and 48 hours after transplantation. The difference between these two groups may represent the viability of the cells, but it may also be altered by the degree of luciferin delivery to the cells.
Figure 11
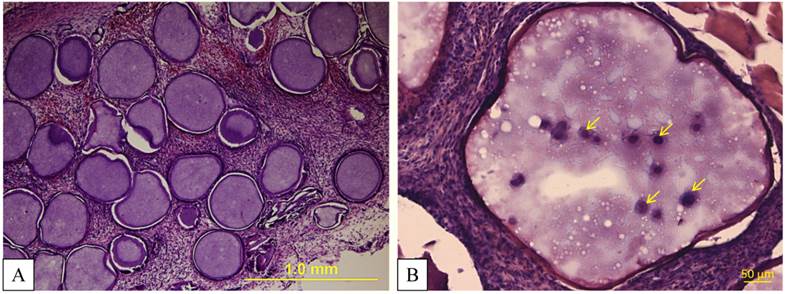
A, B: Hematoxylin and eosin staining demonstrates intact microcapsules taken from the thigh muscles two days after transplantation. At a higher magnification (B), MSCs (yellow arrows) inside PFOB-impregnated alginate can be detected.
Conclusion
Maintenance of viability of transplanted cells is an issue of great concern. To provide a pro-survival environment for cell grafts, several microencapsulation methods have been developed. Whereas there are many studies confirming high cell survival in microcapsules in vitro, there are limited studies confirming cell survival after transplantation in vivo [30]. Instead, cell survival has been inferred using the production of cell byproducts, such as insulin or c-peptide in the case of islet cell transplantation [13]. Thus, this is one of the first reports [30] examining BLI for microencapsulated cell in vivo survival estimation. While reporter gene imaging has been widely applied as a method to determine cell viability in vivo, [31, 32] this study demonstrates that the accuracy of this technique when injecting small amounts of probe is dependent on the delivery of the reporter probe to the transfected, transplanted cells. Despite a relatively simple blind intramuscular injection targeted towards skin markings of previous injection sites of unlabeled microcapsules, we were only successful at detecting viable injections no more than 18% of the time. In the case of failure to detect unlabeled microcapsule injections, one is uncertain whether the transplanted cells have died or the reporter probe failed to reach the microcapsule at sufficient concentrations to be detected [33]. In part, this may be due to the low sensitivity due to low transfection efficiency of MSCs, which in our study was similar to previous results [34, 35]. However, one can also imagine that delivery of the reporter probe via intravenous injection to the tissue with reduced perfusion might also be low as well. Importantly, the addition of PFOB to enable X-ray visibility of the microcapsules did not alter cell viability in vitro or detection by BLI. Thus, by combining an X-ray-visible stem cell capsule with directed injections of reporter probe for reporter gene imaging, we are able to have a higher confidence that cells that fail to be detected on BLI represent non-viable transplanted cells. Even with a small error in targeting of ~4 mm, we were able to successfully deposit the reporter gene in close proximity to the MSCs for visibility by BLI. Since PFOB has favorable properties to support enhanced oxygenation [36], it is also possible that the PFOB-labeled microcapsules enhanced cell survival in our rabbit model. Although we did not directly confirm in vivo imaging estimates of cell survival using post-mortem assays such as TUNEL staining, red fluorescence [18], or luciferase activity [37], a number of preclinical studies have demonstrated the concordance between cell viability by in vivo imaging and post-mortem techniques [18, 37-40]. However, our in vivo results and the ability for PFOB to enhance cell survival will need to be validated by careful post-mortem assays.
Because performing reporter gene imaging on larger animals than rats will require large and costly amounts of the reporter probe for systemic injections with the potential for variable absorption in an ischemic area expected in vascular occlusive disease, we sought to develop a predictable method to target reporter gene probe to these poorly perfused areas using local intramuscular delivery with clinical X-ray imaging modalities. The reporter gene probe could be precisely targeted in smaller doses to the cell transplantation sites. In the present study, cell viability (and reporter gene expression) was maintained in X-ray-labeled microcapsules up to 3 days post-transplantation. Furthermore, the integrity of the microcapsule could be readily assessed using clinically available c-arm CT.
While BLI will probably remain a pre-clinical imaging method, the presence of the thymidine kinase reporter in our TF gene construct could be used for positron emission tomography (PET) imaging in clinical PET scanners [22]. In such an application, the reporter probe, luciferin, would be replaced with a radiotracer reporter probe. Because reporter gene probe injections could be quickly targeted, the systemic dose of radioactivity could be minimized. Another advantage of PET imaging is that as a tomographic technique, the detection of multiple closely spaced injection sites could be resolved. In the current study using BLI this was not possible. In addition, the quantification of cell viability by BLI is further hampered because injection sites that were deeper may yield lower flux values due to absorption of the light. However, both PET and BLI will be somewhat sensitive to change in production of the reporter gene product if it varies from day to day.
Another potential limitation in the current study is that the MSCs were only transiently transfected. Thus, serial imaging could not be performed beyond a few days. Permanent transfection using a viral technique could overcome this limitation. Thus, future studies should be aimed at a higher efficiency of transfection with permanent transfection using radionuclide reporter gene methods.
In summary, we have developed the first example of an X-ray visible method formulated using FDA-approved products to delivery and track stem cells using clinically available X-ray imaging systems where the cell viability within the microcapsule can be determined in a serial manner using non-invasive imaging. The needle targeting software that was used in the current study is now available on flat-panel angiography systems by several vendors. Whereas this technique could rapidly be translated to patients with PAD, X-ray-visible microencapsulated transfected cells could also be used in many other cell transplantation scenarios such as myocardial infarction, islet cell transplantation, and hepatocyte transplantation. The ability to deliver and track stem cells using X-ray angiographic techniques, which are readily available in the current interventional setting should speed rapid translation of these techniques to the clinical realm.
Acknowledgements
We would like to thank Drs. Sam Gambhir and Joseph Wu for supplying the TF construct and Norbert Strobel from Siemens AG for providing the prototype needle targeting software. Grant support was provided by NIH R21-HL89029 and the Maryland Stem Cell Research Foundation (2008-MSCRFII-0399-00).
Conflict of interest
For presented study we received support from Boston Scientific Corporation and Siemens Healthcare USA.
Abbreviations
APA: alginate-poly-L-lysine-alginate;
BLI: bioluminescence Imaging;
MSCs: mesenchymal stem cells;
PAD: peripheral arterial disease;
PFOB: perfluorooctylbromide;
PLL: poly-L-lysine;
TF: triple fusion.
References
1. Asahara T. et al. Isolation of putative progenitor endothelial cells for angiogenesis. Science. 1997;275(5302):964-7
2. Kinnaird T. et al. Marrow-derived stromal cells express genes encoding a broad spectrum of arteriogenic cytokines and promote in vitro and in vivo arteriogenesis through paracrine mechanisms. Circ Res. 2004;94(5):678-85
3. Kocher AA. et al. Neovascularization of ischemic myocardium by human bone-marrow-derived angioblasts prevents cardiomyocyte apoptosis, reduces remodeling and improves cardiac function. Nat Med. 2001;7(4):430-6
4. Kamihata H. et al. Implantation of bone marrow mononuclear cells into ischemic myocardium enhances collateral perfusion and regional function via side supply of angioblasts, angiogenic ligands, and cytokines. Circulation. 2001;104(9):1046-52
5. Ziegelhoeffer T. et al. Bone marrow-derived cells do not incorporate into the adult growing vasculature. Circ Res. 2004;94(2):230-8
6. Kedziorek DA. et al. X-ray-visible microcapsules containing mesenchymal stem cells improve hind limb perfusion in a rabbit model of peripheral arterial disease. Stem Cells. 2012;30(6):1286-96
7. Reinecke H. et al. Survival, integration, and differentiation of cardiomyocyte grafts: a study in normal and injured rat hearts. Circulation. 1999;100(2):193-202
8. Murry CE, Field LJ, Menasche P. Cell-based cardiac repair: reflections at the 10-year point. Circulation. 2005;112(20):3174-83
9. Crisan M. et al. A perivascular origin for mesenchymal stem cells in multiple human organs. Cell Stem Cell. 2008;3(3):301-13
10. Lim F. and Sun AM. Microencapsulated islets as bioartificial endocrine pancreas. Science. 1980;210(4472):908-10
11. De-Vos P. et al. Improved biocompatibility but limited graft survival after purification of alginate for microencapsulation of pancreatic islets. Diabetologia. 1997;40(3):262-70
12. Barnett BP. et al. Radiopaque alginate microcapsules for X-ray visualization and immunoprotection of cellular therapeutics. Mol Pharm. 2006;3(5):531-8
13. Barnett BP. et al. Magnetic resonance-guided, real-time targeted delivery and imaging of magnetocapsules immunoprotecting pancreatic islet cells. Nat Med. 2007;13(8):986-91
14. Arifin DR. et al. Microencapsulated cell tracking. NMR Biomed. 2012
15. Barnett BP. et al. Synthesis of magnetic resonance-, X-ray- and ultrasound-visible alginate microcapsules for immunoisolation and noninvasive imaging of cellular therapeutics. Nat Protoc. 2011;6(8):1142-51
16. Mayerhofer R, Araki K, Szalay AA. Monitoring of spatial expression of firefly luciferase in transformed zebrafish. J Biolumin Chemilumin. 1995;10(5):271-5
17. Contag CH. et al. Photonic detection of bacterial pathogens in living hosts. Mol Microbiol. 1995;18(4):593-603
18. Cao F. et al. In vivo visualization of embryonic stem cell survival, proliferation, and migration after cardiac delivery. Circulation. 2006;113(7):1005-14
19. Wang X. et al. Dynamic tracking of human hematopoietic stem cell engraftment using in vivo bioluminescence imaging. Blood. 2003;102(10):3478-82
20. Kim DE. et al. Imaging of stem cell recruitment to ischemic infarcts in a murine model. Stroke. 2004;35(4):952-7
21. Ray P. et al. Imaging tri-fusion multimodality reporter gene expression in living subjects. Cancer Res. 2004;64(4):1323-30
22. Wu J.C. et al. Molecular imaging of cardiac cell transplantation in living animals using optical bioluminescence and positron emission tomography. Circulation. 2003;108(11):1302-5
23. Contag CH, Bachmann MH. Advances in in vivo bioluminescence imaging of gene expression. Annu Rev Biomed Eng. 2002;4:235-60
24. Barnett BP. et al. Fluorocapsules for improved function, immunoprotection, and visualization of cellular therapeutics with MR, US, and CT imaging. Radiology. 2011;258(1):182-91
25. Barnett BP. et al. Use of perfluorocarbon nanoparticles for non-invasive multimodal cell tracking of human pancreatic islets. Contrast Media Mol Imaging. 2011;6(4):251-9
26. Isaka M. et al. Cardioprotective effect of perfluorochemical emulsion for cardiac preservation after six-hour cold storage. ASAIO J. 2005;51(4):434-9
27. Rosen NA, Hopf HW Hunt TK. Perflubron emulsion increases subcutaneous tissue oxygen tension in rats. Wound Repair Regen. 2006;14(1):55-60
28. Poole CA, Brookes NH, Clover GM. Keratocyte networks visualised in the living cornea using vital dyes. J Cell Sci. 1993;106( Pt 2):685-91
29. Meyer BC. et al. Percutaneous Punctures with MR Imaging Guidance: Comparison between MR Imaging-enhanced Fluoroscopic Guidance and Real-time MR Imaging Guidance. Radiology. 2013;266(3):912-9
30. Chan KW. et al. MRI-detectable pH nanosensors incorporated into hydrogels for in vivo sensing of transplanted-cell viability. Nat Mater. 2013;12(3):268-75
31. Logeart-Avramoglou D. et al. In vitro and in vivo bioluminescent quantification of viable stem cells in engineered constructs. Tissue Eng Part C Methods. 2010;16(3):447-58
32. Guenoun J. et al. In vivo quantitative assessment of cell viability of gadolinium or iron-labeled cells using MRI and bioluminescence imaging. Contrast Media Mol Imaging. 2013;8(2):165-74
33. Lee KH. et al. Cell uptake and tissue distribution of radioiodine labelled D-luciferin: implications for luciferase based gene imaging. Nucl Med Commun. 2003;24(9):1003-9
34. Haleem-Smith H. et al. Optimization of high-efficiency transfection of adult human mesenchymal stem cells in vitro. Mol Biotechnol. 2005;30(1):9-20
35. Coonrod A, Li FQ, Horwitz M. On the mechanism of DNA transfection: efficient gene transfer without viruses. Gene Ther. 1997;4(12):1313-21
36. Khattak SF. et al. Enhancing oxygen tension and cellular function in alginate cell encapsulation devices through the use of perfluorocarbons. Biotechnol Bioeng. 2007;96(1):156-66
37. Gyongyosi M. et al. Serial noninvasive in vivo positron emission tomographic tracking of percutaneously intramyocardially injected autologous porcine mesenchymal stem cells modified for transgene reporter gene expression. Circ Cardiovasc Imaging. 2008;1(2):94-103
38. Cao F. et al. Molecular imaging of embryonic stem cell misbehavior and suicide gene ablation. Cloning Stem Cells. 2007;9(1):107-17
39. Daadi MM. et al. Imaging neural stem cell graft-induced structural repair in stroke. Cell Transplant. 2013;22(5):881-92
40. Chen IY. et al. Comparison of optical bioluminescence reporter gene and superparamagnetic iron oxide MR contrast agent as cell markers for noninvasive imaging of cardiac cell transplantation. Mol Imaging Biol. 2009;11(3):178-87
Author contact
![]() Corresponding author: Dara L. Kraitchman, V.M.D., Ph.D. The Johns Hopkins University, Russell H. Morgan Department of Radiology and Radiological Science, 600 N. Wolfe St., Park Bldg. 314, Baltimore, MD 21287.
Corresponding author: Dara L. Kraitchman, V.M.D., Ph.D. The Johns Hopkins University, Russell H. Morgan Department of Radiology and Radiological Science, 600 N. Wolfe St., Park Bldg. 314, Baltimore, MD 21287.
Citation styles
APA
Kedziorek, D.A., Solaiyappan, M., Walczak, P., Ehtiati, T., Fu, Y., Bulte, J.W.M., Shea, S.M., Brost, A., Wacker, F.K., Kraitchman, D.L. (2013). Using C-Arm X-Ray Imaging to Guide Local Reporter Probe Delivery for Tracking Stem Cell Engraftment. Theranostics, 3(11), 916-926. https://doi.org/10.7150/thno.6943.
ACS
Kedziorek, D.A.; Solaiyappan, M.; Walczak, P.; Ehtiati, T.; Fu, Y.; Bulte, J.W.M.; Shea, S.M.; Brost, A.; Wacker, F.K.; Kraitchman, D.L. Using C-Arm X-Ray Imaging to Guide Local Reporter Probe Delivery for Tracking Stem Cell Engraftment. Theranostics 2013, 3 (11), 916-926. DOI: 10.7150/thno.6943.
NLM
Kedziorek DA, Solaiyappan M, Walczak P, Ehtiati T, Fu Y, Bulte JWM, Shea SM, Brost A, Wacker FK, Kraitchman DL. Using C-Arm X-Ray Imaging to Guide Local Reporter Probe Delivery for Tracking Stem Cell Engraftment. Theranostics 2013; 3(11):916-926. doi:10.7150/thno.6943. https://www.thno.org/v03p0916.htm
CSE
Kedziorek DA, Solaiyappan M, Walczak P, Ehtiati T, Fu Y, Bulte JWM, Shea SM, Brost A, Wacker FK, Kraitchman DL. 2013. Using C-Arm X-Ray Imaging to Guide Local Reporter Probe Delivery for Tracking Stem Cell Engraftment. Theranostics. 3(11):916-926.
This is an open access article distributed under the terms of the Creative Commons Attribution (CC BY-NC) License. See http://ivyspring.com/terms for full terms and conditions.