Theranostics
13.3
Impact Factor
 Global reach, higher impact
Theranostics 2013; 3(11):816-830. doi:10.7150/thno.6989 This issue Cite
Research Paper
Integrin αvβ3-Targeted Radiotracer 99mTc-3P-RGD2 Useful for Noninvasive Monitoring of Breast Tumor Response to Antiangiogenic Linifanib Therapy but not Anti-Integrin αvβ3 RGD2 Therapy
Shundong Ji1, Yumin Zheng1,2, Guoqiang Shao1, Yang Zhou1, Shuang Liu1 ![]()
1. School of Health Sciences, Purdue University, IN 47907, USA.
2. Department of Nuclear Medicine, China-Japan Friendship Hospital, Beijing, 100029, China.
Received 2013-6-24; Accepted 2013-8-6; Published 2013-10-12
Citation:
Ji S, Zheng Y, Shao G, Zhou Y, Liu S. Integrin αvβ3-Targeted Radiotracer 99mTc-3P-RGD2 Useful for Noninvasive Monitoring of Breast Tumor Response to Antiangiogenic Linifanib Therapy but not Anti-Integrin αvβ3 RGD2 Therapy. Theranostics 2013; 3(11):816-830. doi:10.7150/thno.6989. https://www.thno.org/v03p0816.htm
Other stylesAbstract
Purpose: 99mTc-3P-RGD2 is a 99mTc-labeled dimeric cyclic RGD peptide that binds to integrin αvβ3 with high affinity and specificity. The purpose of this study was to demonstrate the utility of 99mTc-3P-RGD2 SPECT/CT (single photon emission computed tomography/computed tomography) as a molecular imaging tool for noninvasive monitoring breast tumor early response to antiangiogenesis therapy with linifanib, and to illustrate its limitations in monitoring the efficacy of anti-αvβ3 treatment.
Methods: To support SPECT/CT imaging, biodistribution and therapy studies, the xenografted breast cancer model was established by subcutaneous injection of 5 × 10⁶ MDA-MB-435 cells into the fat pad of each athymic nude mouse. Linifanib (ABT-869) was used as antiangiogenesis agent. The tumor volume was 180 ± 90 mm3 on the day (-1 day) before baseline SPECT/CT. Each animal was treated twice daily with vehicle or 12.5 mg/kg linifanib. Longitudinal 99mTc-3P-RGD2 SPECT/CT imaging was performed on days -1, 1, 4 and 11. Tumors were harvested at each time point for pathological analysis of hematoxylin and eosin (H&E) and immunohistochemistry (IHC). Tumor uptake of 99mTc-3P-RGD2 was calculated from SPECT/CT quantification. When cyclic peptide E[c(RGDfK)]2 (RGD2) was used as the anti-αvβ3 agent, SPECT/CT images were obtained only at 7 and 21 days after last RGD2 dose.
Results: The tumor uptake of 99mTc-3P-RGD2 from SPECT/CT quantification was almost identical to that from biodistribution. There was a dramatic reduction in both %ID and %ID/cm3 tumor uptake of 99mTc-3P-RGD2 during the first 24 hours of linifanib therapy. The therapeutic effect of linifanib was on both tumor cells and vasculature, as determined by IHC analysis of integrin αvβ3 and CD31. Changes in tumor vasculature were further confirmed by pathological H&E analysis of tumor tissues. While its %ID tumor uptake increased steadily in vehicle-treated group, the %ID tumor uptake of 99mTc-3P-RGD2 decreased in linifanib-treated group slowly over the 11-day study period. The degree of tumor response to linifanib therapy correlated well to the integrin αvβ3 expression levels before linifanib therapy.
Conclusion: 99mTc-3P-RGD2 is an excellent radiotracer for monitoring integrin αvβ3 expression during and after linifanib therapy. 99mTc-3P-RGD2 SPECT/CT is an useful molecular imaging tool for patient selection before antiangiogenic and anti-αvβ3 therapy; but it would be difficult to use 99mTc-3P-RGD2 for accurate and noninvasive monitoring of early tumor response to anti-αvβ3 therapy.
Keywords: Linifanib, monitoring antiangiogenic therapy, integrin αvβ3, and 99mTc-3P-RGD2.
Introduction
Solid tumor cells require higher levels of oxygen and metabolites to support their rapid uncontrolled growth than normal cells [1-5]. This is accomplished by increased angiogenesis at tumor site and is often seen as the rate limiting step in tumor progression [3, 5]. Targeting tumor angiogenesis with small molecular inhibitors represents a promising strategy for controlling and eradicating tumor growth [6-8]. Linifanib (ABT-869) is a multi-targeted receptor tyrosine kinase inhibitor, specifically targeting vascular endothelial growth factor (VEGF) and platelet-derived growth factor (PDGF) receptors [9-14]. In vitro, linifanib was shown to inhibit the phosphorylation of members of VEGF and PDGF receptor families [11]. Treatment with linifanib resulted in pronounced regression of tumors in vivo in a variety of pre-clinical tumor models [12-14]. Clinical studies showed promising results in breast cancer, metastatic non-small cell lung cancer (NSCLC), and liver cancer [15, 16]. As antiangiogenic therapies have become more common, finding suitable translational biomarkers for antiangiogenic modulation of the tumor vasculature has become critically important.
Microvessel density (MVD) has been proposed as a prognostic indicator of progression, overall survival, and disease-free survival in cancer patients [17, 18]. Evaluation of MVD is typically performed by immunostaining endothelial cells in tumor tissues and counting the number of vessels using a high power field microscope. This approach is not practical for routine monitoring of antiangiogenic therapy due to its invasive nature. DCE (dynamic contrast-enhanced) MRI (magnetic resonance imaging) has been used to measure tumor perfusion properties [19-22], but DCE-MRI is technically challenging and standardization is complicated. [18F]FDG PET was used to monitor linifanib therapy by determining reduced metabolic activity in the “treated” tumors [13], but glucose metabolism may not be an ideal biomarker for monitoring antiangiogenic therapy because most of metabolic activities take place in tumor cells rather than tumor vasculature.
Altered integrin αvβ3 expression has been detected in carcinomas of breast [23-25], prostate [26], ovary [27], lung [28], melanomas [29], and gliomas [30, 31]. The integrin αvβ3 expression has been correlated with an aggressive phenotype and metastatic dissemination [32-35]. It was reported that the integrin αvβ3 is overexpressed on both tumor cells and neovasculature in breast cancer xenografts [36], and is an interesting target to develop new imaging probes for early cancer detection [37-39]. It is well-established that the cross-talk between integrins and receptor tyrosine kinases (e.g. VEGFR and PDGFR) is crucial for many cellular functions [40-42]. Integrin αvβ3 and PDGFR-β co-precipitate and PDGFR activation increases endothelial cell migration and preliferation. The functional association between VEGFR2/PDGFR and integrin αvβ3 is of reciprocal nature since each is able to promote activation of its counterpart. This mutually beneficial relationship provides the conceptual basis to use radiolabeled cyclic RGD peptides as radiotracers for tumor imaging [43-52] and noninvasive monitoring of anti-αvβ3 and antiangiogenesis therapy [52, 53]. While they are appreciated for their role as noninvasive tools to monitor tumor response to antiangiogenesis therapy [43-46], it remains untested if integrin αvβ3-targeted radiotracers are useful for monitoring the tumor response to anti-αvβ3 treatment.
In this study, we evaluated 99mTc-3P-RGD2, a 99mTc-labeled cyclic RGD peptide dimer [54, 55], for its capability to monitor integrin αvβ3 expression during breast tumor growth and after treatment with linifanib and E[c(RGDfK)]2 (RGD2) in the xenografted MDA-MB-435 human breast tumor model. 99mTc-3P-RGD2 is of our particular interest due to the linear relationship between its tumor uptake and integrin αvβ3 expression [56]. 99mTc-3P-RGD2 SPECT/CT has been successfully used for quantification of radioactivity accumulation, delineation of tumor necrosis [57], and monitoring progression of breast cancer lung metastases [58]. RGD2 was used as anti-αvβ3 agent due to its higher integrin αvβ3 binding affinity than that of c(RGDfK) because of dimerization [54]. MDA-MB-435 cell line was of interest due to its high potential for metastasis. Despite the controversy associated with its identity [59-61], more recent results confirmed that MDA-MB-435 is indeed a poorly differentiated and aggressive breast tumor cell line [62]. The main objective of this study was to demonstrate the utility of 99mTc-3P-RGD2 SPECT/CT as a molecular imaging tool for monitoring early tumor response to antiangiogenesis therapy in small animals, and to illustrate its limitations in monitoring the efficacy of anti-αvβ3 treatment.
MATERIALS AND METHODS
Chemicals and Analytical Method. Linifanib (ABT-869) was from AbbVie Inc. (North Chicago, IL). Trisodium triphenylphosphine-3,3',3''-trisulfonate (TPPTS) and tricine were purchased from Sigma-Aldrich (St. Louis, Missouri), and were used without further purification. Cyclic RGD peptides, E[c(RGDfK)]2 (RGD2) and PEG4-E[PEG4-c(RGDfK)]2 (3P-RGD2: PEG4 = 15-amino-4,7,10,13-tetraoxapentadecanoic acid), were made by Peptides International Inc. (Louisville, KY). HYNIC-3P-RGD2 (HYNIC = 6-(2-(2-sulfonatobenzaldehyde)hydrazono)nicotinyl) was prepared using the method described in our previous communication [55]. Na99mTcO4 was obtained from Cardinal HealthCare (Chicago, IL). The radio-HPLC method used a LabAlliance system equipped with a β-ram IN-US detector and Zorbax C18 column (4.6 mm x 250 mm, 300 Å pore size; Agilent Technologies, Santa Clara, CA). The flow rate was 1 mL/min. The mobile phase was isocratic with 90% solvent A (25 mM NH4OAc buffer, pH = 5.0) and 10% solvent B (acetonitrile) at 0 - 5 min, followed by a gradient mobile phase from 10% B at 5 min to 40% B at 20 min.
Radiolabeling and Dose Preparation. 99mTc-3P-RGD2 was prepared according to the literature method [55] using lyophilized kit formulation containing 20 μg HYNIC-3P-RGD2, 5 mg TPPTS, 6.5 mg tricine, 40 mg mannitol, 38.5 mg disodium succinate hexahydrate and 12.7 mg succinic acid. 99mTc-labeling was accomplished by adding ~ 1.5 mL of Na99mTcO4 solution (1,110 - 1,850 MBq). The reconstituted vial was heated in a 100 oC water bath for 20 - 30 min. Radiochemical purity determined by radio-HPLC must be >95% before being used for both imaging and biodistribution studies. Doses for biodistribution were prepared by dissolving the radiotracer in saline to a concentration of ~1.1 MBq/mL. For SPECT/CT imaging, doses were prepared by dissolving the radiotracer in saline to a concentration of 370 - 740 MBq /mL. The dose solution was filtered with a 0.20 μm Millex-LG filter before being injected into animals. Each animal was injected with 0.1 - 0.2 mL of the dose solution.
Cell Culture. MDA-MB-435 cell line was obtained from ATCC (American Type Culture Collection, Manassas, VA). Tumor cells were grown at 37 ºC in Minimal Essential Medium (Alpha Modification) supplemented with 10% fetal bovine serum (FBS, ATCC) and 1% penicillin and streptomycin solution (GIBCO Industries Inc., Langley, OK), and at 37 °C in a humidified atmosphere of 5% CO2 in air. Cells were grown as monolayers and were harvested or split when they reached 90% confluence to maintain exponential growth.
Animal Model. Biodistribution and imaging studies were performed using athymic nude mice bearing MDA-MB-435 breast cancer xenografts in compliance NIH animal experiment guidelines (Principles of Laboratory Animal Care, NIH Publication No. 86-23, revised 1985). The protocol for animal studies has been approved by the Purdue University Animal Care and Use Committee (PACUC). Female athymic nu/nu mice were purchased from Harlan (Indianapolis, IN) at 4 - 5 weeks of age. Each animal implanted with 5 × 10⁶ MDA-MB-435 cells into the fat pad. The tumor volume was measured every two days for the first two weeks, every day for next 3 weeks, and calculated by the formula: (length × width2)/2. Animals were subjected to biodistribution and imaging at specified times.
Linifanib Treatment Protocol. Groups (n = 5) were size-matched with an average tumor volume of 180 ± 90 mm3 one day before baseline SPECT/CT imaging. Vehicle (0.15% hydroxypropylmethyl cellulose, 2% ethanol, 5% Tween 80, 20% PEG400, 73% saline) or linifanib treatment was initiated at a dose of 12.5 mg/kg on day 0 after baseline imaging. Linifanib was dosed orally twice daily, with a time interval of >8 h between consecutive doses.
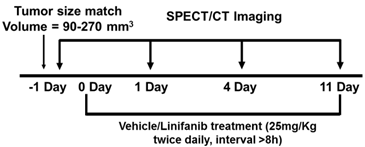
Imaging Protocol for SPECT/CT. Longitudinal SPECT/CT imaging was performed at -1, 1, 4 and 11 days after initiation of linifanib treatment using a u-SPECT-II/CT scanner (Milabs, Utrecht, The Netherlands) equipped with 0.6 mm multi-pinhole collimators. Linifanib was dosed two hours prior to SPECT/CT. One hour before SPECT/CT imaging, 99mTc-3P-RGD2 (37 - 55.5 MBq) was administered via the lateral tail vein. Anesthesia was induced using an air flow rate of 350 mL/min and approximately 3.0% isoflurane. After induction of anesthesia, the air flow rate was reduced to 250 mL/min with approximately 2.0% isoflurane. SPECT images were acquired using 75 projections over 30 minutes. After SPECT acquisition, CT imaging was performed using 'normal' acquisition settings (2 degree intervals) at 45 kV and 500 μA. SPECT reconstruction, data processing and quantification of organ uptake were performed according to literature methods [56, 57]. Reconstructed images were visualized as both orthogonal slices and maximum intensity projections. The tumor uptake of 99mTc-3P-RGD2 was reported as the percentage of injected dose (%ID) and percentage of injected dose per unit volume (%ID/cm3), and was compared with that obtained from biodistribution.
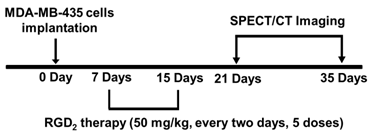
RGD2 Treatment Protocol. Each mouse was implanted subcutaneously with 5 × 10⁶ MDA-MB-435 cells into the fat pads. Seven days after inoculation of MDA-MB-435 cells, the tumor-bearing mice were randomly divided into 2 groups: the vehicle-treated group (n = 5) and RGD2-treated group (n = 5) administered intravenously by tail-vein injection of RGD2 at a dose of 50 mg/kg. The RGD2-treatment was continued for 10 days (a dose every two days with a total of 5 doses). Animals in the vehicle-treated group were administered with equal volume of saline. SPECT/CT imaging was performed at week 1 or week 3 after the final dose of RGD2 treatment. Quantification of organ uptake and tumor-to-background ratios were performed according to the methods described in our previous reports [56, 57]. Muscle was used as background. The region fo interest (ROI ~ 0.01cm3) was drawn over the contralateral forelimb. Tumor/muscle (T/M) ratios were calculated on the basis of %ID/cm3 uptake values of 99mTc-3P-RGD2 in tumor and muscle of the same animal, and were reported as the means ± the standard deviation.
Biodistribution Protocol. The tumor-bearing mice (tumor sizes = 0.05 - 1.5 g) were used for biodistribution studies. Each animal (20 - 25 g) was administered with ~110 kBq of 99mTc-3P-RGD2 by tail vein injection. Animals were sacrificed by sodium pentobarbital overdose (~200 mg/kg) at 60 min post-injection (p.i.). Blood was withdrawn from the heart of tumor-bearing mice. Tumors and normal organs (brain, eyes, heart, spleen, lungs, liver, kidneys, muscle and intestine) were harvested, washed with saline, dried with absorbent tissue, weighed, and counted on a Perkin Elmer Wizard - 1480 γ-counter (Shelton, CT). The organ uptake was calculated as the percentage of injected dose (%ID) and percentage of injected dose per gram of tissue (%ID/g).
Tumor Immunohistochemistry. Tumor tissues were harvested from animals, and were snap-frozen in the OCT (optical cutting temperature) solution (Sakara, Torrance, CA). Tumor tissues were then cut into slices (5 μm). After drying at room temperature, slices were fixed with ice-cold acetone for 10 min, and dried in air for 20 min at room temperature. Sections were blocked with 10% goat serum for 30 min at room temperature, and then were incubated with the hamster anti-integrin β3 antibody (1:100, BD Biosciences, San Jose, CA) and rat anti-CD31 antibody (1:100, V:V; BD Biosciences) for 1 h. After incubating with Cy3-conjugated goat anti-hamster and FITC-conjugated goat anti-rat secondary antibodies (1:100, Jackson ImmunoResearch Inc., West Grove, PA) and washing with PBS, the fluorescence was visualized with a Nikon fluorescence microscope. All pictures were taken under 200x magnification with the same exposure time.
Statistical Analysis. All data were expressed as means plus/minus standard deviation based on results from five animals. Statistical analysis was performed by one-way analysis of variance (ANOVA) followed by the Newman-Keuls test. The level of significance was set at p < 0.05. GraphPad Prism 5 (GraphPad Software Inc., La Jolla, CA) was used for linear and nonlinear regression analysis.
RESULTS
Monitoring of Breast Tumor Growth. Figure 1A shows 3D and transverse views of SPECT/CT images of a tumor-bearing mouse at 5, 7, 14, 21, 28 and 35 days after inoculation of MDA-MB-435 breast tumor cells. Small tumors (Figure 1A: D5) was readily detected with excellent contrast. When the tumor size was 0.15 - 0.40 cm3, the radioactivity distribution was relatively uniform. After week 3, the tumors were >0.50 cm3, and the radioactivity distribution heterogeneity was significant due to tumor necrosis (Figure 1A: D28). By week 5, there was extensive necrosis in MDA-MB-435 breast tumors. Necrotic regions had little radioactivity accumulation (Figure 1A: D28 - D35) due to lack of integrin αvβ3 expression (Figure 1B).
Comparison of Breast Tumor Uptake Values from SPECT/CT and Biodistribution. To validate u-SPECT-II/CT as a tool for quantification of the tumor uptake of 99mTc-3P-RGD2, we performed a biodistribution study using animals with tumor size being 0.01 - 1.2 g, and compared the tumor uptake values to those from SPECT/CT quantification. Figure 2 exhibits the relationship between the tumor size (cm3) and the tumor uptake (%/ID for total radioactivity and %/ID/g or %/ID/cm3 for radioactivity concentration) determined by SPECT/CT (A and C) and biodistribution (B and D). Apparently, the tumor uptake of 99mTc-3P-RGD2 from SPECT/CT was almost identical to that from biodistribution. Similar results were also seen in the U87MG model [64]. u-SPECT-II/CT is excellent imaging platform for accurate quantification of tumor uptake of 99mTc-3P-RGD2 in small animals.
Tumor Uptake Changes during Tumor Growth. When the tumors were very small (<0.1 cm3), their uptake of 99mTc-3P-RGD2 were low due to lack of integrin αvβ3 contribution from neovasculature. Between weeks 2 and 3, the tumor size was in the range of 0.15 - 0.30 cm3, and the %ID/g tumor uptake of 99mTc-3P-RGD2 peaked (Figure 2: B and D). Between weeks 4 and 5, the tumor size was >0.5 cm3. During this period, the % ID tumor uptake of 99mTc-3P-RGD2 was enhanced steadily with increased tumor size (Figure 2: A and C), but its % ID/g uptake decreased slowly due to necrosis (Figure 1B), maturation of blood vessels, and larger interstitial space [63]. The overall relationship between tumor volume and % ID uptake of 99mTc-3P-RGD2 was linear (Figure 2: A: R2 = 0.923; and C: R2 = 0.859). The relationship between tumor size and %ID/cm3 tumor uptake of 99mTc-3P-RGD2 was best described as quadratic polynomial (Figure 2: B and D).
Fig 1
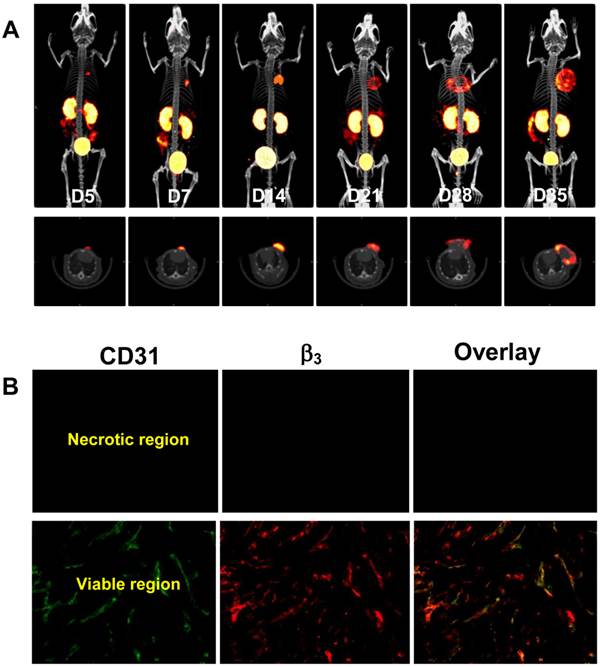
A: The 3D (upper panel) and transverse (lower panel) views of SPECT/CT images of a mouse with bearing MDA-MB-435 breast cancer xenografts at 5, 7, 14, 21, 28 and 35 days after inoculation of MDA-MB-435 human breast cancer cells. The animal was administered with 37 - 55.5 MBq of 99mTc-3P-RGD2 via the lateral tail vein. B: Microscopic images (Original magnification: ×200) of tumor slice selected from the necrotic and viable regions after immunohistochemical staining for integrin β3 and CD31. The tumor tissue was harvested on day 28 days after inoculation of MDA-MB-435 cells. CD31 was used as a biomarker for endothelial cells on blood vessels (both mature vasculature and neovasculture). Integrin β3 was visualized with Cy3 (red) and CD31 was visualized with FITC (green). The yellow color in overlay images indicates the presence of integrin β3 on neovasculature.
Fig 2
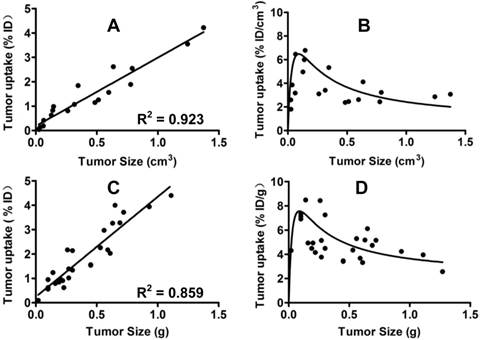
Left: Linear relationship between the tumor size (cm3) and the tumor uptake (%/ID for total radioactivity accumulation) determined by SPECT/CT quantification (A) and biodistribution (C). Right: Relationship between the tumor size (g) and tumor uptake (%/ID/g or %/ID/cm3 for radioactivity concentration) obtained from SPECT/CT quantification (B) and biodistribution (D: n = 26).
Integrin αvβ3 Expression Changes during Tumor Growth. Figure 3 displays selected microscopic images of the slices obtained from the xenografted MDA-MB-435 tumors (0.05 g, 0.13 g, 0.28 g, 0.55 g and 0.88 g) after immunohistochemical staining for integrin β3 and CD31. As expected, small tumors (<0.05g) had few microvessels with very little integrin αvβ3 expression. When tumors became larger (0.2 - 0.5 g), the blood vessel density was increased, as illustrated by the enhanced yellow and orange colors on overlay images. When tumors were > 0.5 g, the tumor blood vessel density decreased while the total integrin αvβ3 expression level was increased due to more contributions from MDA-MB-435 tumor cells, which was completely consistent with the %ID tumor uptake values of 99mTc-3P-RGD2 (Figure 2: B and D).
Fig 3
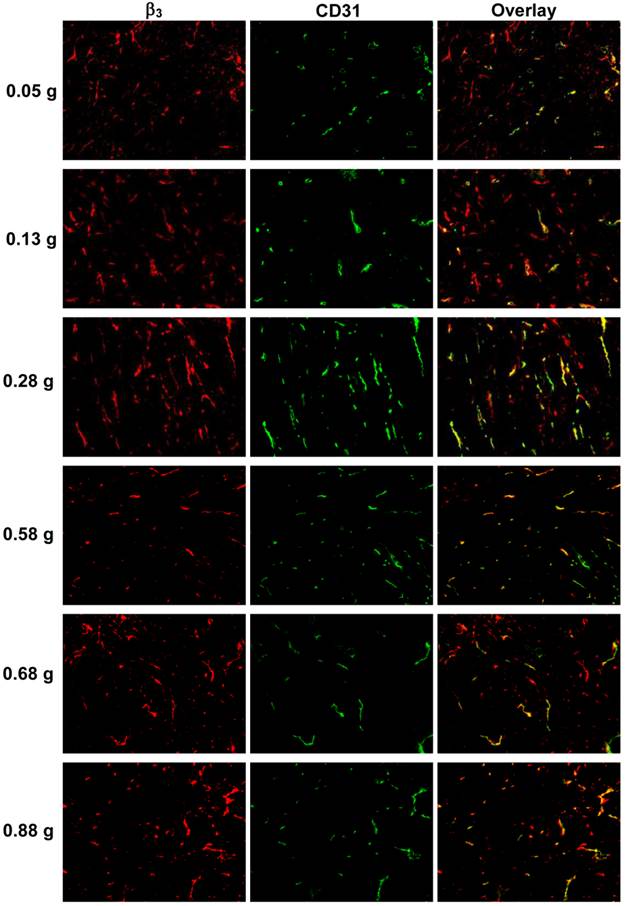
Microscopic images of frozen tumor slices from the xenografted MDA-MB-435 tumors (0.05 g, 0.13 g, 0.28 g, 0.55 g and 0.88 g) after immunohistochemical staining for integrin β3 and CD31. CD31 was used as a biomarker for tumor endothelial cells. Integrin β3 was visualized with Cy3 (red), and CD31 with FITC (green). Yellow color indicates the integrin β3 on new blood vessels.
Monitoring Tumor Response to Linifanib Therapy. Figure 4A compares tumor volume changes in both vehicle (n = 5) and linifanib (n = 5) treated groups. A significant difference in tumor volume (Figure 4A: p < 0.05) was seen between vehicle and linifanib-treated groups after 4 days of linifanib treatment. This effect is further illustrated by SPECT/CT images (Figure 4B) obtained at -1, 1, 4 and 11 days after initiation of linifanib therapy. Figure 5 shows SPECT/CT quantification data to illustrate early breast tumor response to linifanib antiangiogenesis therapy. In the linifanib-treated group, there was a dramatic reduction in both %ID and %ID/cm3 tumor uptake of 99mTc-3P-RGD2 as early as 24 h. It was clear that 99mTc-3P-RGD2 SPECT can detect much earlier biological changes (decrease in integrin αvβ3 expression level) as a result of linifanib therapy. The %ID tumor uptake of 99mTc-3P-RGD2 increased steadily in the vehicle-treated group (Figure 5A), while its %ID/cm3 tumor uptake decreased slowly over 11 day study period (Figure 5B).
Fig 4
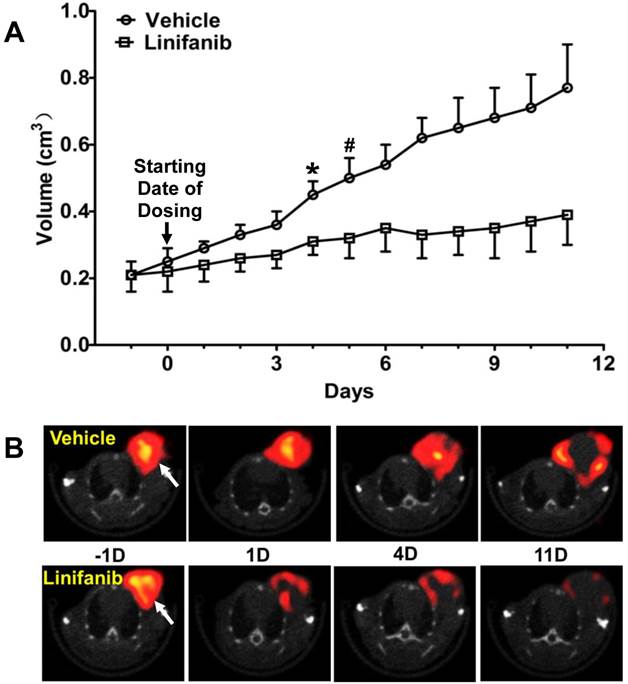
A: Comparison of tumor volumes in vehicle and linifanib-treated in the MDA-MB-435 models. Tumor volume was determined by caliper measurements. *: p < 0.05, significantly different from the vehicle-treated group. #: p < 0.01, significantly different from the vehicle-treated group from that specific date until the end of study. B: Transverse views of selected SPECT/CT images from athymic nude mice bearing MDA-MB-435 breast tumors in the vehicle (upper panel) and linifanib-treated groups (lower panel). SPECT/CT images were obtained at -1, 1, 4 and 11 days after initiation of linifanib therapy to illustrate the early tumor response in terms of tumor uptake and integrin avβ3 expression levels. Arrows indicate the presence of tumors.
Fig 5
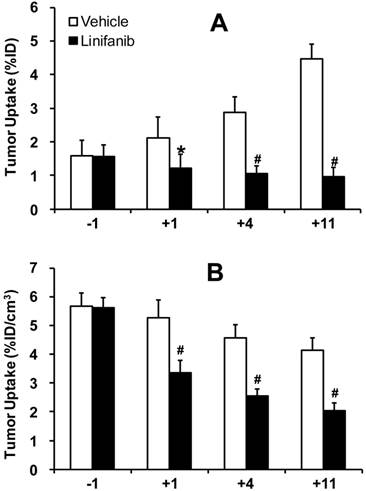
Direct comparison of the %ID tumor uptake (top) and %ID/cm3 tumor uptake (bottom) of 99mTc-3P-RGD2 in the vehicle (n = 5) and linifanib-treated (n = 5) groups. The tumor uptake values were calculated from quantification of SPECT/CT images. *: p < 0.05, significantly different from the vehicle-treated group. #: p < 0.01, significantly different from the vehicle-treated group.
Comparison of Tumor Response in Different Animal Models. Figure 6 compares the changes in %ID/cm3 tumor uptake and T/M ratios of 99mTc-3P-RGD2 after linifanib treatment in three different xenografted tumor-bearing animal models (U87MG with high integrin αvβ3 expression on tumor cells and tumor neovasculature; MDA-MB-435 with moderate integrin αvβ3 expression on tumor cells and neovasculature; and PC-3 with low integrin αvβ3 expression on tumor cells and neovasculature). The %ID/cm3 tumor uptake and T/M ratios of 99mTc-3P-RGD2 in U87MG glioma and PC-3 prostate models were obtained from our previous studies [64]. The degree of tumor response (Figure 6A: defined by the %ID/cm3 tumor uptake change of 99mTc-3P-RGD2) to linifanib therapy was highest for U87MG gliomas, moderate for MDA-MB-435 breast tumors, and lowest for PC-3 prostate tumors. T/M ratio changes in the xenografted U87MG and MDA-MB-435 tumors were more significant than those in PC-3 tumors. There was no significant difference (Figure 6B) in T/M ratio changes between the U87MG and MDA-MB-435 models within experiemtnal errors.
Fig 6
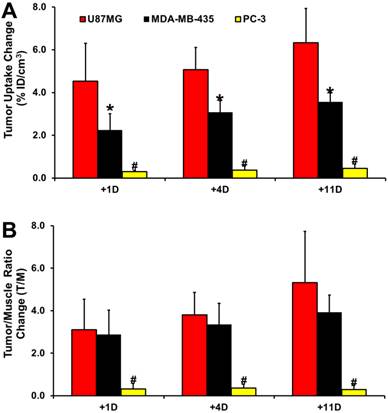
Comparison of changes in %ID/cm3 tumor uptake (A) and T/M ratios (B) of 99mTc-3P-RGD2 after linifanib treatment in three different tumor-bearing animal models (U87MG: high integrin αvβ3 expression on tumor cells and neovasculature; MDA-MB-435: moderate integrin αvβ3 expression on tumor cells and neovasculature; PC-3: low integrin αvβ3 expression on tumor cells and neovasculature). Tumor uptake values were calculated from quantification of SPECT/CT images. The %ID/cm3 tumor uptake and T/M ratios of 99mTc-3P-RGD2 in the U87MG and PC-3 models were obtained from our previous report [64]. The changes in %ID/cm3 tumor uptake and T/M ratios were calculated by subtracting the value on a specific date (+1, +4 and +11) from the value on day -1. *: p < 0.05, significantly different from those in the U87MG and PC-3 models. #: p < 0.01, significantly different from those in the U87MG and MDA-MB-435 models.
Effects of Linifanib on Tumor Vasculature and Integrin αvβ3 Expression. Immunohistochemical staining was performed to study the impact of linifanib treatment on integrin αvβ3 and CD31 expression in MDA-MB-435 tumors. Figure 7 (top) shows overlay images of the tumor slices stained with hamster anti-integrin β3 (red color) or rat anti-CD31 (green color) antibody in both vehicle and linifanib-treated groups. The yellow color in overlay images indicates the presence of integrin β3 on new blood vessels. It was quite clear that the effect of linifanib therapy was on both tumor cells and tumor neovasculature as indicated by the disappearance of red (breast tumor cells) and yellow/orange (neovasculature) colors for integrin αvβ3 in the overlay images. After 24 h of linifanib therapy, the integrin αvβ3 on neovasculature disappeared almost completely while the tumor cell integrin αvβ3 expression level decreased steadily during the 11-day period (Figure 7: top). This was further supported by the pathological H&E staining data of tumor slices in vehicle and linifanib-treated groups (Figure 7: bottom) at -1 and 1 days. Within 24 h after initiation of linifanib therapy, the blood vessel density was dramatically reduced. These data clearly show that linifanib treatment had a strong impact on both breast tumor cells and neovasculature.
Relationship between Tumor Response and Integrin αvβ3/CD31expression. Figure 8 shows plots of the %ID/cm3 tumor uptake changes after linifanib treatment against integrin αvβ3 (left) and CD31 (right) expression levels in the U87MG, MDA-MB-435 and PC-3 models at the time of diagnosis. The tumor uptake change was calculated by deducting the %ID/cm3 tumor uptake of 99mTc-3P-RGD2 on days 1, 4 and 11 from its %ID/cm3 tumor uptake on -1 day for the same animal. Integrin αvβ3 and CD31 expression levels were obstained from the tumors (0.1 - 0.3 g) without significant necrosis. Obviously, there was an excellent linear relationship between %ID/cm3 tumor uptake changes (the tumor response or therapeutic effect) and the total integrin αvβ3 expression levels (integrin αvβ3 density) at the time of diagnosis (-1 day). The same linear relationship was also seen between the tumor response and the CD31 expression levels (blood vessel density).
Fig 7
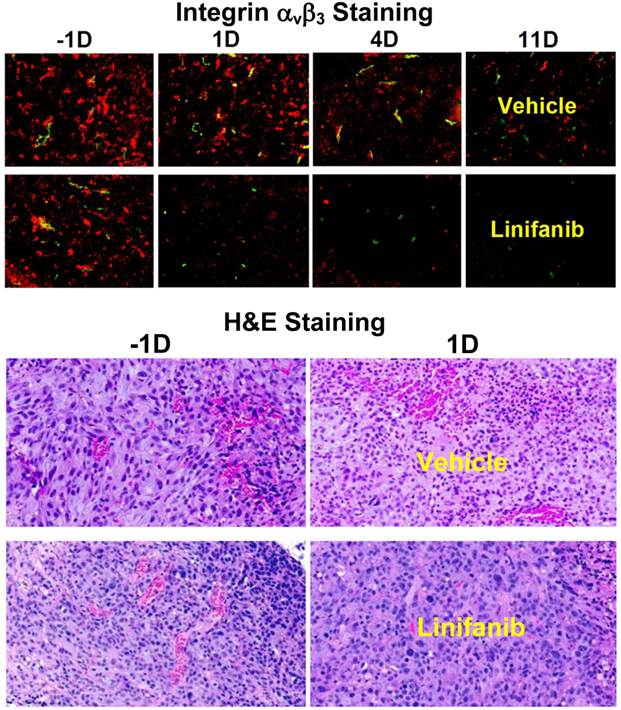
A: Overlay images of MDA-MB-435 tumor tisues after immunohistochemical staining for integrin β3 and CD31 in vehicle (upper panel) and linifanib-treated groups (lower panel) to illustrate the changes in integrin β3 expression level and blood vessel density during linifanib therapy. Tumor tissues were harvested at -1, 1, 4 and 11 days after initiation of linifanib therapy. CD31 was the marker for tumor blood vessels (both mature and newly formed), which was visualized with FITC (green color). Integrin β3 was visualized with Cy3 (red color). The yellow color in overlay images indicates the presence of integrin β3 on new blood vessels. B: Images of selected histological slice (H&E stained) of tumor tissues from animals in the vehicle (upper panels) and linifanib-treated (lower panels) groups to illustrate vascular density changes after only one day of linifanib therapy. Red color indicates the presence of blood vessels.
Fig 8
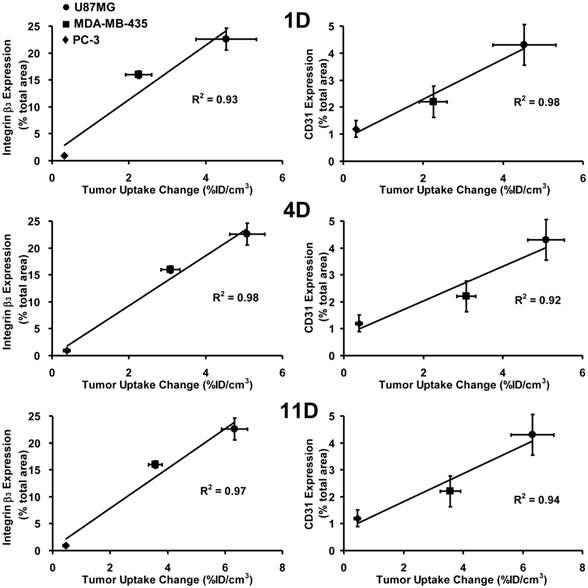
Linear relationship between the %ID/cm3 tumor uptake change at days 1 (top), 4 (middle) and 11 (bottom) after linifanib therapy and the expression levels of integrin αvβ3 (left) and CD31 (right) in three animal models. The %ID/cm3 tumor uptake values of 99mTc-3P-RGD2 were calculated from SPECT/CT quantification, and reported as the mean plus/minus standard error of the mean based on results from five animals (n = 5). The %ID/cm3 tumor uptake values and integrin αvβ3/CD31 expression levels in the U87MG and PC-3 tumors were obtained from our previous report [64]. The %ID/cm3 tumor uptake change was calculated by deducting the %ID/cm3 tumor uptake of 99mTc-3P-RGD2 on days 1, 4 and 11 from its original value on -1 day (before linifanib therapy) in the same animal. The average %ID/cm3 tumor uptake change is used as an indicator of tumor response to linifanib antiangiogenesis treatment.
Effects of RGD2 Therapy on Tumor Volume. Figure 9A shows the tumor growth curves during 42 days of study period for both vehicle (n = 5) and RGD2-treated (n = 5) groups. No significant difference in tumor volumes was found over first 3 days after initiation of RGD2 therapy. After two doses of RGD2 (4 days after initiation of RGD2 therapy), there was significant tumor volume reduction in RGD2-treated group. By the time of the final dose (10 days after initiation of RGD2 therapy), the tumor volume in the vehicle-treated group was almost 3x larger than that in RGD2-treated group. Obviously, there was a significant therapeutic effect from RGD2 treatment on the basis of tumor volume change. However, RGD2 treatment had to be stopped after five doses of RGD2 because of toxicity, as indicated by significant weight loss (Figure 9B).
Fig 9
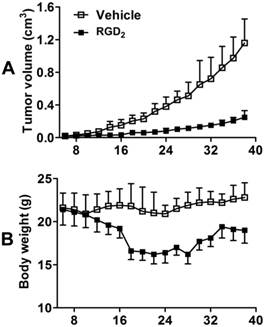
Tumor growth curves (A) and body weight changes (B) for vehicle (n = 5) and RGD2-treated (n = 5) groups in the xenografted MDA-MB-435 breast tumor model. Tumor size was calculated on the basis of caliper measurements according the formula (length × width2)/2. Body weight was measured by balance. RGD2 treatment had to be stopped after five doses of RGD2 because of toxicity, as indicated by significant weight loss. The body weight recovered after termination of RGD2 treatment.
Effects of RGD2 Therapy on Tumor Uptake. SPECT/CT images (Figure 10: top) were obtained before RGD2 treatment, and at 21 and 35 days after inoculation of MDA-MB-435 cells. Tumor volumes (A), tumor uptake (B: %ID and C: %ID/cm3) and T/M ratios (D) were calculated from SPECT/CT quantification. Since the tumor retention time of RGD2 was ~15 h [65], a 7-day interval between the final RGD2 dosing and the first SPECT/CT imaging study was used to make sure that there was no significant blockage of 99mTc-3P-RGD2 binding to integrin αvβ3. As expected, there was significant reduction in tumor volume (Figure 10A) and %ID tumor uptake (Figure 10B) of 99mTc-3P-RGD2 between the vehicle and RGD2-treated animals. However, its %ID/cm3 tumor uptake was comparable in vehicle and RGD2-treated groups within experimental errors (Figure 10C: p > 0.05) at 7 days post RGD2 treatment. By 21 days after RGD2 therapy, the %ID/cm3 uptake in RGD2-treated group was significantly higher than that in vehicle group (Figure 10C: p < 0.05) while T/M ratios were almost identical at both time points (Figure 10D). RGD2 therapy resulted in significant reduction in both the tumor volume and %ID tumor uptake (the tumor radioactivity) of 99mTc-3P-RGD2 (Figure 10: A and B); but it also led to the enhanced %ID/cm3 tumor uptake (the radioactivity density) of 99mTc-3P-RGD2 (Figure 10C).
Fig 10
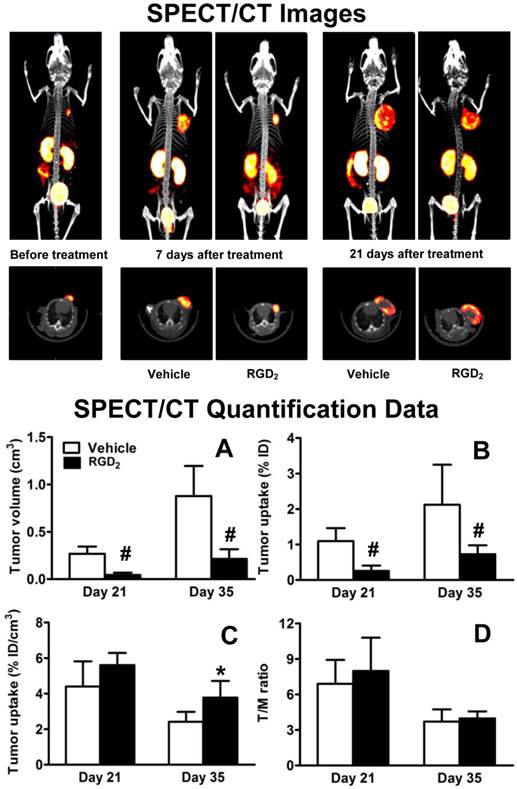
Top: The 3D and transverse views of SPECT/CT images of tumor-bearing mice before RGD2 treatment, as well as on day 21 and 35 after inoculation of MDA-MB-435 cells (or on day 7 and 21 after final dose of RGD2). SPECT image at day 7 was used only for comparison purposes. Bottom: SPECT/CT quantification data, including tumor volumes (A), %ID tumor uptake (B), %ID/cm3 tumor uptake (C), and T/M ratios (D) in vehicle (n = 5) and RGD2-treated (n = 5) groups. *p < 0.05 and # p < 0.01: significantly different from the vehicle-treated group.
Discussion
In this study, we found that 99mTc-3P-RGD2 is an excellent radiotracer for imaging MDA-MB-435 tumors (Figure 1A). As shown in Figure 2, the uptake values (%ID and %ID/cm3) of 99mTc-3P-RGD2 from SPECT/CT is almost identical to those from biodistribution. There was also a linear relationship between tumor size and %ID uptake of 99mTc-3P-RGD2 (Figure 2: A and C). These results strongly suggested that the tumor uptake obtained from SPECT/CT images can accurately reflect the total tumor integrin αvβ3 expression. 99mTc-3P-RGD2 is useful for monitoring integrin αvβ3 expression changes during tumor growth (Figure 1A).
[18F]AH111585 has been used to monitor sunitinib therapy response [43-45], and its tumor uptake was significantly reduced 2 days after sunitinib therapy. It was believed that [18F]AH111585 was better than [18F]FDG for imaging angiogenesis [45]. 64Cu-DOTA-RGD was used to monitor dasatinib therapy [46]. It was also found that dasatinib was able to significantly reduce the uptake of 64Cu-DOTA-RGD in the “treated” tumors. A significant challenge for [18F]AH111585 and many 18F-based PET radiotracers to assume a wide-spread clinical utility is their poor clinical availability. In contrast, 99mTc-3P-RGD2 is readily prepared with very high specific activity using a kit formulation [54, 55]. From availability point of view, 99mTc-3P-RGD2 has significant advantages of the corresponding 18F PET radiotracers.
Inhibition of VEGF and PDGF receptors with linifanib normalizes tumor vasculature [9-11, 13, 14]. Since growth factors (e.g. VEGF) increase integrin αvβ3 expression [40-42], inhibition of VEGF and PDGF receptors could lead to a decrease of integrin αvβ3 expression. This makes integrin αvβ3 a mechanistically relevant biomarker to assess the tumor response to linfanib therapy. In this study, we found significant decreases in the tumor uptake (%ID and %ID/cm3) of 99mTc-3P-RGD2 prior to tumor volume changes after linifanib treatment (Figures 4). Changes in tumor vasculature were confirmed by IHC staining data (Figure 7A) and pathological H&E analysis (Figure 7B).
It is interesting to note that the therapeutic effect of linifanib is not limited to tumor blood vessels. It is well-established that linifanib is a multi-targeted receptor tyrosine kinase inhibitor [9-14]. Since VEGF and PDGF receptors are overexpressed on tumor cells and neovasculature [41, 42], it is not surprising that linifanib has inhibitory effects on both tumor cells and tumor vasculature. There are two phases for the tumor response to linifanib therapy (Figure 5): a dramatic decrease in the tumor uptake (%ID and %ID/g) of 99mTc-3P-RGD2 within the first 24 h after initiation of linifanib therapy, and a steady tumor uptake reduction over the next 10 days of study period. The IHC and H&E staining data (Figure 7) suggest that the rapid decrease in tumor uptake of 99mTc-3P-RGD2 is most likely induced by antiangiogenic effect of linifanib on tumor neovasculature while the slow tumor uptake reduction is caused by either its direct inhibitory effect on tumor cells or slow tumor cell apoptosis as a result of normalization of tumor vasculature [9-11, 13, 14]. This explanation is supported by the sharp decrease of CD31 signals (Figure 7A) and tumor microvessel density (Figure 7B) over the first 24 h after initiation of linifanib treatment, followed by slow disappearance of fluorescence intensity from integrin β3 on tumor cells over the next 10 days of study period (Figure 7A).
In our previous study [64], we found that there was a significant decrease in tumor uptake (%ID and %ID/cm3) and T/M ratios of 99mTc-3P-RGD2 in the xenografted U87MG model while no significant changes in tumor volume or tumor uptake of 99mTc-3P-RGD2 were seen in the xenografted PC-3 model after linifanib treatment. In this study, we found that the changes in tumor volume (Figure 4) and tumor uptake of 99mTc-3P-RGD2 (Figure 6A) in the MDA-MB-435 model were between those observed in the U87MG and PC-3 models. This is consistent with the relative integrin αvβ3 expression levels on three xenografted tumors [56, 66], and reciprocal relationship between integrin αvβ3 and VEGFR2 [40-42]. We also found that there is a linear relationsip between the integrin αvβ3/CD31 expression levels and the tumor response, as indicated by changes in %ID/cm3 tumor uptake and T/M ratios of 99mTc-3P-RGD2 (Figure 8). Highly vascularized tumors (e.g. U87MG) with higher expression level of integrin αvβ3 and CD31 have better tumor response to linifanib therapy than poorly vascularized tumors (e.g. PC-3) with low expression levels of integrin αvβ3 and CD31. 99mTc-3P-RGD2 has the potential as a pre-treatment screening tool to select appropriate patients who will benefits most from the antiangiogenic linifanib treatment. If the tumor in cancer patient has a high expression level of integrin αvβ3, as indicated by the high tumor uptake of 99mTc-3P-RGD2 in SPECT/CT images at the time of diagnosis, antiangiogenic linifanib therapy would more likely be effective. If the tumor has very little integrin αvβ3 expression (low tumor uptake of 99mTc-3P-RGD2), the antiangiogenic therapy would not be effective regardless the amount of linifanib administered into each cancer patient.
It is important to note that there are no accurate techniques to quantify absolute integrin αvβ3 expression levels. Western blotting was used to determine the total integrin αvβ3 protein concentration in tumor tissues [44, 45, 56, 67, 68]; but the percentage of integrin αvβ3 recovery from the tumor tissue and its activation state remained unknown. We have been using IHC staining with anti-integrin β3 antibodies to determine the relative expression levels of integrin αvβ3 in the tumor tissues [56, 66]. This technique is a better fit to reflect the activation state of integrin αvβ3 in acetone-fixed tumor tissues since only the activated integrin αvβ3 is able to bind the fluorescence-labeled anti-integrin β3 monoclonal antibody. We also found that the primary antibody is very important for IHC staining of tumor tissues. In this study, we use hamster anti-human integrin β3 antibody for staining of integrin αvβ3 on both tumor cells and neovasculature mainly because of the murine nature of xenografted tumor tissues. It must be noted that quantification of absolute fluorescent intensity is operator-dependent and subjected to individual interpretation. Tumors of different sizes might have different integrin αvβ3 expression patterns because of tumor necrosis. The integrin αvβ3 expression pattern is heterogeneous even in the same tumor tissue. Thus, the relative expression levels of integrin αvβ3 and CD31 only represent the status under specific experimental conditions, such as the primary integrin αvβ3 monoclonal antibody, animal species, inoculation location of tumor cells, tumor types, and tumor size.
As illustrated in this study, there is significant challenge in using 99mTc-3P-RGD2 to monitor early tumor response to RGD2 therapy. Since 99mTc-3P-RGD2 and RGD2 target the same receptor, there must be a waiting period to allow RGD2 to dissociate completely from integrin αvβ3 sites before using 99mTc-3P-RGD2 to determine integrin αvβ3 level changes after RGD2 therapy. Otherwise, it would be difficult to determine if changes in tumor uptake are actually caused by its blocking effect or therapeutic effect. It is also important to note that the waiting period also depends on tumor retention time of the anti-αvβ3 agent. If its tumor retention time is short (2 - 3 h), it is possible to image tumors with 99mTc-3P-RGD2 24 h (~10 half-lives) after anti-αvβ3 therapy. Since its tumor retention time is ~15 h [65], it would take 6 - 7 days for RGD2 to dissociate completely from integrin αvβ3 sites. During this period, the tumor might undergo significant biological changes. Therefore, it is difficult to use the integrin αvβ3-targeted radiotracers (e.g. 99mTc-3P-RGD2) to accurately monitor early tumor response to anti-αvβ3 therapy.
There is no doubt that RGD2 can significantly reduce the tumor size (Figure 10A) and %ID tumor uptake (Figure 10B) of 99mTc-3P-RGD2; but its %ID/cm3 tumor uptake in RGD2-treated group was higher (p < 0.05) than that in vehicle-treated group (Figure 10C). It is possible that RGD2 was able to block the integrin αvβ3 sites in RGD2-treated group, resulting in tumor growth inhibition, as indicated by tumor volume reduction. Once RGD2 therapy stopped, RGD2 slowly dissociated from tumor cells and neovasculature. As a result, integrin αvβ3 is activated again. Recently it was reported that low concentrations of integrin αvβ3 and αvβ5 inhibitors (e.g. Cilengitide) can stimulate tumor growth and angiogenesis by altering αvβ3 integrin and VEGFR-2 trafficking, thereby promoting endothelial cell migration to VEGF [69]. That might explain why the %ID/g tumor uptake of 99mTc-3P-RGD2 in RGD2-treated group was higher than that in vehicle-treated group 3 weeks after RGD2 therapy (Figure 10C). More studies are needed to understand the integrin αvβ3 expression or activation state changes after anti-αvβ3 RGD2 therapy, as well as their relationship with the %ID/g tumor uptake of 99mTc-3P-RGD2.
CONCLUSION
In this study, we clearly show that 99mTc-3P-RGD2 SPECT/CT is a useful molecular imaging tool for monitoring the integrin αvβ3 expression changes during breast tumor growth or during/after linifanib antiangiogenic therapy. 99mTc-3P-RGD2 SPECT/CT is also a useful pre-treatment screening tool to identify the cancer patient who will benefits best from antiangiogenic therapy with linifanib or related antiangiogenic drugs of the same or similar mechanism. However, it is difficult to use the integrin αvβ3-targeted radiotracers, such as 99mTc-3P-RGD2, for monitoring the early tumor response to anti-αvβ3 therapy with Cilengitide or RGD2. This conclusion may also apply to other radiotracers and anti-cancer drugs that target the same receptor.
Acknowledgements
Authors thank AbbVie Inc. (North Chicago, IL) for the use of Linifanib. This work was supported by Purdue University, the Challenge Research Award from Purdue Cancer Center, the Indiana Clinical and Translational Sciences Institute funded in part by grant Number TR000006 (Clinical and Translational Award) from the National Institutes of Health, National Center for advancing Translational Science, and R01 CA115883 (S.L.) from the National Cancer Institute.
COMPETING INTERESTS
The authors have declared that no competing interest exists.
References
1. Folkman J. Role of angiogenesis in tumor growth and metastasis. Semin Oncol. 2002;29:15-18
2. Mousa SA. Anti-integrin as novel drug-discovery targets: potential therapeutic and diagnostic implications. Curr Opin Chem Biol. 2002;6:534-541
3. Guo W, Giancotti FG. Integrin signalling during tumour progression. Nat Rev Mol Cell Biol. 2004;5:816-826
4. Felding-Habermann B. Integrin adhesion receptors in tumor metastasis. Clin Exp Metastasis. 2003;20:203-213
5. Bergers G, Benjamin LE. Tumorigenesis and the angiogenic switch. Nat Rev Cancer. 2003;3:401-410
6. Bergers G, Song S, Meyer-Morse N, Bergsland E, Hanahan D. Benefits of targeting both pericytes and endothelial cells in the tumor vasculature with kinase inhibitors. J Clin Invest. 2003;111:1287-1295
7. Ferrara N, Kerbel RS. Angiogenesis as a therapeutic target. Nature. 2005;438:967-974
8. Haddley K. Linifanib Receptor tyrosine kinase inhibitor Oncolytic. Drug Future. 2010;35:106-112
9. Zhou J, Goh BC, Albert DH, Chen CS. ABT-869, a promising multi-targeted tyrosine kinase inhibitor: from bench to bedside. J Hematol Oncol. 2009;2:33-45
10. Jiang F, Albert DH, Luo Y, Tapang P, Zhang K, Davidsen SK, Fox GB, Lesniewski R, McKeegan EM. ABT-869, a multitargeted receptor tyrosine kinase inhibitor, reduces tumor microvascularity and improves vascular wall integrity in preclinical tumor models. J Pharmacol Exp Ther. 2011;338:134-142
11. Shankar DB, Li J, Tapang P, Owen McCall J, Pease LJ, Dai Y, Wei RQ, Albert DH, Bouska JJ, Osterling DJ, Guo J, Marcotte PA, Johnson EF, Soni N, Hartandi K, Michaelides MR, Davidsen SK, Priceman SJ, Chang JC, Rhodes K, Shah N, Moore TB, Sakamoto KM, Glaser KB. ABT-869, a multitargeted receptor tyrosine kinase inhibitor: inhibition of FLT3 phosphorylation and signaling in acute myeloid leukemia. Blood. 2007;109:3400-3408
12. Hernandez-Davies JE, Zape JP, Landaw EM, Tan X, Presnell A, Griffith D, Heinrich MC, Glaser KB, Sakamoto KM. The multitargeted receptor tyrosine kinase inhibitor linifanib (ABT-869) induces apoptosis through an Akt and glycogen synthase kinase 3β-dependent pathway. Mol Cancer Ther. 2011;10:949-959
13. Zhang Y, Cole T, Tapang P, Luo F, Hradil V, Jiang F, Luo Y, Albert D, Fox GB. Total lesion glycolysis and FDG SUV as early readouts of tumor response to Linifanib (ABT-869) in SCID mice with HT1080 xenografts. J Nucl Med. 2010;51:111
14. Luo Y, Jiang F, Cole TB, Hradil VP, Reuter D, Chakravartty A, Albert DH, Davidsen SK, Cox BF, McKeegan EM, Fox GB. A novel multi-targeted tyrosine kinase inhibitor, linifanib (ABT-869), produces functional and structural changes in tumor vasculature in an orthotopic rat glioma model. Cancer Chemother Pharmacol. 2012;69:911-921
15. Wong CI, Koh TS, Soo R, Hartono S, Thng CH, McKeegan E, Yong WP, Chen CS, Lee SC, Wong J, Lim R, Sukri N, Lim SE, Ong AB, Steinberg J, Gupta N, Pradhan R, Humerickhouse R, Goh BC. Phase I and biomarker study of ABT-869, a multiple receptor tyrosine kinase inhibitor, in patients with refractory solid malignancies. J Clin Oncol. 2009;27:4718-4726
16. Tannir NM, Wong YN, Kollmannsberger CK, Ernstoff MS, Perry DJ, Appleman LJ, Posadas EM, Cho D, Choueiri TK, Coates A, Gupta N, Pradhan R, Qian J, Chen J, Scappaticci FA, Ricker JL, Carlson DM, Michaelson MD. Phase 2 trial of linifanib (ABT-869) in patients with advanced renal cell cancer after sunitinib failure. Eur J Cancer. 2011;47:2706-2714
17. Foote RL, Weidner N, Harris J, Hammond E, Lewis JE, Vuong T, Ang KK, Fu KK. Evaluation of tumor angiogenesis measured with microvessel density (MVD) as a prognostic indicator in nasopharyngeal carcinoma: results of RTOG 9505. Int J Radiat Oncol Biol Phys. 2005;61:745-753
18. El-Assal ON, Yamanoi A, Soda Y, Yamaguchi M, Igarashi M, Yamamoto A, Nabika T, Nagasue N. Clinical significance of microvessel density and vascular endothelial growth factor expression in hepatocellular carcinoma and surrounding liver: possible involvement of vascular endothelial growth factor in the angiogenesis of cirrhotic liver. Hepatology. 1998;27:1554-1562
19. O'Connor JP, Jackson A, Parker GJ, Jayson GC. DCE-MRI biomarkers in the clinical evaluation of antiangiogenic and vascular disrupting agents. Br J Cancer. 2007;96:189-195
20. Checkley D, Tessier JJ, Kendrew J, Waterton JC, Wedge SR. Use of dynamic contrast-enhanced MRI to evaluate acute treatment with ZD6474, a VEGF signalling inhibitor, in PC-3 prostate tumours. Br J Cancer. 2003;89:1889-1895
21. Evelhoch JL, LoRusso PM, He Z, DelProposto Z, Polin L, Corbett TH, Langmuir P, Wheeler C, Stone A, Leadbetter J, Ryan AJ, Blakey DC, Waterton JC. Magnetic resonance imaging measurements of the response of murine and human tumors to the vascular-targeting agent ZD6126. Clin Cancer Res. 2004;10:3650-3657
22. Bauerle T, Komljenovic D, Merz M, Berger MR, Goodman SL, Semmler W. Cilengitide inhibits progression of experimental breast cancer bone metastases as imaged noninvasively using VCT, MRI and DCE-MRI in a longitudinal in vivo study. Int J Cancer. 2011;128:2453-2462
23. Liapis H, Flath A, Kitazawa S. Integrin αvβ3 expression by bone-residing breast cancer metastases. Diagn Mol Pathol. 1996;5:127-135
24. Sengupta S, Chattopadhyay N, Mitra A, Ray S, Dasgupta S, Chatterjee A. Role of αvβ3 integrin receptors in breast tumor. J Exp Clin Cancer Res. 2001;20:585-590
25. Gasparini G, Brooks PC, Biganzoli E, Vermeulen PB, Bonoldi E, Dirix LY, Ranieri G, Miceli R, Cheresh DA. Vascular integrin αvβ3: a new prognostic indicator in breast cancer. Clin Cancer Res. 1998;4:2625-2634
26. Cooper CR, Chay CH, Pienta KJ. The role of αvβ3 in prostate cancer progression. Neoplasia. 2002;4:191-194
27. Carreiras F, Denoux Y, Staedel C, Lehmann M, Sichel F, Gauduchon P. Expression and localization of αv integrins and their ligand vitronectin in normal ovarian epithelium and in ovarian carcinoma. Gynecol Oncol. 1996;62:260-267
28. Falcioni R, Cimino L, Gentileschi MP, D'Agnano I, Zupi G, Kennel SJ, Sacchi A. Expression of β1, β3, β4, and β5 integrins by human lung carcinoma cells of different histotypes. Exp Cell Res. 1994;210:113-122
29. Natali PG, Hamby CV, Felding-Habermann B, Liang B, Nicotra MR, Di Filippo F, Giannarelli D, Temponi M, Ferrone S. Clinical significance of αvβ3 integrin and intercellular adhesion molecule-1 expression in cutaneous malignant melanoma lesions. Cancer Res. 1997;57:1554-1560
30. Gingras MC, Roussel E, Bruner JM, Branch CD, Moser RP. Comparison of cell adhesion molecule expression between glioblastoma multiforme and autologous normal brain tissue. J Neuroimmunol. 1995;57:143-153
31. Bello L, Francolini M, Marthyn P, Zhang J, Carroll RS, Nikas DC, Strasser JF, Villani R, Cheresh DA, Black PM. αvβ3 and αvβ5 integrin expression in glioma periphery. Neurosurgery. 2001;49:380-389
32. Felding-Habermann B, O'Toole TE, Smith JW, Fransvea E, Ruggeri ZM, Ginsberg MH, Hughes PE, Pampori N, Shattil SJ, Saven A, Mueller BM. Integrin activation controls metastasis in human breast cancer. Proc Natl Acad Sci U S A. 2001;98:1853-1858
33. Shattil SJ. Signaling through platelet integrin αIIbβ3: inside-out, outside-in, and sideways. Thromb Haemost. 1999;82:318-325
34. Pécheur I, Peyruchaud O, Serre CM, Guglielmi J, Voland C, Bourre F, Margue C, Cohen-Solal M, Buffet A, Kieffer N, Clézardin P. Integrin αvβ3 expression confers on tumor cells a greater propensity to metastasize to bone. FASEB J. 2002;16:1266-1268
35. Duan X, Jia SF, Zhou Z, Langley RR, Bolontrade MF, Kleinerman ES. Association of αvβ3 integrin expression with the metastatic potential and migratory and chemotactic ability of human osteosarcoma cells. Clin Exp Metastasis. 2004;21:747-753
36. Zitzmann S, Ehemann V, Schwab M. Arginine-glycine-aspartic acid (RGD)-peptide binds to both tumor and tumor-endothelial cells in vivo. Cancer Res. 2002;62:5139-5143
37. Meyer A, Auernheimer J, Modlinger A, Kessler H. Targeting RGD recognizing integrins: drug development, biomaterial research, tumor imaging and targeting. Curr Pharm Des. 2006;12:2723-2747
38. Liu S. Radiolabeled cyclic RGD peptides as integrin αvβ3-targeted radiotracers: maximizing binding affinity via bivalency. Bioconjug Chem. 2009;20:2199-2213
39. Zhou Y, Chakraborty S, Liu S. Radiolabeled Cyclic RGD Peptides as Radiotracers for Imaging Tumors and Thrombosis by SPECT. Theranostics. 2011;1:58-82
40. Mahabeleshwar GH, Feng W, Reddy K, Plow EF, Byzova TV. Mechanisms of integrin-vascular endothelial growth factor receptor cross-activation in angiogenesis. Circ Res. 2007;101:570-580
41. Soldi R, Mitola S, Strasly M, Defilippi P, Tarone G, Bussolino F. Role of αvβ3 integrin in the activation of vascular endothelial growth factor receptor-2. EMBO J. 1999;18:882-892
42. Somanath PR, Ciocea A, Byzova TV. Integrin and growth factor receptor alliance in angiogenesis. Cell Biochem Biophys. 2009;53:53-64
43. Beer AJ, Schwaiger M. PET of αvβ3-integrin and αvβ3-integrin expression with 18F-fluciclatide for assessment of response to targeted therapy: ready for prime time? J Nucl Med. 2011;52:335-337
44. Morrison MS, Ricketts SA, Barnett J, Cuthbertson A, Tessier J, Wedge SR. Use of a novel Arg-Gly-Asp radioligand, 18F-AH111585, to determine changes in tumor vascularity after antitumor therapy. J Nucl Med. 2009;50:116-122
45. Battle MR, Goggi JL, Allen L, Barnett J, Morrison MS. Monitoring tumor response to antiangiogenic sunitinib therapy with 18F-fluciclatide, an 18F-labeled αvβ3-integrin and αvβ5-integrin imaging agent. J Nucl Med. 2011;52:424-430
46. Dumont RA, Hildebrandt I, Su H, Haubner R, Reischl G, Czernin JG, Mischel PS, Weber WA. Noninvasive imaging of αvβ3 function as a predictor of the antimigratory and antiproliferative effects of dasatinib. Cancer Res. 2009;69:3173-3179
47. Meyer A, Auernheimer J, Modlinger A, Kessler H. Targeting RGD recognizing integrins: drug development, biomaterial research, tumor imaging and targeting. Curr Pharm Des. 2006;12:2723-2747
48. Cai W, Chen X. Multimodality molecular imaging of tumor angiogenesis. J Nucl Med. 2008;49(Suppl 2):113-128
49. Dijkgraaf I, Boerman OC. Molecular imaging of angiogenesis with SPECT. Eur J Nucl Med Mol Imaging. 2010;37(Suppl 1):104-113
50. Niu G, Chen X. Has molecular and cellular imaging enhanced drug discovery and drug development? Drugs R D. 2008;9:351-368
51. Tateishi U, Oka T, Inoue T. Radiolabeled RGD Peptides as Integrin αvβ3-targeted PET Tracers. Curr Med Chem. 2012;19:3301-3309
52. Haubner R, Wester HJ. Radiolabeled tracers for imaging of tumor angiogenesis and evaluation of anti-angiogenic therapies. Curr Pharm Des. 2004;10:1439-1455
53. Michalski MH, Chen X. Molecular imaging in cancer treatment. Eur J Nucl Med Mol Imaging. 2011;38:358-377
54. Wang L, Shi J, Kim YS, Zhai S, Jia B, Zhao H, Liu Z, Wang F, Chen X, Liu S. Improving tumor-targeting capability and pharmacokinetics of 99mTc-labeled cyclic RGD dimers with PEG4 linkers. Mol Pharm. 2009;6:231-245
55. Jia B, Liu Z, Zhu Z, Shi J, Jin X, Zhao H, Li F, Liu S, Wang F. Blood clearance kinetics, biodistribution and radiation dosimetry of a kit-formulated integrin αvβ3-selective radiotracer 99mTc-3PRGD2 in non-human primates. Mol Imaging Biol. 2011;13:730-736
56. Zhou Y, Kim YS, Chakraborty S, Shi J, Gao H, Liu S. 99mTc-labeled cyclic RGD peptides for noninvasive monitoring of tumor integrin αvβ3 expression. Mol Imaging. 2011;10:386-397
57. Shao G, Zhou Y, Wang F, Liu S. Monitoring glioma growth and tumor necrosis with the U-SPECT-II/CT scanner by targeting integrin αvβ3. Mol Imaging. 2013;12:39-48
58. Zhou Y, Shao G, Liu S. Monitoring breast tumor lung metastasis by U-SPECT-II/CT with an integrin αvβ3-targeted radiotracer 99mTc-3P-RGD2. Theranostics. 2012;2:577-588
59. Suzuki M, Mose ES, Montel V, Tarin D. Dormant cancer cells retrieved from metastasis-free organs regain tumorigenic and metastatic potency. Am J Pathol. 2006;169:673-681
60. Sellappan S, Grijalva R, Zhou X, Yang W, Eli MB, Mills GB, Yu D. Lineage infidelity of MDA-MB-435 cells: expression of melanocyte proteins in a breast cancer cell line. Cancer Res. 2004;64:3479-3485
61. Ellison G, Klinowska T, Westwood RF, Docter E, French T, Fox JC. Further evidence to support the melanocytic origin of MDA-MB-435. Mol Pathol. 2002;55:294-299
62. Chambers AF. MDA-MB-435 and M14 cell lines: identical but not M14 melanoma? Cancer Res. 2009;69:5292-5293
63. Jain RK. Transport of molecules in the tumor interstitium: a review. Cancer Res. 1987;47:3039-3051
64. Ji S, Zhou Y, Voorbach MJ, Shao G, Zhang Y, Fox GB, Albert DH, Luo Y, Liu S, Mudd S. Monitoring tumor response to linifanib therapy with SPECT/CT using the αvβ3-targeted radiotracer 99mTc-3P-RGD2. J Pharmacol Exp Ther. 2013;346:251-258
65. Shi J, Zhou Y, Chakraborty S, Kim YS, Jia B, Wang F, Liu S. Evaluation of 111In-labeled cyclic RGD peptides: effects of peptide and PEG4 multiplicity on their tumor uptake, excretion kinetics and metabolic stability. Theranostics. 2011;1:322-340
66. Zhou Y, Kim YS, Lu X, Liu S. Evaluation of 99mTc-labeled cyclic RGD dimers: impact of cyclic RGD peptides and 99mTc chelates on biological properties. Bioconjug Chem. 2012;23:586-595
67. Wu Y, Zhang X, Xiong Z, Cheng Z, Fisher DR, Liu S, Gambhir SS, Chen X. MicroPET imaging of glioma integrin αvβ3 expression using 64Cu-labeled tetrameric RGD peptide. J Nucl Med. 2005;46:1707-1718
68. Wu Z, Li ZB, Chen K, Cai W, He L, Chin FT, Li F, Chen X. MicroPET of tumor integrin αvβ3 expression using 18F-labeled PEGylated tetrameric RGD peptide (18F-FPRGD4). J Nucl Med. 2007;48:1536-1544
69. Reynolds AR, Hart IR, Watson AR, Welti JC, Silva RG, Robinson SD, Violante GD, Gourlaouen M, Salih M, Jones MC, Jones DT, Saunders G, Kostourou V, Perron-Sierra F, Norman JC, Tucker GC, Hodivala-Dilke KM. Stimulation of tumor growth and angiogenesis by low concentrations of RGD-mimetic integrin inhibitors. Nat Med. 2009;15:392-400
Author contact
![]() Corresponding author: Dr. Shuang Liu, School of Health Sciences, Purdue University, 550 Stadium Mall Drive, West Lafayette, Indiana 47907. Phone: 765-494-0236; Fax 765-496-1377; Email: liu100purdue.edu.
Corresponding author: Dr. Shuang Liu, School of Health Sciences, Purdue University, 550 Stadium Mall Drive, West Lafayette, Indiana 47907. Phone: 765-494-0236; Fax 765-496-1377; Email: liu100purdue.edu.
Citation styles
APA
Ji, S., Zheng, Y., Shao, G., Zhou, Y., Liu, S. (2013). Integrin αvβ3-Targeted Radiotracer 99mTc-3P-RGD2 Useful for Noninvasive Monitoring of Breast Tumor Response to Antiangiogenic Linifanib Therapy but not Anti-Integrin αvβ3 RGD2 Therapy. Theranostics, 3(11), 816-830. https://doi.org/10.7150/thno.6989.
ACS
Ji, S.; Zheng, Y.; Shao, G.; Zhou, Y.; Liu, S. Integrin αvβ3-Targeted Radiotracer 99mTc-3P-RGD2 Useful for Noninvasive Monitoring of Breast Tumor Response to Antiangiogenic Linifanib Therapy but not Anti-Integrin αvβ3 RGD2 Therapy. Theranostics 2013, 3 (11), 816-830. DOI: 10.7150/thno.6989.
NLM
Ji S, Zheng Y, Shao G, Zhou Y, Liu S. Integrin αvβ3-Targeted Radiotracer 99mTc-3P-RGD2 Useful for Noninvasive Monitoring of Breast Tumor Response to Antiangiogenic Linifanib Therapy but not Anti-Integrin αvβ3 RGD2 Therapy. Theranostics 2013; 3(11):816-830. doi:10.7150/thno.6989. https://www.thno.org/v03p0816.htm
CSE
Ji S, Zheng Y, Shao G, Zhou Y, Liu S. 2013. Integrin αvβ3-Targeted Radiotracer 99mTc-3P-RGD2 Useful for Noninvasive Monitoring of Breast Tumor Response to Antiangiogenic Linifanib Therapy but not Anti-Integrin αvβ3 RGD2 Therapy. Theranostics. 3(11):816-830.
This is an open access article distributed under the terms of the Creative Commons Attribution (CC BY-NC) License. See http://ivyspring.com/terms for full terms and conditions.