Impact Factor
- Issue 12; 2026
- Issue 11; 2026
- Issue 10; 2026
- Issue 9; 2026
- Issue 8; 2026
- Volume 16; 2026
- Advance Articles
- Past Issues
- Cover Images
- Cover Suggestion
- Index & Coverage
- Special Issues
I. Introduction
II. Rationale for Multi-Tracer...
III. Techniques for Rapid...
IV. Multi-Tracer PET...
V. Discussion
VI. Summary
Acknowledgements
References
International Journal of Biological Sciences
International Journal of Medical Sciences
 Global reach, higher impact

Theranostics 2013; 3(10):757-773. doi:10.7150/thno.5201 This issue Cite
Review
Methodology for Quantitative Rapid Multi-Tracer PET Tumor Characterizations
Dan J. Kadrmas1,2 ![]() , John M. Hoffman1,2
, John M. Hoffman1,2
1. Utah Center for Advanced Imaging Research, Department of Radiology;
2. Molecular Imaging Program, Huntsman Cancer Institute, University of Utah.
Received 2012-9-10; Accepted 2013-4-15; Published 2013-10-4
Abstract
Positron emission tomography (PET) can image a wide variety of functional and physiological parameters in vivo using different radiotracers. As more is learned about the molecular basis for disease and treatment, the potential value of molecular imaging for characterizing and monitoring disease status has increased. Characterizing multiple aspects of tumor physiology by imaging multiple PET tracers in a single patient provides additional complementary information, and there is a significant body of literature supporting the potential value of multi-tracer PET imaging in oncology. However, imaging multiple PET tracers in a single patient presents a number of challenges. A number of techniques are under development for rapidly imaging multiple PET tracers in a single scan, where signal-recovery processing algorithms are employed to recover various imaging endpoints for each tracer. Dynamic imaging is generally used with tracer injections staggered in time, and kinetic constraints are utilized to estimate each tracers' contribution to the multi-tracer imaging signal. This article summarizes past and ongoing work in multi-tracer PET tumor imaging, and then organizes and describes the main algorithmic approaches for achieving multi-tracer PET signal-recovery. While significant advances have been made, the complexity of the approach necessitates protocol design, optimization, and testing for each particular tracer combination and application. Rapid multi-tracer PET techniques have great potential for both research and clinical cancer imaging applications, and continued research in this area is warranted.
Keywords: PET tracers, Tumor Characterizations
I. Introduction
Positron emission tomography (PET), often coupled with x-ray computed tomography (CT) or magnetic resonance (MR) on modern scanners, is a physiologic imaging modality that measures the distribution of radiolabeled tracers within the body. Complementing anatomic modalities, which image tissue structures and morphology, PET can characterize and quantify the functional, metabolic, and physiologic status of tissues in vivo. Although PET/CT imaging has emerged as the leading modality for diagnostic cancer imaging and staging, its true potential lies in its ability to quantify tumor status for personalized medicine tasks such as monitoring response to targeted therapies. Hundreds, if not thousands, of radiotracers have been investigated for PET, targeting parameters such as glucose metabolism, blood flow, hypoxia, cellular proliferation, amino acid synthesis, gene expression, and so on. As we learn more about the molecular bases for disease and treatment, PET is becoming an increasingly powerful imaging modality for characterizing and monitoring disease status in vivo.
Current clinical oncologic PET relies upon imaging a single tracer, most commonly 18F-fluorodeoxyglucose (FDG), to characterize a single aspect of tumor physiology or function (e.g. glucose metabolism for FDG). However, characterizing multiple aspects of tumor function and biology would provide a more complete picture of tumor status, with great potential for improving image-guided selection of the most effective targeted therapies and monitoring their effectiveness. Imaging multiple PET tracers, however, presents significant challenges. Using conventional techniques, which are limited to only a single tracer per imaging session, repeat patient visits are required—a costly and time-consuming approach. However, techniques are emerging for imaging multiple PET tracers in a single-scan. The following sections discuss the rationale for quantitative multi-tracer PET tumor characterizations, review evidence supporting the clinical potential for multi-tracer tumor assessments, summarize past developments and ongoing efforts in rapid (single-scan) multi-tracer PET techniques, and describe the main algorithmic approaches for processing single-scan multi-tracer PET data in order to recovered separate, individual-tracer imaging metrics.
II. Rationale for Multi-Tracer PET Tumor Characterizations
II.A. Physiologic Imaging Targets
Positron emitting radiotracers have been developed for imaging a wide variety of molecular and cellular targets, including glucose metabolism, cellular proliferation, blood flow, hypoxia, protein and lipid synthesis, membrane transport of proteins, hormone receptors, tumor receptors, angiogenesis, apoptosis, and gene expression; and the list continues to grow rapidly. Each PET tracer consists of a molecule, substrate, or drug designed to image a specific molecular or physiologic target, labeled with an appropriate positron-emitting radioisotope. The most commonly used PET radioisotopes are listed in Table 1. The different properties of each radioisotope have implications for multi-tracer PET imaging. The radioactive half-life affects of tracer synthesis, delivery and scanning; it affects radiation exposure and image count densities; and moreover it has significant implications for multi-tracer PET signal-recovery performance. Differences in positron decay fractions and energy give rise to different imaging properties for each radioisotope that can have a subtle effect on multi-tracer PET images. Furthermore, different means of production for each radioisotope (and, subsequently, the PET radiopharmaceutical) also affect the logistics of performing PET imaging with multiple tracers.
Common Positron-Emitting Radioisotopes.
| Isotope | Half-live | β+ Decay Fraction | Mean β+Energy | Mean β+Range | Production |
|---|---|---|---|---|---|
| Carbon-11 | 20.385 min | 99% | 386 keV | 1.266 mm | cyclotron |
| Nitrogen-13 | 9.965 min | 100% | 488 keV | 1.730 mm | cyclotron |
| Oxygen-15 | 122.24 sec | 100% | 735 keV | 2.965 mm | cyclotron |
| Fluorine-18 | 109.77 min | 97% | 252 keV | 0.660 mm | cyclotron |
| Copper-62 | 9.67 min | 93% | 1.314 MeV | 6.077 mm | generator |
| Copper-64 | 12.70 hr | 17% | 278 keV | 0.688 mm | reactor or cyclotron |
| Gallium-68 | 68.06 min | 88% | 844 keV | 3.559 mm | generator |
| Rubidium-82 | 1.273 min | 96% | 1.551 MeV | 7.491 mm | generator |
| Iodine-124 | 4.18 days | 23% | 819 keV | ~ 1.7 mm | cyclotron |
Table 2 provides an overview of prominent oncologic imaging targets and the leading PET tracers under investigation for imaging each target. Numerous other PET tracers have been investigated, and this list is not intended to be comprehensive. Table 2 does, however, provide a sampling of imaging targets of interest for quantitative tumor characterization for which there are reasonably well-developed PET tracers, and which have high potential for use in future personalized oncology paradigms.
Oncologic Imaging Targets and PET Tracers.
| Target | Tracers | Comments |
|---|---|---|
| Glucose Metabolism [1] | 11C-glucose 18F-fluorodeoxyglucose (FDG) | * Most tumors exhibit increased expression of glucose transport proteins and increased hexokinase activity. * Glucose transport proteins govern cellular uptake of both FDG and 11C-glucose, which are then phosphorylated within the cell. * 11C-glucose then enters the full citric acid cycle, giving rise to circulating labeled metabolites * FDG-6-phosphase is metabolically trapped in most tissues. * FDG is the most commonly used oncologic PET tracer. * FDG is avidly taken up in many tumor types, making it a fairly general use tracer for tumor detection, through false positives may arise from inflammatory processes. |
| Cellular Proliferation [2-4] | 11C-thymidine 18F-fluorothymidine 18F-FMAU 18F-FBAU | * Thymidine and other molecules incorporated in DNA have received the most interest as imaging agents. * 11C-thymidine imaging is complicated by circulating metabolites * FLT is transported into cells by a carrier-mediated mechanism and simple diffusion, where it is phosphorylated by thymidine kinase and trapped. * Retention of FLT within the cell primarily measures thymidine kinase activity, which is known to increase 5-10 fold during cell division. |
| Other Growth-Related Tracers [5-7] | 11C-methyl-methionine (MET) 11C-acetate (ACE) 11C-choline 18F-fluorocholine | * Trace a variety of targets such as protein synthesis, lipid synthesis, and amino acid transport * Value for detection, grading, delineation of tumor margins, and evaluating the effects of therapy * High potential for imaging brain tumors, where FDG may be less effective due to high background uptake * Valuable for imaging prostate, hepatocellular, meningioma, glioma, nasopharyngeal, lymphoma, colon, ovarian, and renal cell cancers |
| Blood Flow and Perfusion [8, 9] | 15O-water 62Cu-PTSM, 64Cu-PTSM 62Cu-ETS, 64Cu-ETS 13N-ammonia 82Rb-chloride | * 15O-water is freely diffusible and not affected by cellular uptake mechanisms or metabolic trapping * Very short half-life of 15O makes repeat measurements feasible, but limits use to specialty imaging centers with on-site cyclotron * 13N-ammonia and 82Rb-chloride are frequently used for myocardial perfusion, but concerns about their mechanisms for tissue extraction and trapping limit their usefulness for imaging tumor blood flow |
| Hypoxia [10-13] | 18F-fluoromisonidazole (FMISO) 18F-fluoroerythro-nitroimidazole (FETNIM) 62Cu-ATSM, 64Cu-ATSM | * Hypoxia can lead to radioresistance, resistance to many chemotherapeutic drugs, has implications for drug delivery issues, and causes phenotypical changes resulting in more malignant and metastatic tumor behaviors. * Hypoxia tracers generally retains in viable cells by a redox trapping mechanism * Analysis of hypoxia tracer images is often complicated by issues related to flow-dependent tracer delivery and uptake |
| Numerous Others [14-20] | 18F-sodium fluoride 18F-fluoroestradiol (FES) 18F-fluorodopa (FDOPA) 18F- or 124I-labeled Annexin-V 18F-fluorogancyclovir 18F-fluoropenciclovir | * NaF for bone imaging * FES as estrogen hormone receptor agent * FDOPA as substrate for melanin synthesis (e.g. melanoma) and as general indicator of large neutral amino acid transport * Annexin-V as protein marker for apoptosis * Gene expression imaging using PET tracers in conjunction with the herpes simplex virus type-1 thymidine kinase reporter gene |
II.B. Complementary Value of Imaging Multiple Tracers
Interrogation of tumor status using multiple PET tracers has great potential for personalized oncology, where characterization of multiple aspects of tumor physiology and function would provide a wealth of information for improved prognostication, guiding selection of targeted therapies, and assessing tumor response. Many of these applications are quantitative or semi-quantitative in nature, e.g. quantifying changes in tracer uptake that reflect physiologic changes that occur in response to therapy. As such, they represent a different perspective on PET imaging as compared to current clinical practice where FDG-PET is used primarily for diagnostic and staging purposes. A significant and growing body of literature has established high potential value for imaging multiple PET tracers for both clinical and basic science investigations [2, 21-27]. The following anecdotal review summarizes much of the relevant literature, but is not an exhaustive review and many additional papers have alluded to the potential value of imaging multiple PET tracers.
Example of four inter-related imaging targets of importance for personalized oncologic imaging. A variety of PET tracers have been developed for imaging and quantifying each imaging target.
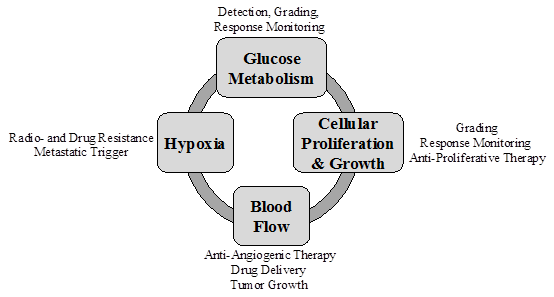
Glucose Metabolism and Cellular Proliferation Tumor metabolism and proliferative activity provide complementary and relevant information for oncologic treatment decisions and has received much recent interest [28-39]. For example, Halter et al. [40] studied the role FDG and FLT PET for staging bronchial carcinomas in 28 patients. For primary lung tumor detection, FDG was found to be more sensitive than FLT (95% vs. 86%), while FLT showed higher specificity (100% vs. 71%). For detecting lymph node metastases, FDG was much more sensitive than FLT (86% vs. 57%). The overall conclusion was that FDG PET played the most important role in detection, while FLT could potentially play a secondary role by identifying cases where false-positive FDG results occur due to an associated inflammatory processes. Along similar lines, Kubota et al. [41] found that the ratio of 11C-methyl-methionine (MET) uptake to 2-deoxy-glucose (2DG, FDG) uptake may correspond to the fraction of proliferative tissue, warranting further studies to correlate tumor uptake of FMISO and FDG or MET with radiotherapeutic effects. Work by d'Argy et al. [42] with FDG, thymidine, methionine, and toremifene (an estrogen receptor-avid agent), also demonstrated complementary value of these tracers.
Hypoxia and Metabolism Hypoxia and metabolism are also inter-related parameters that affect tumor behavior. Rajendran, et al. [43] investigated the relationship between regional glucose metabolism (FDG) and hypoxia (FMISO) in a variety of human tumors using PET. Wide variations in tumor glucose metabolism and hypoxia were observed, including all four of the possible combinations: (1) low glucose metabolism, low hypoxia; (2) low glucose metabolism, high hypoxia; (3) high glucose metabolism, low hypoxia; and (4) high glucose metabolism, high hypoxia. These variations were observed in different cancer types and tumor sizes, and were considered to reflect ubiquitous genetic responses to hypoxic stress. The complementary information provided by FDG and FMISO was considered to be important in the clinical characterization of tumor biology and selection of effective treatments. The accompanying editorial [44] explains that the capability of PET to explore multiple facets of the phenotype of human cancers is opening new doors for the in vivo study of the biochemistry of human tumors. Similarly, Kubota et al. [41] compared imaging measurements of hypoxia (18F-MISO), glucose metabolism (14C-2-deoxyglucose) and proliferation (11C-MET) in a rat tumor model, finding the ratio of FMISO uptake to 2DG (and/or FDG) may reflect the hypoxic fraction and predict tumor radiosensitivity.
Tumor Blood Flow and Hypoxia The relationship between tumor blood flow and hypoxia is complex and variable. Moore et al. [45] and Groshar et al. [46] studied the correlation between SPECT perfusion tracers of blood flow (HMPAO, 99mTc-hexamethylpropylenamine oxime) and hypoxia (IAZA, 123I-iodoazaomycine arabinoside) in a variety of tumors. A wide range of uptake patterns were observed. The presence of hypoxia in most tumor types was associated with low flow, suggesting a complex relationship between impaired tissue perfusion and the presence of viable hypoxic cells. In 1999, Lewis et al. [47] compared the uptake of PTSM and ATSM in vitro and using autoradiography in a tumor-bearing murine model. In vitro, PTSM showed uptake completely independent of oxygen concentration, while ATSM uptake was inversely related to the pO2 of the culture media. The autoradiography results showed uniform uptake of PTSM throughout the tumors, with heterogeneous uptake of ATSM and hypoxic fractions of 15-45%.
Lehtiö et al. [48] performed PET imaging with 15O-water, FDG, and 18F-FETNIM in patients with untreated head and neck carcinomas. In this study, tumors with high regional uptake of 18F-FETNIM also tended to have high average blood flow. Several explanations were offered to account for this phenomenon: (1) the delivery of 18F-FETNIM in tissue is governed by blood flow, (2) the presence of hypoxia enhances angiogenesis leading to high average blood flow on the macroscopic level, and (3) regions with high apparent flow may remain severely hypoxic due to a low oxygen extraction ratio. The relationship between blood flow and hypoxia was investigated further in [49] using compartment model based simulations. Tissue blood flow was observed to have a notable effect on hypoxia tracer uptake. High blood flow was considered to enhance not only the uptake of 18F-FETNIM into hypoxic cells, but also the washout of the tracer from surrounding normoxic cells. These studies illustrate the complex relationship between tumor blood flow and hypoxia, and support the need for additional research to understand how they are interrelated. Pre-therapy imaging of blood flow and hypoxia in patients treated with radiotherapy and surgery was found to provide valuable prognostic information.
Monitoring Response to Therapy PET can detect physiologic changes in tumors that occur immediately in response to therapy, providing early (subclinical) assessment of the effectiveness of therapy (reviewed in [50-55]). Much of this work has focused on FDG-PET, but mounting evidence suggests imaging multiple PET tracers may provide greater insights and improve response monitoring. Kubota et al. [56] found that different aspects of tumor physiology responded differently to different levels of irradiation, and also that the temporal patterns of response differ for different tracers. FDG and 67Ga-citrate showed the largest overall changes in tissue uptake, suggesting that they may be more valuable for monitoring response to therapy, whereas thymidine and methionine were more sensitive to the difference between fully-effective versus partially-effective treatment, suggesting that they may be more sensitive for early detection of response and predicting recurrence. Along similar lines, Eary et al. [50], Lammertsma [52], and Sasaki [57] all highlight the importance of imaging cellular proliferation, perfusion and hypoxia in addition to glucose metabolism for treatment response monitoring.
Brain Tumors represent an example tumor type with significant evidence substantiating the merits of multi-tracer characterizations. A large number of patient studies have been performed in recent years to investigate a variety of different PET tracers for imaging gliomas. In many of these studies, blood flow, blood volume, oxygen extraction, and oxygen metabolism were measured together using sequential administration of several 15O-labeled tracers [58]. In addition, glucose metabolism (FDG), protein synthesis (MET), proliferation (11C-thymidine, FLT), and hypoxia (FMISO) have also been frequently studied in various combinations ([7, 27, 59, 60] and others). Narayanan et al. [7] found that combined FDG + MET was useful for grading astrocytomas, whereas MET was better than FDG for delineating low-grade tumor boundaries. The same effect was observed by Heiss et al. [61] and Vu and Fischman [62], with amino acid tracers (11C-MET, 18F-tyrosine) offering better detection and FDG better grading. Overall, these studies suggest that PET imaging with multiple tracers can provide complementary information for detection, differential diagnosis, grading, prognosis, planning radiotherapy and chemotherapy treatments, measuring response to therapy, and detecting recurrence.
Breast Cancer represents another disease where the complementary value of imaging multiple tracers has been established in the literature. Several studies have used combined PET imaging of blood flow (15O-water) and glucose metabolism (FDG) to predict and measure response to neoadjuvant chemotherapy in breast cancer patients [24, 25, 63]. The rationale for this approach was that some tracers and systemic chemotherapy agents may not be delivered adequately to tumors with low blood flow, and further under-perfused tumors may become hypoxic and undergo a transformation to more aggressive and therapy resistant phenotypes [64]. The ratio of low glucose metabolism (FDG) to high blood flow (15O-water) was found to be the best predictor of a positive response to treatment and longer disease-free survival [24], and this ratio was a more robust indicator of tumor status than either tracer alone. During the course of therapy, responders showed only a slightly greater reduction in glucose metabolism as compared to non-responders, but changes in blood flow showed a much greater difference [25]. The ratio of glucose metabolism to blood flow decreased for all tumors after therapy, falling to values approaching that of normal breast in more responsive tumors [65]. Overall, combined measurement of both blood flow and glucose metabolism provided more insight into breast tumor biology than either alone.
Other Examples The potential value of imaging multiple PET tracers has also been demonstrated in numerous other tumor types and cancer imaging applications, for which we provide brief anecdotal summaries:
- Detection and Localization of Bone Metastases Hoegerle et al. [66] investigated dual-tracer summed Na18F-fluoride and FDG imaging for detection and staging of a wide variety of cancers with potential bone metastases. Summed images of these two tracers were found to provide better sensitivity and localization than FDG alone, although false negative findings could result when a combination of low Na18F-fluoride and high FDG uptake gave similar activity levels as surrounding bone. Rapid imaging with separation of the two tracers via multi-tracer PET processing techniques could overcome this limitation.
- Melanoma Detection Dimitrakopoulou-Strauss et al. [14] studied imaging with FDOPA, FDG, and 15O-water in melanoma patients, finding that detectability of metastases was enhanced when both FDOPA and FDG were used. The sensitivity of PET for detecting viable tumors was higher when using FDG and FDOPA in combination (95%) as compared to either tracer alone (86% for FDG; 64% for FDOPA). Another interesting finding of this work was that the pharmacokinetic data from all three tracers was not strongly correlated, indicating that each of these tracers provided different information about tumor biology. The accompanying editorial [15] further highlighted the potential of multi-tracer PET.
- Detection and Grading of Non-Hodgkin's Lymphoma Upon imaging with both FDG and MET, Leskinen-Kallio et al. [67] found that MET was more effective for detection of lymphomas of all grades, while FDG was inconsistent for detecting intermediate and low grade disease. However, FDG was better for grading high-grade lymphomas while MET was ineffective for this task. Using both tracers provided complementary value for early detection (MET) and grading (FDG) in this study
- In prostate cancer, Oyama et al. [68, 69] found 11C-acetate (ACE) more sensitive for primary disease and local metastases, and FDG preferable for distant metastases and tumor grade.
- In hepatocellular tumors, Ho et al. [70] found a strong complementary relationship between ACE and FDG for detection of liver tumors. The overall sensitivity for detecting HCC with ACE was 87.3% as compared to 47.3% using FDG. Vascular hepatic metastases and extra-hepatic metastases showed greater FDG avidity, however, while one brain metastasis was detected using ACE but not with FDG. Another interesting observation was that 11C-acetate was fairly specific for HCC tumors and was negative for detection of non-HCC liver tumors, such as hemangioma, cholangiocarcinoma, and metastases from colon, breast, and lung tumors. Thus, using FDG and ACE together may provide complementary information for evaluating liver tumors of unknown origin.
Overall, this body of literature provides strong evidence that characterizing tumors more fully by imaging multiple PET tracers provides a more complete picture of disease status than single-tracer imaging and has important implications for clinical practice. Why, then, hasn't multi-tracer PET imaging been adopted more broadly for clinical research studies and moved toward clinical application? The answer lies in the excessive cost and logistical challenges that arise in performing multiple PET exams hours-to-days apart in the same patient. This has motivated the study of new techniques for imaging more than one PET tracer in a single scanning session, which we broadly categorize as rapid multi-tracer PET imaging. The following sections review and describe research developments in this area, including historical development of the approach, followed by a description of the main image processing techniques for separating multi-tracer PET imaging signals into their individual-tracer components.
III. Techniques for Rapid Multi-Tracer PET Tumor Imaging
The expense and logistical challenges of performing multiple PET exams—separated by several hours or on separate days—in a given patient precludes routine clinical use. Rapid multi-tracer PET provides an alternative route, where measurements of two to three PET tracers are rapidly acquired in a single imaging session. The patient is positioned once and only a single CT (or transmission) scan is needed for PET attenuation correction. Multiple PET tracers are then imaged concurrently, and “signal-recovery” algorithms are employed in order to recover individual-tracer components of the acquired multi-tracer PET signal. The primary technical challenge is that all PET tracers emit positrons which, after annihilating with a nearby electron, give rise to 511 keV photon pairs that are detected in coincidence by the PET tomograph. In contrast to single-photon emission computed tomography (SPECT), where energy discrimination can be used to distinguish gamma photons of different energies from different tracers, there is no explicit information available in the PET coincidence measurement to determine which tracer gave rise to each individual coincidence event. As such, the PET scanner measures a conglomerate sum of PET signals over all tracers. Effective multi-tracer PET imaging requires processing of this summed measurement to recover measures for each individual tracer. This signal-recovery process depends on the presence of implicit information (and/or additional measurements) regarding the makeup of the multi-tracer PET signal.
Different Radioactive Half-Lives In 1982, Huang et al. [71] recognized that static distributions of multiple PET tracers with different half-lives could be recovered from dynamic PET images based on their different rates of radioactive decay. Simple phantoms were studied using 13N (T1/2=9.97min), 18F (T1/2=110min), 64Cu (T1/2=12.7hr) and 68Ga (T1/2=68min). Under this approach, each voxel or region-of-interest (ROI) in the dynamic PET image is treated as a sum of exponentials with known decay constants, and the coefficients of the sum represent the contribution from each tracer. This initial work had limited practical value as it was only useable on suitably static tracer distributions—obtainable e.g. for irreversibly trapped tracers long after injection, which would also require very high administered doses for shorter-lived tracers. However, this initial work did establish the basic principal for rapid multi-tracer PET of using dynamic imaging techniques and recovering estimates of each individual tracer based on differences in their kinetic behaviors (differences in radioactive decay in this case). The technique was revisited by Verhaeghe et al. in 2005 [72], where Cramer-Rao bounds were used to describe the fundamental limit on variance increases when separating static dual-tracer distributions based on differences in radioactive half-lives, and also by Figueiras et al. in 2011 [73] for imaging of 18F-FDG and 13N-ammonia in rat brains.
In 1990 Kearfott [74] modified the technique of Huang et al. to measure regional cerebral hematocrit (rHct) using dual-tracer PET imaging with 68Ga-labeled plasma albumin and either 15O- or 11C-labeled red blood cells. Simultaneous administration of both radiolabeled compounds was studied, using two sequential scans of 5 and 15 minute duration, respectively. The effects of plasma equilibration were ignored, although it was noted that the time for such equilibration could be quite long. Reasonable estimates of rHct were obtained when using 68Ga-labeled plasma albumin with 15O-labeled red blood cells, and approach was somewhat less successful when using 11C-labeled red blood cells due to the longer half-live of 11C as compared to 15O. They concluded that the advantages of simultaneous administration of the two compounds were limited as compared to separate administrations, but they did suggest that simultaneous multi-tracer methodology could potentially be extended to other tracer combinations.
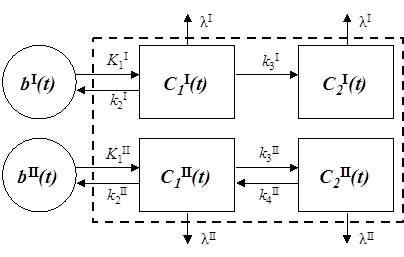
Multi-Tracer Compartment Modeling Several years later, Koeppe et al. [75-77] introduced a technique for imaging multiple neurotransmitter-neuroreceptor systems using a single dynamic PET scan with two 11C-labeled tracers. Three tracers were studied: 11C-flumazenil (FMZ), N-11C-methylpiperidinyl propionate (PMP), and 11C-dihydrotetrabenzaine (DTBZ). The tracers were studied in two combinations: FMZ+DTBZ, representing a pair of rapidly reversible tracers; and PMP+FMZ, representing one irreversible and one reversible tracer. Both simulation studies and physical experiments in healthy volunteers were performed, using dynamic scans of 70-80 minute duration. The first tracer was injected at the start of the scan, and the second tracer was injected 10-30 minutes later as dynamic scanning continued. In order to process the resulting dual-tracer dynamic datasets, the authors introduced a parallel dual-tracer compartment modeling technique. Rather than treating each tracer separately, the proposed technique modeled the summed dynamic signal over all tracers and computes best-fit estimates of each tracers' kinetic rate parameters. Such multi-tracer compartment modeling techniques have become the basis for most subsequent multi-tracer PET signal-recovery algorithms, and will be described in more detail in section IV below.
Koeppe et al. concluded that temporally overlapping dual-tracer PET using a single dynamic scan with staggered injections was feasible, and that the model parameters for each tracer could be recovered nearly as accurately as in conventional single-tracer studies when using injection delays of 10-20 minutes for the second tracer. It was also noted that, while the technique could be generalized to other tracer pairs, general conclusions applicable to any tracer pair could not be drawn and each tracer pair should be evaluated independently. The authors go on to suggest that the first tracer injected should have sufficiently rapid kinetics so that its model parameters could be well-determined prior to injection of the second tracer; however, subsequent work as reviewed below has shown that multi-tracer signal-recovery performance is not necessarily limited to this requirement.
Generic parallel dual-tracer compartment model. Each tracer is modeled in this example with two tissue compartments, where tracer I is trapped in compartment 2 (i.e., k4I=0) and tracer II is reversible. The dashed box indicates that the PET measurement does not sample the compartments individually, but rather measures the sum over all compartments for all tracers (as well as other components such as contributions from whole blood). Radioactive decay (λ) is also included in the model, since differences in radioactive decay can assist multi-tracer signal-recovery.
In the following years, several other groups implemented dual-tracer PET techniques with parallel dual-tracer compartment modeling. Nishizawa et al. [78] used a double-injection FDG method to successfully measure cerebral glucose metabolism twice in a single procedure. Ikoma et al. [79] then presented work which paralleled Koeppe's work using 18F-FDG and 11C-flumazenil, and their results were consistent with those of Koeppe. Converse et al. [80, 81] adapted the technique to PET measurement of regional cerebral blood flow using 17F-fluoromethane (inhaled, T1/2 = 64.5 sec) in the presence of a neurochemical tracer, 18F-fallypride. The objective of this work was to demonstrate proof-of-principle for measuring rapidly changing blood flow patterns while also measuring the neuroreceptor status over a longer timescale. Their results demonstrated the feasibility of obtaining reproducible blood flow measurements in the presence of a longer-lived tracer. These papers have established dual-tracer PET with parallel compartment modeling as a feasible technique for estimating both tracers' kinetic rate parameters from a single scan.
Generalized Multi-Tracer Methods In 2005 Kadrmas and Rust [82] published a general feasibility study of rapid multi-tracer PET tumor imaging using a dynamic scan with tracer injections staggered in time. Using information theory based on principal component analysis (PCA), the information content available for multi-tracer signal-separation was analyzed for several generic combinations of tracers with different radioactive half-lives: 18F (T1/2=110min), 11C (T1/2=20.4min), and 62Cu (T1/2=9.7min). The results demonstrated that, in general, the degree of information overlap decreases (and the corresponding tracer separability index increases) as the delay between tracer injections increases. However, the magnitude of these metrics was sensitive to the tracer combination, both in terms of radioactive half-lives and tracer kinetics. This is consistent with prior observations that rapid multi-tracer PET techniques need to be separately evaluated and optimized for each particular tracer combination. In addition to studying parallel multi-tracer compartment modeling, the paper also introduced a PCA-based algorithm for explicit signal-separation—i.e., an algorithm that explicitly separated that input multi-tracer PET signal into individual-tracer components (while previously-used multi-tracer compartment modeling algorithms estimated individual-tracer rate parameters, they did not explicitly recover individual-tracer time-activity curves). This technique and related variants can be used to recover image estimates and standardized uptake values (SUVs) for each tracer.
A number of groups have gone on to study a variety of rapid multi-tracer PET techniques and applications with 2-3 tracers using dynamic imaging with staggered injections:
- Kudomi et al. [83] developed a technique for single-scan dual-tracer administration of 15O-labeled oxygen and water for rapid quantitation of cerebral blood flow and rate of oxygen metabolism. The technique effectively uses dual-tracer compartment modeling with a 3 min. infusion of the first tracer followed by 3 min. infusion of the second tracer. They later developed techniques for separating the arterial input functions for each tracer [84], and the general approach was further evaluated by Iwanishi et al. in 2009 [85].
- Dual-tracer imaging of tumor blood flow and hypoxia was studied in 2006 by Rust et al. [86] using 62Cu-PTSM and 62Cu-ATSM. Simulations results demonstrated good performance using a single 30 minute dynamic scan and injection delay of 10 minutes. These results were later confirmed experimentally by Black et al. [87] in canines with spontaneously-occurring tumors.
- Dual-tracer imaging of brain metabolism and dopamine transporter density was studied by El Fakhri et al. in 2006 [88] using simulated time-activity curves for 18F-FDG and 18F-FECNT. A generalized factor analysis of dynamic sequences (GFADS) signal-separation algorithm was employed, and good agreement between dual- and single-tracer results.
- In 2009, Joshi et al. [89] studied three approaches to signal-recovery in dual-tracer brain PET imaging, including an extrapolation method, simultaneous fitting method, and a template method. Simulation studies with 11C-DTBZ and 11C-FMZ found that the template method outperformed the other methods for this application.
- Dual- and triple-tracer tumor imaging techniques with 18F-FDG and secondary shorter-lived tracers were demonstrated by Black et al. in 2009 [90]. Good performance was obtained with FDG administered first and the shorter-lived tracers administered after 10-20 minute delays. Notably, recovery of the FDG imaging measures (SUV, net-uptake) were largely unaffected by the presence of the secondary tracers.
- Gao et al. [91] studied the dual-tracer PET reconstruction problem in 2009, proposing to formulate the reconstruction in a state-space representation using parallel compartment modeling to describe the tracer kinetic processes. This work coupled the multi-tracer signal-recovery step with the reconstruction step, rather than treating each step separately.
- Generalized systems and methods for rapid multi-tracer PET imaging in both oncology and cardiology were described by Kadrmas et al. in 2010 [92], including a variety of techniques for implementing signal-recovery algorithms in both projection space and image space.
- Characterization of tumor glucose metabolism and proliferation by dual-tracer 18F-FDG + 18F-FLT PET was studied by Kadrmas et al. in 2012 [93]. Using newly-developed reduced parameter space kinetic modeling techniques, accurate recovery of SUV, net-uptake, and certain individual rate parameters for each tracer was demonstrated using a single dynamic scan with FLT administered first and FDG after a 30 min. delay.
Dual-Tracer Imaging with Prompt Gammas One of the most recent development in multi-tracer PET techniques is the use of dual-tracer imaging where one tracer's radioisotope is a pure positron emitter and the other emits a high energy gamma in a cascade simultaneously with positron emission. First proposed by Andreyev and Celler in 2011 [94], the technique relies upon detecting the auxiliary prompt gamma in coincidence with an annihilation event in order to measure triple-coincidence events originating from only one of the tracers. This information is then utilized, either separately or in conjunction with multi-tracer kinetic constraints, to assist with the dual-tracer signal-recovery. Initial simulation studies using 18F coupled with either 22Na or 60Cu found that this technique may outperform dual-tracer approaches that rely solely upon differences in kinetics and radioactive decay for signal-separation. However, the technique is limited to tracer pairs where one of the labeling radioisotopes emits a prompt high energy gamma.
Multi-Tracer PET with Three or More Tracers The majority of the work on rapid multi-tracer PET has focused on dual-tracer imaging; however, the techniques employed are generally applicable to rapid imaging with more than two tracers as well. The feasibility of triple-tracer tumor imaging with 18F-FDG, 62Cu-PTSM, and 62Cu-ATSM was demonstrated in 2009 by Black et al. [90]. Similarly, Verhaeghe and Reader [95] studied simultaneous water activation and glucose metabolic rate imaging using 18F-FDG and 12 serial bolus injections of 15O-water. While this work used two tracers, the repeat serial injections of 15O-water is similar in many ways to administration of multiple tracers. While imaging three or more tracers may be feasible in certain situations, e.g. imaging several short-lived tracers along with a single long-lived tracer, the required scan time may become quite long due to the required delay between tracer administrations.
IV. Multi-Tracer PET Signal-Recovery Methodology
Several approaches to multi-tracer PET signal-recovery have been proposed as reviewed above. In this section, we collectively organize the main algorithmic approaches and propose general nomenclature describing these multi-tracer PET signal-recovery techniques. The underlying premise for multi-tracer PET signal-recovery is that the kinetic behavior of each tracer obeys certain constraints—and when staggered injections are used, these constraints provide sufficient information to recover the signal components due to each tracer from the overlapping portions of the time-activity curves. Here, the term “signal” is broadly used to describe the essence of the PET measurement under discussion. To varying degrees multi-tracer PET signal-recovery can be performed on the raw scanner data, partially processed data, reconstructed dynamic images, and/or time-activity curves. Similarly, for each tracer the imaging endpoint(s) may be a static image, SUV, pseudo-quantitative measure, kinetic parameter(s) and/or macro parameter(s). For a given dataset and imaging endpoint, “signal” is used to identify the element or elements of the dataset necessary for computing the desired endpoint. Likewise, “signal-recovery” (and “signal-separation”) refers to the process of separating a multi-tracer dataset into individual tracer components, thereby recovering the necessary signal for each tracer for computing the desired endpoint. This terminology will be elucidated through the discussion of signal-recovery algorithms and examples below.
We now present several multi-tracer signal-recovery algorithms applicable to a variety of multi-tracer PET imaging scenarios. Part of the presentation is in the context of dual-tracer imaging to improve clarity, though each method can generally be extended to additional tracers. Also the PET “signal” will often be described as a time-activity curve since the concepts are generally more easily present in that context. However, bear in mind that the multi-tracer kinetic models and signal-recovery algorithms could be applied in either projection or image space, albeit with differing complexities and details of implementation.
Let  represent the PET signal at time t, including contributions from all tracers present. Since the signals from each individual tracer are not explicitly distinguishable, we have:
(1)
where  is the signal from tracer n, and N is the number of tracers. The multi-tracer signal typically should not be corrected for radioactive decay, as differences in radioactive decay can assist the signal-recovery (and, moreover, decay correction cannot properly be applied until the signal-recovery is accomplished). In general, the process of signal-recovery is to recover estimates
  for every n from
  . In the following discussion, we use a tilde (~) to indicate that a variable is a (noisy) measured quantity, a bar (-) to indicate it is modeled, and a caret (^) to indicate that it is estimated or recovered.
IV.A. Background Subtraction
Perhaps the simplest approach to dual-tracer signal-recovery is to treat the residual activity from the first tracer as a background behind the signal for the second tracer. If this background can be estimated from the single-tracer portion of the scan (i.e., from the data acquired prior to the time of injection of the second tracer), then it can be subtracted (or otherwise removed) from the overlapping portion of the data. Consider dual-tracer imaging with tracer 1 injected at time  and tracer 2 injected at time
  (typically one would have
  and
and  ). The dual-tracer signal is then:
(2)
Thus,  is directly measured for
  . Suppose the activity from tracer 1 can be extrapolated to times after injection of the second tracer,
  . Here we use a bar to indicate that
  is a modeled quantity, e.g. modeled from a fit to the data for
  . The Background Subtraction method treats
  as a background on the measurement of
  , subtracting it to recover the signal for the second tracer.
Background Subtraction:
and
(3)
Inspection of eq. (3) reveals some interesting properties with respect to noise propagation. The recovered signal for tracer 1,  , contains all of the noise from the measurement for
  , but for
  it receives no noise from the measurement other than noise contributions from
  into
into  . Since
  is a modeled quantity, it “appears” noisefree and
  changes smoothly in time for
  . On the other hand,
  contains all of the noise from the measurement at
  , and furthermore this noise is exacerbated as a result of subtracting off the background signal.
Background Subtraction is useful and appropriate when two conditions are met. First, the signal from tracer 1 must be sufficiently well-defined by the measurement from  that accurate extrapolation to times
  can be performed. Second, the magnitude of the signal for tracer 2 must be sufficiently large relative to that of tracer 1 for
  such that the noise in
  is acceptable. When either of these conditions are not met, more advanced signal separation algorithms may be necessary; however, even when these conditions are met, somewhat better performance may still be obtained by the more advanced methods.
Signal Extrapolation Ignoring patient movement, misregistration, and other such effects, the extrapolated signal  can be accurately estimated when the first tracer is static or at equilibrium for times
  , or when the changing distribution of tracer 1 can be accurately predicted from the measurements at
  . In the former case, the extrapolated signal only needs to account for radioactive decay and the extrapolation is trivial. In the latter case, some form of kinetic model or constraint needs to be applied to predict
  . This kinetic model can take the form of a compartment model or more generalized kinetic model, or other kinetic analysis procedure such as principal component analysis (PCA), frequency analysis of dynamic structures (FADS), spectral analysis, and others. We present two example methods here for extrapolating the signal from tracer 1 forward in time so that it can be subtracted from the signal after tracer 2 is administered: compartment model-based signal extrapolation, and generic component-analysis based signal extrapolation.
Example A1: Signal Extrapolation by Compartment Modeling
Using compartment modeling, the activity concentration due to a single tracer in a PET voxel or region-of-interest (ROI) can be written:
(4)
where fb is the vascular fractional volume, B(t) is the activity concentration in the whole blood (which may differ from the freely available plasma input function b(t)), and A(t) is the activity concentration in the extravascular tissue. Here, A(t) depends on the input function b(t), which is the activity concentration in the blood which is freely available to exchange with the tissue, the kinetic rate parameters of the compartment model {ki}, and the radioactive decay constant λ. Note that, for multi-tracer PET, radioactive decay should be incorporated into the compartment model, such that A(t), B(t), and R(t) all contain the effects of such decay (i.e., are not decay-corrected). This is so that radioactive decay can aid in the signal-recovery process.
When using Background Subtraction with compartment model-based signal extrapolation, the compartment model for tracer 1 is first fit to the measured data for  to estimate fB and the rate parameters for tracer 1, {ki}1. This requires knowledge of the whole-blood activity concentration and input functions for tracer 1, B1(t) and b1(t) respectively (e.g. from arterial blood sampling). Assuming B1(t) and b1(t) are known for
  , the compartment model and fitted parameters are then used to predict
  and, via eq. (4),
  . The signal separation can then be performed by application of eq. (3). Any errors in the fitted parameters or blood and input function measurements will translate to errors in
  , and hence degrade the results of the signal separation procedure.
Example A2: Signal Extrapolation by Component Analysis
Component analysis methods such as PCA or FADS can be used to represent the dynamic PET signal for a tracer as a linear sum of M independent (or pseudo-independent) components Vm(t) :
(5)
where the scalar coefficients {αm} denote the relative weights of each component. The components are usually obtained from empirical population studies, and in general a relatively small number of components can be used to accurately represent the signal. In situations where the coefficients {αm} for tracer 1 can be accurately estimated from the measured data at times  (e.g. by fitting eq. (5)), the component representation can be used to extrapolate the signal for
  . Note that this requires that each important component have sufficient signal power at
  that it can be accurately estimated.
These signal extrapolation methods for Background Subtraction rely upon being able to accurately predict future signal from the measurement at  . In situations where “late” characteristics of the signal for tracer 1 are important (for example, characterizing the washout phase), Background Subtraction will not work well unless
  is sufficiently late that the characteristics of tracer 1 are well-defined before administration of the second tracer. This limitation is somewhat diminished for the more advanced model-based signal-recovery algorithms described below which use all of the measured timeframes to recover each of the tracer signals.
IV.B. Model-Based Signal-Recovery
Rather than treating the residual activity from prior injections as a background “contaminant” on the overlapping portion(s) of the scan, model-based signal-recovery methods treat the entire dataset as a combined measurement and use the full dataset to recover the individual tracer signal components. Recall that the multi-tracer PET signal represents a sum of the individual tracer signal components: (repeated for convenience)
(6)
Model-based signal-recovery methods assign a kinetic constraint to each tracer's dynamic signal Rn(t). The kinetic constraint can be a compartment model, more general kinetic model, component representation, or other temporal constraint. Furthermore, it is not necessary to use the same type of constraint for each tracer. Associated with each constraint are a set of unknown parameters which describe the magnitude and kinetics of Rn(t). In some cases one or more parameters may be shared among tracers (e.g. the vascular fraction parameter fb commonly included with compartment modeling). Model-based signal-recovery works by simultaneously estimating these parameters for each tracer, giving a modeled signal  for each tracer, and then using the modeled signals as constraints to recover the separated individual tracer signals. The manner in which the constraints are implemented to perform the signal-recovery can yield very different results. We describe two such methods below: Model-Restricted Signal-Recovery and Model-Guided Signal-Separation.
Model-Restricted Signal-Recovery
When the kinetic model for a given tracer is considered to be very accurate, then the recovered signal for that tracer can be exactly constrained by the model. In other words, the recovered signal is restricted to fall within the possible solution space of the model, giving:
(7)
In this case, the estimated parameters for the model and the recovered signal are mutually consistent. The parameter estimates are affected by statistical noise in the measurement, but the recovered signal  “appears” noisefree (i.e. is regularized by the model). This method may give rise to substantial errors when the models are not accurate, and/or when other endpoints such as static images or SUVs are desired.
Model-Guided Signal-Separation
Model-Guided Signal-Separation uses the modeled kinetic constraints in a less restrictive fashion, such that they minimally act to separate the (noisy) multi-tracer measurement into single-tracer components. The goal is to estimate single-tracer components representative of what would have been obtained by separate, single-tracer imaging without (or at least minimally) placing additional restrictions on the recovered signals. The recovered signals for each tracer can then be analyzed in any manner desired as with conventional single-tracer imaging.
The modeled signal for each tracer,  , is considered to be a fair (approximate) representation of the kinetic behavior of each tracer; however, it is recognized that the kinetic models may contain some deficiencies. While some kinetic constraints from these models are necessary to perform the multi-tracer signal-separation, it is not necessary to constrain the recovered signals to exactly match the kinetic models. One way to do this is to use the modeled signal for each tracer to predict the proportion of the total signal due to each tracer, and then distribute the (noisy) measured signal among the individual tracers accordingly:
(8)
This process conserves the total magnitude of the measured signal at each timepoint, it distributes the noise in  among the tracers, and any errors/inaccuracies in
  have less direct impact upon the results than the prior method. In addition, eq. (8) ensures that the recovered signal exactly equals the measured signal in non-overlapping portions of the data (i.e., when the modeled signals
  are zero for all tracers but one). Several variations of eq. (8) may be considered that implement the kinetic constraints in somewhat different ways. For example, when non-uniform temporal sampling is used, the constraints can be implemented such that the recovered signal for a slowly-varying tracer will not fluctuate rapidly during the shorter timeframes, whereas that for a faster-varying tracer can be allowed to do so.
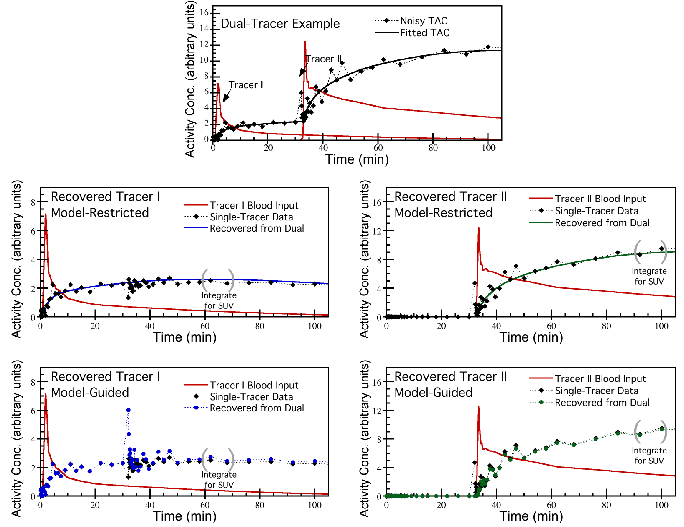
Example dual-tracer time-activity curve (top row), with signal-recovery performed using Model-Restricted Signal-Recovery (middle row) or Model-Guided Signal-Separation (bottom row). The curves recovered using Model-Restricted separation are fully constrained to match the kinetic models used for signal-recovery, whereas the Model-Guided curves are not so constrained and also attempt to separate the noise in the signal among the constituent tracer components.
Example B1: Model-Based Signal-Recovery by Compartment Modeling
Consider the case of imaging N tracers by multi-tracer PET. Using a parallel multi-tracer compartment model, the total activity concentration in a PET voxel or ROI can be written:
(9)
where  and
and  are the activity concentrations in whole-blood and extra-vascular tissue, respectively, for tracer n. Here we have explicitly written the dependency of
  upon that tracer's input function
  , rate parameters,
  , and radioactive decay constant
  . It is assumed in this example that the vascular fraction,
  , is constant throughout the scan and is the same for both tracers (i.e. the physical volume of whole-blood present is independent of tracer, and to good approximation the degree of partial-volume effects due to whole-blood is the same for all tracers). It is also assumed that
  and
and  , are known for each tracer (e.g. from blood sampling). The parameters
  and
and  for every n are the unknowns which can be estimated by fitting the multi-tracer compartment model to the measured data,
  . Let
. Let  and
and  be the best-fit parameters. The modeled signal for tracer n is then:
(10)
Model-Restrictive or Model-Guided signal-separation can then be performed by application of eq. (7) or (8), respectively. The recovered signal for each tracer,  , can then be processed according to conventional single-tracer analysis methods as described in section III.
Example B2: Model-Based Signal-Recovery by Component Analysis
Considering the same problem using component-based kinetic constraints, we have:
(11)
where  and
and  are the mth coefficients and components for tracer n, respectively, and
  is the number of components for tracer n. The components
  are assumed known from prior component analysis, and unknowns are
  . Fitting eq. (11) to the measured data,
  , to obtain best-fit parameters
  , the signal for each tracer is modeled as:
(12)
Again, Model-Restrictive Signal-Recovery or Model-Guided Signal-Separation is performed through application of eq. (7) or (8), respectively.
IV.C. Multi-Tracer Imaging Endpoints
For conventional single-tracer PET, dynamic imaging is only performed when some form of kinetic analysis is needed, e.g. quantification of kinetic rate parameters or characterization of retention times. While dynamic imaging is common in the research setting, the majority of clinical PET scans are performed in static mode, with static images and static imaging measures (e.g. SUVs) being the most common endpoints. Multi-tracer PET signal-recovery techniques require that dynamic imaging be performed in order to utilize kinetic constraints to perform the signal-recovery. This differs from single-tracer imaging in that dynamic mode is necessitated by the need for multi-tracer signal-recovery, not by the need for kinetic analysis. While the recovered signals for each individual tracer contain kinetic information and can be analyzed as such, static images and endpoints may be desired (and simpler) for many tracers and potential clinical applications. This does not pose a problem, as  can be summed or integrated over time to produce corresponding static measurements. The accuracy of each possible imaging endpoint depends on the tracers present, injection sequence and timing, quality of the data, and performance of the signal-recovery algorithm, and care should be taken to identify the target endpoints in advance and design the multi-tracer imaging protocol accordingly. Significant work may be required to develop multi-tracer imaging protocols for particular tracer combinations and clinical applications. We now discuss example imaging endpoints, contemplating what multi-tracer imaging signals and data-types could be used for achieving the desired endpoint.
Static Image A static image in PET displays the radioactivity (or radioactivity concentration) in each voxel averaged over some imaging timeperiod t1 to t2. Under the condition that the actual radioactivity distribution is fixed or at equilibrium (disregarding radioactive decay), which is a common assumption or approximation for many imaging scenarios, the static image represents the “final” distribution of the tracer. To obtain a static image of tracer n from multi-tracer PET, signal-separation must consider each voxel of the image. Typically, a multi-tracer signal  would be identified as the time-activity curve for each voxel (though kinetic analysis methods which operate on clusters of voxels or the four-dimensional (4D) image as a whole might also be considered). The recovered signal
  would also be a time-activity curve, which can be integrated from t1 to t2 to produce the recovered voxel value. Repeating this process for every image voxel and collecting the results, the recovered static image of tracer n is formed. Recovery of static images from multi-tracer datasets requires robust techniques, however, as noise levels in individual voxels tend to complicate performance.
Standardized Uptake Value (SUV) A common imaging endpoint for oncologic PET is the SUV of a tumor, representing the uptake of the tracer in a tumor ROI normalized by the injected dose and body mass (or body surface area). This is a semi-quantitative static imaging measure computed for a “static” image acquired from times t1 to t2. One approach to measuring an SUV for tracer n in multi-tracer PET would be to first create the static image as described above, and then compute the SUV from the static image. When the static image is not needed, the SUV could also be computed more directly by identifying the multi-tracer signal  as the time-activity curve for the ROI(s) under consideration. Signal-separation is performed, yielding the recovered time-activity curve
  for tracer n, which is then integrated from t1 to t2 and scaled to compute the SUV.
Kinetic Rate Parameter or Macroparameter Dynamic PET with compartment modeling can be used to quantify kinetic rate parameters or macroparameters describing tracer uptake, retention, or washout. The kinetic parameters or macroparameters can be estimated for image regions or ROIs, or they can be calculated for every image voxel. For multi-tracer PET, the multi-tracer signal  can be identified as the time-activity curve for each ROI or voxel under consideration. Two approaches can be taken to estimate the endpoint parameter(s). Model-Restricted Signal-Recovery can be applied, using the appropriate compartment model for tracer n such that the desired kinetic parameter is estimated directly from the fitting step of the signal recovery algorithm. In fact, if the kinetic parameter is the only endpoint of interest, explicit signal-separation need not be completed as the parameter is already estimated by the fitting step. While this approach directly estimates the parameter of interest, it is also more sensitive to any deficiencies in the kinetic models—both for tracer n and for errors propagating from the other tracers present. Alternatively, Model-Guided Signal-Separation can be performed to separate
  and recover
  , where we note that the kinetic model used for this separation may or may not be identical to the one used to compute the final parameter endpoint. The recovered signal is then analyzed using single-tracer methods to obtain the final parameter estimate. Error propagation differs for the Model-Guided vs. Model-Restricted approaches, and testing is necessary for each specific tracer combination and multi-tracer imaging protocol.
Parametric Images Parametric images display kinetic parameters on a voxel-by-voxel basis. The multi-tracer signal  would typically be identified for each individual voxel, though kinetic analysis methods which operate on clusters of voxels or the 4D image as a whole might also be considered. The same methods just described for computing a kinetic parameter for a single region can be applied for each of the voxels, with the results collected to form the desired parametric image. Since different body tissues may have different kinetics for a given tracer, care should be taken to ensure that appropriate kinetic constraints are used for each voxel.
V. Discussion
The primary limitations on rapid multi-tracer PET include the need for dynamic imaging (of potentially long duration), sensitivity to the tracer combination and imaging protocol used, and the potential loss of valuable information regarding one or more tracers. The technique cannot provide identical images to separate single-tracer imaging of each tracer, and some information is irretrievably lost by the rapid multi-tracer imaging procedure. However, careful attention to tracer selection, protocol design, and signal-recovery can ensure that high quality measures of the clinically relevant imaging endpoints for each tracer can be obtained.
The kinetic constraints used for multi-tracer signal-recovery do not make a priori assumptions regarding a tracer's kinetic parameters; rather, only the general form and allowable shapes of each tracers' time-activity curve are constrained. For example, consider conventional single-tracer compartment modeling with a bolus tracer injection. The compartment model encompasses known tracer kinetic behaviors, such as wash-in and wash-out phases with or without irreversible trapping, but also excludes unrealistic shapes (such as a saw-tooth curve) that could not arise from the given input function. Multi-tracer PET kinetic constraints act in the same manner to exclude unrealistic tracer behaviors without forcing predetermined values upon the tracer's kinetic parameters.
While many signal-recovery algorithms rely upon the use of compartment models, the requirements for input function accuracy are much different than for conventional compartment modeling. When kinetic rate parameters are among the targeted imaging endpoints, then accurate input functions for each tracer are necessary (as for single-tracer modeling), and moreover the plasma activity concentrations of each tracer need to be separated. However, when static imaging endpoints such as SUVs are targeted, then approximate input functions may well provide accurate signal-separation. The key requirement is that the approximate input functions be consistent with the time-activity curves (e.g. have a peak that corresponds to a tracer's bolus injection, and have a tail that is reasonably consistent with the tracer's later kinetic behavior) so that the kinetic constraints are valid for multi-tracer signal-separation. For example, an input function with the proper scale is required to estimate a valid K1 value; however, the scale of the input function is irrelevant for separating multi-tracer time-activity curves.
It is difficult to predict multi-tracer PET performance for general tracer combinations, and the technique should be studied and optimized for each tracer combination under consideration. However, some general observations can be made. Overall, the technique works well when the injection delays are long relative to the timing of the tracer kinetics and radioactive decay. For example, tracers that experience rapid uptake with irreversible trapping tend to be very amenable to rapid multi-tracer imaging. Combinations of one “fast” and one “slow” tracer also tend to work well, though more attention to protocol design is needed. Finally, the technique tends to break down when more than one tracer is undergoing significant kinetic changes throughout the temporally overlapping portion of the scan. As with single-tracer imaging, recovery of static imaging measures and SUVs tend to be the most robust. Kinetic macroparameters (e.g. net-uptake, distribution volume) and K1 also tend to be well recovered, but higher-order individual rate parameters tend to be more sensitive to noise and may be lost by the multi-tracer imaging procedure.
VI. Summary
There is a significant and growing body of evidence that characterization of multiple aspects of tumor physiology and function using multi-tracer PET imaging can provide additional and complementary information relevant to clinical decision making. The multi-tracer PET imaging paradigm has great potential for assisting personalized oncology, such as guiding selection of the most effective targeted therapies for individual patients and monitoring tumor responses. However, imaging multiple PET tracers in a single patient presents a number of challenges.
A number of techniques are under development for rapidly imaging multiple PET tracers in a single scan, where signal-recovery processing algorithms are employed to recover various imaging endpoints for each tracer. Using dynamic imaging with tracer injections staggered in time, constraints on the allowable kinetic behavior of each tracer can be employed to recover estimates of each tracers' contribution to the multi-tracer PET imaging signal. Additional measurements, such as detecting prompt high-energy gammas emitted by certain positron-emitting radioisotopes, may also aid in the multi-tracer signal-recovery process. It is important to note that rapid multi-tracer PET cannot provide images identical to those from conventional single-tracer imaging, as some information is irretrievable lost for temporally-overlapping datasets. However, mounting evidence suggests that much of the relevant clinical information, such as SUVs and kinetic macroparameters, can be accurately recovered for each tracer in many cases. Given the complexity of the approach, multi-tracer techniques need to be specifically optimized and tested for each particular tracer combination and application. The characteristics and requirements of the techniques will differ for different tracer combinations, and the state of the field has not yet advanced to the point where the performance of multi-tracer PET techniques can be generalized to all possible tracer combinations. Rapid multi-tracer PET techniques have great potential for both research and clinical cancer imaging applications, and continued research in this area is warranted.
Acknowledgements
This paper was supported by a grant R01CA135556 from the National Cancer Institute, by Cancer Center Support Grant 3P30CA042014 from the National Cancer Institute, and by the Huntsman Cancer Foundation. The content is solely the responsibility of the authors and does not necessarily represent the official views of the National Cancer Institute or the National Institutes of Health.
Competing Interests
The authors have declared that no competing interest exists.
References
1. Gambhir SS, Czernin J, Schwimmer J, Silverman DH, Coleman RE, Phelps ME. A tabulated summary of the FDG PET literature. J Nucl Med. 2001;42:1S-93S
2. Kubota K. From tumor biology to clinical PET: a review of positron emission tomography (PET) in oncology. Ann Nucl Med. 2001;15:471-86
3. Shields AF. PET imaging with 18F-FLT and thymidine analogs: promise and pitfalls. J Nucl Med. 2003;44:1432-4
4. Shields AF, Grierson JR, Dohmen BM, Machulla HJ, Stayanoff JC, Lawhorn-Crews JM. et al. Imaging proliferation in vivo with [F-18]FLT and positron emission tomography. Nat Med. 1998;4:1334-6
5. Herholz K, Holzer T, Bauer B, Schroder R, Voges J, Ernestus RI. et al. 11C-methionine PET for differential diagnosis of low-grade gliomas. Neurology. 1998;50:1316-22
6. Jager PL, Vaalburg W, Pruim J, de Vries EG, Langen KJ, Piers DA. Radiolabeled amino acids: basic aspects and clinical applications in oncology. J Nucl Med. 2001;42:432-45
7. Narayanan TK, Said S, Mukherjee J, Christian B, Satter M, Dunigan K. et al. A comparative study on the uptake and incorporation of radiolabeled methionine, choline, and fluorodeoxyglucose in human astrocytoma. Mol Imag Biol. 2002;4:147-56
8. Anderson H, Price P. Clinical measurement of blood flow in tumours using positron emission tomography: a review. Nucl Med Commun. 2002;23:131-8
9. Choyke PL, Knopp MV, Libutti SK. Special techniques for imaging blood flow to tumors. Cancer J. 2002;8:109-18
10. Ballinger JR. Imaging hypoxia in tumors. Semin Nucl Med. 2001;31:321-9
11. Gronroos T, Eskola O, Lehtio K, Minn H, Marjamaki P, Bergman J. et al. Pharmacokinetics of [18F]FETNIM: a potential marker for PET. J Nucl Med. 2001;42:1397-404
12. Lewis JS, Welch MJ. PET imaging of hypoxia. Q J Nucl Med. 2001;45:183-8
13. Yang DJ, Wallace S, Cherif A, Li C, Gretzer MB, Kim EE. et al. Development of F-18-labeled fluoroerythronitroimidazole as a PET agent for imaging tumor hypoxia. Radiology. 1995;194:795-800
14. Dimitrakopoulou-Strauss A, Strauss LG, Burger C. Quantitative PET studies in pretreated melanoma patients: a comparison of 6-[18F]fluoro-L-dopa with 18F-FDG and (15)O-water using compartment and noncompartment analysis. J Nucl Med. 2001;42:248-56
15. Graham MM. Combined 18F-FDG-FDOPA tumor imaging for assessing response to therapy. J Nucl Med. 2001;42:257-8
16. Hawkins RA, Choi Y, Huang SC, Messa C, Hoh CK, Phelps ME. Quantitating tumor glucose metabolism with FDG and PET. J Nucl Med. 1992;33:339-44
17. Hoegerle S, Altehoefer C, Ghanem N, Koehler G, Waller CF, Scheruebl H. et al. Whole-body 18F dopa PET for detection of gastrointestinal carcinoid tumors. Radiology. 2001;220:373-80
18. Keen HG, Dekker BA, Disley L, Hastings D, Lyons S, Reader AJ. et al. Imaging apoptosis in vivo using 124I-annexin V and PET. Nucl Med Biol. 2005;32:395-402
19. Mintun MA, Welch MJ, Siegel BA, Mathias CJ, Brodack JW, McGuire AH. et al. Breast cancer: PET imaging of estrogen receptors. Radiology. 1988;169:45-8
20. Yagle KJ, Eary JF, Tait JF, Grierson JR, Link JM, Lewellen B. et al. Evaluation of 18F-annexin V as a PET imaging agent in an animal model of apoptosis. J Nucl Med. 2005;46:658-66
21. Inoue T, Kim EE, Wong FC, Yang DJ, Bassa P, Wong WH. et al. Comparison of fluorine-18-fluorodeoxyglucose and carbon-11-methionine PET in detection of malignant tumors. J Nucl Med. 1996;37:1472-6
22. Inoue T, Oriuchi N, Tomiyoshi K, Endo K. A shifting landscape: what will be next FDG in PET oncology? Ann Nucl Med. 2002;16:1-9
23. Mankoff DA, Dehdashti F, Shields AF. Characterizing tumors using metabolic imaging: PET imaging of cellular proliferation and steroid receptors. Neoplasia. 2000;2:71-88
24. Mankoff DA, Dunnwald LK, Gralow JR, Ellis GK, Charlop A, Lawton TJ. et al. Blood flow and metabolism in locally advanced breast cancer: relationship to response to therapy. J Nucl Med. 2002;43:500-9
25. Mankoff DA, Dunnwald LK, Gralow JR, Ellis GK, Schubert EK, Tseng J. et al. Changes in blood flow and metabolism in locally advanced breast cancer treated with neoadjuvant chemotherapy. J Nucl Med. 2003;44:1806-14
26. Rajendran JG, Krohn KA. Imaging hypoxia and angiogenesis in tumors. Radiologic clinics of North America. 2005;43:169-87
27. Roelcke U, Radu EW, von Ammon K, Hausmann O, Maguire RP, Leenders KL. Alteration of blood-brain barrier in human brain tumors: comparison of [18F]fluorodeoxyglucose, [11C]methionine and rubidium-82 using PET. J Neurol Sci. 1995;132:20-7
28. Enslow MS, Zollinger LV, Morton KA, Butterfield RI, Kadrmas DJ, Christian PE. et al. Comparison of 18F-Fluorodeoxyglucose and 18F-Fluorothymidine PET in Differentiating Radiation Necrosis From Recurrent Glioma. Clin Nucl Med. 2012;37:854-61 doi:10.1097/RLU.0b013e318262c76a
29. Herrmann K, Erkan M, Dobritz M, Schuster T, Siveke JT, Beer AJ. et al. Comparison of 3'-deoxy-3'-[(1)(8)F]fluorothymidine positron emission tomography (FLT PET) and FDG PET/CT for the detection and characterization of pancreatic tumours. Eur J Nucl Med Mol Imag. 2012;39:846-51 doi:10.1007/s00259-012-2061-8
30. Hoshikawa H, Nishiyama Y, Kishino T, Yamamoto Y, Haba R, Mori N. Comparison of FLT-PET and FDG-PET for visualization of head and neck squamous cell cancers. Mol Imag Biol. 2011;13:172-7 doi:10.1007/s11307-010-0331-z
31. Kahraman D, Scheffler M, Zander T, Nogova L, Lammertsma AA, Boellaard R. et al. Quantitative analysis of response to treatment with erlotinib in advanced non-small cell lung cancer using 18F-FDG and 3'-deoxy-3'-18F-fluorothymidine PET. J Nucl Med. 2011;52:1871-7 doi:10.2967/jnumed.111.094458
32. Kobe C, Scheffler M, Holstein A, Zander T, Nogova L, Lammertsma AA. et al. Predictive value of early and late residual (18)F-fluorodeoxyglucose and (18)F-fluorothymidine uptake using different SUV measurements in patients with non-small-cell lung cancer treated with erlotinib. Eur J Nucl Med Mol Imag. 2012;39:1117-27 doi:10.1007/s00259-012-2118-8
33. Ott K, Herrmann K, Schuster T, Langer R, Becker K, Wieder HA. et al. Molecular imaging of proliferation and glucose utilization: utility for monitoring response and prognosis after neoadjuvant therapy in locally advanced gastric cancer. Annals of surgical oncology. 2011;18:3316-23 doi:10.1245/s10434-011-1743-y
34. Tian J, Yang X, Yu L, Chen P, Xin J, Ma L. et al. A multicenter clinical trial on the diagnostic value of dual-tracer PET/CT in pulmonary lesions using 3'-deoxy-3'-18F-fluorothymidine and 18F-FDG. J Nucl Med. 2008;49:186-94 doi:10.2967/jnumed.107.044966
35. Vera P, Bohn P, Edet-Sanson A, Salles A, Hapdey S, Gardin I. et al. Simultaneous positron emission tomography (PET) assessment of metabolism with (1)(8)F-fluoro-2-deoxy-d-glucose (FDG), proliferation with (1)(8)F-fluoro-thymidine (FLT), and hypoxia with (1)(8)fluoro-misonidazole (F-miso) before and during radiotherapy in patients with non-small-cell lung cancer (NSCLC): a pilot study. Radiotherapy and oncology: journal of the European Society for Therapeutic Radiology and Oncology. 2011;98:109-16 doi:10.1016/j.radonc.2010.10.011
36. Xu B, Guan Z, Liu C, Wang R, Yin D, Zhang J. et al. Can multimodality imaging using 18F-FDG/18F-FLT PET/CT benefit the diagnosis and management of patients with pulmonary lesions? Eur J Nucl Med Mol Imag. 2011;38:285-92 doi:10.1007/s00259-010-1625-8
37. Yamamoto Y, Nishiyama Y, Kimura N, Ishikawa S, Okuda M, Bandoh S. et al. Comparison of (18)F-FLT PET and (18)F-FDG PET for preoperative staging in non-small cell lung cancer. Eur J Nucl Med Mol Imag. 2008;35:236-45 doi:10.1007/s00259-007-0613-0
38. Yang W, Zhang Y, Fu Z, Yu J, Sun X, Mu D. et al. Imaging of proliferation with 18F-FLT PET/CT versus 18F-FDG PET/CT in non-small-cell lung cancer. Eur J Nucl Med Mol Imag. 2010;37:1291-9 doi:10.1007/s00259-010-1412-6
39. Zander T, Scheffler M, Nogova L, Kobe C, Engel-Riedel W, Hellmich M. et al. Early prediction of nonprogression in advanced non-small-cell lung cancer treated with erlotinib by using [(18)F]fluorodeoxyglucose and [(18)F]fluorothymidine positron emission tomography. J Clin Oncol. 2011;29:1701-8 doi:10.1200/JCO.2010.32.4939
40. Halter G, Buck AK, Schirrmeister H, Wurziger I, Liewald F, Glatting G. et al. [18F] 3-deoxy-3'-fluorothymidine positron emission tomography: alternative or diagnostic adjunct to 2-[18f]-fluoro-2-deoxy-D-glucose positron emission tomography in the workup of suspicious central focal lesions? J Thorac Cardiovasc Surg. 2004;127:1093-9
41. Kubota K, Tada M, Yamada S, Hori K, Saito S, Iwata R. et al. Comparison of the distribution of fluorine-18 fluoromisonidazole, deoxyglucose and methionine in tumour tissue. European journal of nuclear medicine. 1999;26:750-7
42. d'Argy R, Paul R, Frankenberg L, Stalnacke CG, Lundqvist H, Kangas L. et al. Comparative double-tracer whole-body autoradiography: uptake of 11C-, 18F- and 3H-labeled compounds in rat tumors. Int J Rad Appl Instrum B. 1988;15:577-85
43. Rajendran JG, Mankoff DA, O'Sullivan F, Peterson LM, Schwartz DL, Conrad EU. et al. Hypoxia and glucose metabolism in malignant tumors: evaluation by [18F]fluoromisonidazole and [18F]fluorodeoxyglucose positron emission tomography imaging. Clin Cancer Res. 2004;10:2245-52
44. Larson SM. Positron emission tomography-based molecular imaging in human cancer: exploring the link between hypoxia and accelerated glucose metabolism. Clin Cancer Res. 2004;10:2203-4
45. Moore RB, Chapman JD, Mercer JR, Mannan RH, Wiebe LI, McEwan AJ. et al. Measurement of PDT-induced hypoxia in Dunning prostate tumors by iodine-123-iodoazomycin arabinoside. J Nucl Med. 1993;34:405-11
46. Groshar D, McEwan AJ, Parliament MB, Urtasun RC, Golberg LE, Hoskinson M. et al. Imaging tumor hypoxia and tumor perfusion. J Nucl Med. 1993;34:885-8
47. Lewis JS, McCarthy DW, McCarthy TJ, Fujibayashi Y, Welch MJ. Evaluation of 64Cu-ATSM in vitro and in vivo in a hypoxic tumor model. J Nucl Med. 1999;40:177-83
48. Lehtio K, Oikonen V, Gronroos T, Eskola O, Kalliokoski K, Bergman J. et al. Imaging of blood flow and hypoxia in head and neck cancer: initial evaluation with [(15)O]H(2)O and [(18)F]fluoroerythronitroimidazole PET. J Nucl Med. 2001;42:1643-52
49. Lehtiö K, Oikonen V, Nyman S, Gronroos T, Roivainen A, Eskola O. et al. Quantifying tumour hypoxia with fluorine-18 fluoroerythronitroimidazole ([18F]FETNIM) and PET using the tumour to plasma ratio. Eur J Nucl Med Mol Imag. 2003;30:101-8
50. Eary JF, Krohn KA. Positron emission tomography: imaging tumor response. European journal of nuclear medicine. 2000;27:1737-9
51. Hoekstra CJ, Paglianiti I, Hoekstra OS, Smit EF, Postmus PE, Teule GJ. et al. Monitoring response to therapy in cancer using [18F]-2-fluoro-2-deoxy-D-glucose and positron emission tomography: an overview of different analytical methods. European journal of nuclear medicine. 2000;27:731-43
52. Lammertsma AA. Measurement of tumor response using [18F]-2-fluoro-2-deoxy-D-glucose and positron-emission tomography. J Clin Pharmacol. 2001(Suppl):104S-6S
53. Stokkel MP, Draisma A, Pauwels EK. Positron emission tomography with 2-[18F]-fluoro-2-deoxy-D-glucose in oncology. Part IIIb: Therapy response monitoring in colorectal and lung tumours, head and neck cancer, hepatocellular carcinoma and sarcoma. J Cancer Res Clin Oncol. 2001;127:278-85
54. van der Hiel B, Pauwels EK, Stokkel MP. Positron emission tomography with 2-[18F]-fluoro-2-deoxy-D-glucose in oncology. Part IIIa: Therapy response monitoring in breast cancer, lymphoma and gliomas. J Cancer Res Clin Oncol. 2001;127:269-77
55. Young H, Baum R, Cremerius U, Herholz K, Hoekstra O, Lammertsma AA. et al. Measurement of clinical and subclinical tumour response using [18F]-fluorodeoxyglucose and positron emission tomography: review and 1999 EORTC recommendations. European Organization for Research and Treatment of Cancer (EORTC) PET Study Group. Eur J Cancer. 1999;35:1773-82
56. Kubota K, Ishiwata K, Kubota R, Yamada S, Tada M, Sato T. et al. Tracer feasibility for monitoring tumor radiotherapy: a quadruple tracer study with fluorine-18-fluorodeoxyglucose or fluorine-18-fluorodeoxyuridine, L-[methyl-14C]methionine, [6-3H]thymidine, and gallium-67. J Nucl Med. 1991;32:2118-23
57. Sasaki Y. Monitoring tumor radiotherapy. J Nucl Med. 1991;32:2124-5
58. Frackowiak RS, Lenzi GL, Jones T, Heather JD. Quantitative measurement of regional cerebral blood flow and oxygen metabolism in man using 15O and positron emission tomography: theory, procedure, and normal values. J Comput Assist Tomogr. 1980;4:727-36
59. Jacobs AH, Thomas A, Kracht LW, Li H, Dittmar C, Garlip G. et al. 18F-fluoro-L-thymidine and 11C-methylmethionine as markers of increased transport and proliferation in brain tumors. J Nucl Med. 2005;46:1948-58
60. Van Laere K, Ceyssens S, Van Calenbergh F, de Groot T, Menten J, Flamen P. et al. Direct comparison of 18F-FDG and 11C-methionine PET in suspected recurrence of glioma: sensitivity, inter-observer variability and prognostic value. Eur J Nucl Med Mol Imag. 2005;32:39-51
61. Heiss WD, Wienhard K, Wagner R, Lanfermann H, Thiel A, Herholz K. et al. F-Dopa as an amino acid tracer to detect brain tumors. J Nucl Med. 1996;37:1180-2
62. Vu T, Fischman AJ. Combined F-18 FDG and C-11 Methionine PET for cerebral tumors. Joint Program in Nuclear Medicine, Harvard University. 2000
63. Zasadny KR, Tatsumi M, Wahl RL. FDG metabolism and uptake versus blood flow in women with untreated primary breast cancers. Eur J Nucl Med Mol Imag. 2003;30:274-80
64. Vaupel P, Hockel M. Blood supply, oxygenation status and metabolic micromilieu of breast cancers: characterization and therapeutic relevance. International journal of oncology. 2000;17:869-79
65. Tseng J, Dunnwald LK, Schubert EK, Link JM, Minoshima S, Muzi M. et al. 18F-FDG kinetics in locally advanced breast cancer: correlation with tumor blood flow and changes in response to neoadjuvant chemotherapy. J Nucl Med. 2004;45:1829-37
66. Hoegerle S, Juengling F, Otte A, Altehoefer C, Moser EA, Nitzsche EU. Combined FDG and [F-18]fluoride whole-body PET: a feasible two-in-one approach to cancer imaging? Radiology. 1998;209:253-8
67. Leskinen-Kallio S, Ruotsalainen U, Nagren K, Teras M, Joensuu H. Uptake of carbon-11-methionine and fluorodeoxyglucose in non-Hodgkin's lymphoma: a PET study. J Nucl Med. 1991;32:1211-8
68. Oyama N, Akino H, Kanamaru H, Suzuki Y, Muramoto S, Yonekura Y. et al. 11C-acetate PET imaging of prostate cancer. J Nucl Med. 2002;43:181-6
69. Oyama N, Miller TR, Dehdashti F, Siegel BA, Fischer KC, Michalski JM. et al. 11C-Acetate PET Imaging of Prostate Cancer: Detection of Recurrent Disease at PSA Relapse. J Nucl Med. 2003;44:549-55
70. Ho CL, Yu SC, Yeung DW. 11C-acetate PET imaging in hepatocellular carcinoma and other liver masses. J Nucl Med. 2003;44:213-21
71. Huang SC, Carson RE, Hoffman EJ, Kuhl DE, Phelps ME. An investigation of a double-tracer technique for positron computerized tomography. J Nucl Med. 1982;23:816-22
72. Verhaeghe J, D'Asseler Y, Staelens S, Lemahieu I. Noise properties of simultaneous dual tracer PET imaging. IEEE Nuclear Science Symposium and Medical Imaging Conference: IEEE Press. 2005:2611-4
73. Figueiras FP, Jimenez X, Pareto D, Gomez V, Llop J, Herance R. et al. Simultaneous Dual-tracer PET imaging of the rat brain and its application in the study of cerebral ischemia. Mol Imag Biol. 2011;13:500-10 doi:10.1007/s11307-010-0370-5
74. Kearfott KJ. Feasibility of simultaneous and sequentially administered dual tracer protocols for measurement of regional cerebral haematocrit using positron emission tomography. Physics in medicine and biology. 1990;35:249-58
75. Koeppe RA, Ficaro EP, Raffel DM, Minoshima S, Kilbourn MR. Temporally overlapping dual-tracer PET studies. In: Carson RE, Daube-Witherspoon ME, Herscovitch P, editors. Quantitative Functional Brain Imaging with Positron Emission Tomography. San Diego, CA: Academic Press. 1998:359-66
76. Koeppe RA, Joshi A, Frey K, Snyder SE, Kilbourn MR, Fessler J. Dual-Tracer PET Studies without Arterial Sampling. NeuroImage. 2004;22:T115-T6
77. Koeppe RA, Raffel DM, Snyder SE, Ficaro EP, Kilbourn MR, Kuhl DE. Dual-[11C]tracer single-acquisition positron emission tomography studies. J Cereb Blood Flow Metab. 2001;21:1480-92
78. Nishizawa S, Kuwabara H, Ueno M, Shimono T, Toyoda H, Konishi J. Double-injection FDG method to measure cerebral glucose metabolism twice in a single procedure. Ann Nucl Med. 2001;15:203-7
79. Ikoma Y, Toyama H, Suhara T. Simultaneous quantification of two brain functions with dual tracer injection in PET dynamic study. Quantitation in Biomedical Imaging with PET and MRI. 2004;1265:74-8 doi:10.1016/j.ics.2004.04.015
80. Converse AK, Barnhart TE, Dabbs KA, DeJesus OT, Larson JA, Nickles RJ. et al. PET Measurement of rCBF in the presence of a neurochemical tracer. J Neurosci Methods. 2004;132:199-208 doi:S0165027003003017 [pii]
81. Converse AK, DeJesus OT, Flores LG, Holden JE, Kelley AE, Moirano JM. et al. Development of a dual tracer PET method for imaging dopaminergic neuromodulation. Astroparticle, particle and space physics, detectors and medical physics applications, 9th Conference. 2005:682-91
82. Kadrmas DJ, Rust TC. Feasibility of rapid multitracer PET tumor imaging. IEEE Trans Nucl Sci. 2005;52:1341-7 doi:10.1109/TNS.2005.858230
83. Kudomi N, Hayashi T, Teramoto N, Watabe H, Kawachi N, Ohta Y. et al. Rapid quantitative measurement of CMRO(2) and CBF by dual administration of (15)O-labeled oxygen and water during a single PET scan-a validation study and error analysis in anesthetized monkeys. J Cereb Blood Flow Metab. 2005;25:1209-24 doi:10.1038/sj.jcbfm.9600118
84. Kudomi N, Watabe H, Hayashi T, Iida H. Separation of input function for rapid measurement of quantitative CMRO2 and CBF in a single PET scan with a dual tracer administration method. Physics in medicine and biology. 2007;52:1893-908 doi:S0031-9155(07)31800-9 [pii] 10.1088/0031-9155/52/7/009
85. Iwanishi K, Watabe H, Hayashi T, Miyake Y, Minato K, Iida H. Influence of residual oxygen-15-labeled carbon monoxide radioactivity on cerebral blood flow and oxygen extraction fraction in a dual-tracer autoradiographic method. Ann Nucl Med. 2009;23:363-71 doi:10.1007/s12149-009-0243-7
86. Rust TC, Kadrmas DJ. Rapid dual-tracer PTSM+ATSM PET imaging of tumour blood flow and hypoxia: a simulation study. Physics in medicine and biology. 2006;51:61-75
87. Black NF, McJames S, Rust TC, Kadrmas DJ. Evaluation of rapid dual-tracer (62)Cu-PTSM + (62)Cu-ATSM PET in dogs with spontaneously occurring tumors. Physics in medicine and biology. 2008;53:217-32 doi:S0031-9155(08)54096-6 [pii]10.1088/0031-9155/53/1/015
88. El Fakhri G, Sitek A, Guerin B. Simultaneous Dual Tracer PET Using Generalized Factor Analysis of Dynamic Sequences. IEEE Nuclear Science Symposium and Medical Imaging Conference: IEEE Press. 2006:2128-30
89. Joshi AD, Koeppe RA, Fessler JA, Kilbourn MR. Signal separation and parameter estimation in noninvasive dual-tracer PET scans using reference-region approaches. J Cereb Blood Flow Metab. 2009;29:1346-57 doi:jcbfm200953 [pii]10.1038/jcbfm.2009.53
90. Black NF, McJames S, Kadrmas DJ. Rapid Multi-Tracer PET Tumor Imaging With F-FDG and Secondary Shorter-Lived Tracers. IEEE Trans Nucl Sci. 2009;56:2750-8 doi:10.1109/TNS.2009.2026417
91. Gao F, Liu H, Jian Y, Shi P. Dynamic dual-tracer PET reconstruction. Inf Process Med Imag. 2009;21:38-49
92. Kadrmas DJ, Di Bella EVR, Black NF, Rust TC. Rapid Multi-Tracer PET Imaging Systems and Methods. Office UP, editor. USA: University of Utah Research Foundation. 2010
93. Kadrmas DJ, Rust TC, Hoffman JM. Single-Scan Dual-Tracer FLT+FDG PET Tumor Characterization. Physics in medicine and biology. 2013;58:429-49
94. Andreyev A, Celler A. Dual-isotope PET using positron-gamma emitters. Physics in medicine and biology. 2011;56:4539-56 doi:S0031-9155(11)83723-1 [pii] 10.1088/0031-9155/56/14/020
95. Verhaeghe J, Reader AJ. Simultaneous Water Activation and Glucose Metabolic Rate Imaging with PET. IEEE Nuclear Science Symposium and Medical Imaging Conference: IEEE Press. 2011:3217-23
Author contact
![]() Corresponding author: kadrmasmed.utah.edu
Corresponding author: kadrmasmed.utah.edu