Impact Factor
- Issue 10; 2026
- Issue 9; 2026
- Issue 8; 2026
- Issue 7; 2026
- Issue 6; 2026
- Volume 16; 2026
- Advance Articles
- Past Issues
- Cover Images
- Cover Suggestion
- Index & Coverage
- Special Issues
Introduction
PET data acquisition
Prediction of PET activity...
Use of PET images for proton...
Conclusions
References
International Journal of Biological Sciences
International Journal of Medical Sciences
 Global reach, higher impact

Theranostics 2013; 3(10):731-740. doi:10.7150/thno.5162 This issue Cite
Review
Proton Therapy Verification with PET Imaging
Xuping Zhu, Georges El Fakhri ![]()
Center for Advanced Medical Imaging Sciences, NMMI Division, Radiology Department, Massachusetts General Hospital, Harvard Medical School, Boston.
Received 2012-9-4; Accepted 2013-8-28; Published 2013-9-19
Abstract
Proton therapy is very sensitive to uncertainties introduced during treatment planning and dose delivery. PET imaging of proton induced positron emitter distributions is the only practical approach for in vivo, in situ verification of proton therapy. This article reviews the current status of proton therapy verification with PET imaging. The different data detecting systems (in-beam, in-room and off-line PET), calculation methods for the prediction of proton induced PET activity distributions, and approaches for data evaluation are discussed.
Keywords: proton therapy, proton range verification, PET imaging.
Introduction
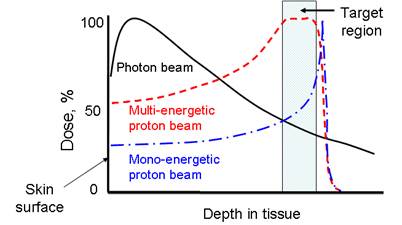
Proton therapy is one of the most precise modalities of external radiation therapy. Unlike a photon beam which has a high entrance dose and decreases gradually while passing through the body, a proton beam can penetrate through tissues and deposit most of its energy near the end of its track, known as the Bragg peak (Figure 1). In clinics, a spread-out Bragg peak (SOBP) field can be generated by using protons of multiple energies. Compared to the conventional photon therapy, proton therapy has a much lower entrance dose and no dose beyond the target volume. Because of this unique depth-dose characteristic, proton therapy is able to deliver highly conformal radiation fields to target volumes. Therefore, it is preferred for tumors with irregular shapes and/or around critical structure. Also, because of its much lower integral dose (approximately 60% lower than in photon therapy [1]), proton therapy is preferred for the treatments of pediatric patients, when the probability of secondary tumor caused by radiation dose to the normal tissue is a concern. For these reasons, the number of proton therapy centers is growing rapidly worldwide despite the high capital cost. Several companies are currently developing compact proton treatment equipment, which is expected to greatly reduce the cost of proton therapy.
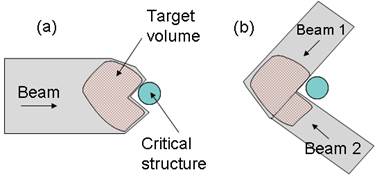
However, proton therapy is also more sensitive to uncertainties in treatment planning and delivery compared to photon therapy. Proton range inaccuracy is particularly of concern [2, 3]. Due to the steep gradient of dose fall-off at the Bragg peak region, uncertainties in proton therapy planning have more severe consequences than in photon therapy. A range error could mean a portion of a tumor not receiving any radiation dose at all (under-shooting), or the normal tissue lying distal to the beam receiving a full dose (over-shooting). Range uncertainties could potentially prevent the full utilization of the physics advantage of proton therapy. For example, in the case of a tumor in close proximity to a critical structure, shown in Figure 2, the optimal arrangement of one single beam stopping in the tumor right in front of the critical structure (a) would have to be substituted with a more conservative arrangement of two patched beams (b) to protect the critical structure from possible radiation damage.
The comparison of dose-depth profiles for photon and proton therapies.
Uncertainties in proton therapy arise from several sources. In the treatment planning process, range uncertainties can be caused by stochastic errors (CT noise), CT artifacts, CT resolution (partial volume effects), and most importantly, the Hounsfield unit (HU) conversion method [2, 3]. Currently most commercial planning systems are based on analytical pencil-beam dose calculation algorithms, which project the range based on the water-equivalent depth in the patient using empirical HU conversion schemes to translate CT scans into relative stopping powers. Such conversion formalism cannot be directly validated in vivo, causing intrinsic range uncertainties in treatment planning calculations. In addition, since CT scans provide only electron density distribution, the analytical algorithm cannot correctly model some other physics effects, such as multiple Coulomb scattering and non-elastic nuclear reactions, especially at interfaces of alternating low- and high- density tissues. Therefore, further range degradation is expected in case of complex geometries and density variations. During treatment, further uncertainties are introduced due to setup and positioning errors, organ motions, and change of anatomical structures, such as the shrinkage of tumors or change of weights.
(a) The optimal beam arrangement of one proton beam stopped in a target volume right in front of a critical structure. (b) The conservative beam arrangement of two patched beams to avoid possible damage to the critical structure.
Verification of proton therapy is very important to ensure treatment planning and delivery systems are functioning properly. Furthermore, understanding the uncertainties in proton therapy is important for the determination of the safety margins in treatment planning. Since proton beams stop completely in the body, direct in vivo treatment monitoring is difficult. Point dose measurement with implanted dosimeter has been proposed for range monitoring, but the approach is invasive and involves splitting an SOBP field into two opposite 'sloped' subfields [4]. Three methods are being investigated for in vivo, non-invasive imaging of dosimetry for proton therapy. MRI has been used to measure the physiological changes in proton irradiated tissues, such as the fatty replacement of vertebra bone marrow, however this cannot be done in-situ because the physiological changes take several weeks to develop [5]. The prompt gamma imaging approach uses prompt gamma emission produced by inelastic interactions of incident protons and target nuclei to verify the proton dose delivery and range [6-8]. The prompt gamma rays have a high production rate and can be detected within a few nanoseconds after the nuclear reactions. However, most of the emissions correlated to proton range are in the energy range of 4~10 MeV, and there are no practical detectors available for prompt gamma detection. Currently the only practical approach is the PET imaging of proton induced position emitters [9-15]. In this review the current status of investigations on PET verification of proton therapy and the quantitative methods used are discussed.
Rationale for Proton therapy verification with PET
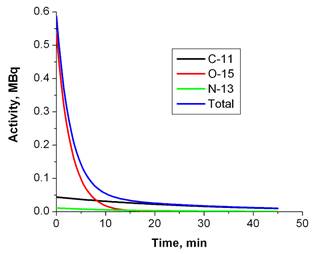
Using PET imaging for the verification of hadron therapy was first proposed by Maccabee et al in 1969[16]. During an ion beam irradiation, positron emitters are produced on the beam path through nuclear fragmentation reactions, leaving a footprint of radiotracers that can be imaged with a PET scanner. While for heavier ions (such as 12C or 16O beams) the fragmentation reaction can happen on both the incident particles (projectile fragmentation) and target nuclei (target fragmentation), for a proton beam only target fragmentation is possible. Major reaction channels are listed in Table 1[17, 18]. Parodi et al calculated the integral yield of several species of radionuclide (15O, 11C, 30P, 38K, etc) for a clinically planned treatment field with Monte Carlo simulations [19]. In soft tissues the most important radionuclide species are 11C, 13N and 15O. Due to the high oxygen density in tissues and the relatively short half-life (therefore high decay constant) of 15O, usually 15O is the dominant contribution to the PET measurement during (for synchrotron-based proton facility only) or immediately after irradiation. However, because of the short half live of 15O, 11C becomes the dominant nuclide after a few minutes. Figure 3 shows the relative contributions of the three nuclide species at different time points when only radioactive decay presents. Because the PET signal originates from contributions of mixed radionuclide species with different decay rates, PET verification of proton therapy is very sensitive to the time course of data acquisition.
Major nuclear reaction channels for proton induced positron emitter productions.
| Radionuclide | Half live (min) | Nuclear reaction channels / Threshold energies (MeV) |
|---|---|---|
| 15O | 2.037 | 16O(p,pn)15O/16.79 |
| 11C | 20.385 | 12C(p,pn)11C/20.61, |
| 14N(p,2p2n)11C/3.22, | ||
| 16O(p,3p3n)11C/59.64 | ||
| 13N | 9.965 | 16O(p,2p2n)13N/5.66, |
| 14N(p,pn)13N/11.44 | ||
| 30P | 2.498 | 31P(p,pn)30P/19.7 |
| 38K | 7.636 | 40Ca(p,2p2n)38K/21.2 |
Dose deposition and positron emitter production in proton therapy are two different processes in hardon therapy. A heavy charged particle loses energy primarily through the ionization and excitation of atoms. When passing through the tissue, the moving charged particle deposits dose by imparting energy to atomic electrons through electromagnetic forces. Positron emitter production, on the other hand, involves nuclear reactions, and the yield depends on several factors including the proton fluence, the cross sections of specific reaction channels (which are energy-dependent) and the density of target nuclei. While for a mono-energetic ion beam (for example, a 12C beam) an activity peak close to the Bragg peak can be found due to projectile fragmentation reactions, for proton therapy (in which only target fragmentation reactions are possible) the PET activity distribution is completely different from the dose distribution, with almost no activities produced within ~1 cm before the Bragg peak due to the energy thresholds of nuclear reactions [20]. Therefore PET activity and dose distributions cannot be compared directly. For treatment verification the PET measurements have to be compared with predicted activity distributions or other reference images.
PET data acquisition
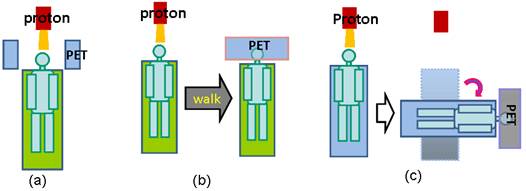
There are three operational modalities for PET verification of proton therapy, based on the PET system used for data acquisition, as illustrated in Figure 4. In-beam PET uses build-in PET detectors attached to the proton treatment system so that PET data can be acquired during (for synchrotron-based proton facilities only) and immediately after treatment. Off-line PET uses an established PET scanner close to the treatment site, often with a CT component. Parodi et al compared the in-beam and off-line modalities for both synchrotron and cyclotron based proton and ion beam therapy facilities [19]. In-room PET uses a stand-alone PET scanner positioned within the treatment room for PET acquisition. The advantages and limitations of the three modalities are discussed here in terms of acquisition time course, data quality and cost effectiveness.
Relative contributions of major radionuclide species as a function of time due to radioactive decay. The simulated production rates in a clinical case during the treatment were from Parodi et al[19].
Three operational modalities for PET verification of proton therapy. (a), in-beam PET, which uses PET detection panels integrated with the beam delivery system; (b), off-line PET, the patients walk to a nearby PET facility for the verification scan; (3), in-room PET, which uses a stand-alone, full-ring PET scanner positioned in the treatment room to scan the patient (still in the treatment bed) soon after treatment.
In-beam PET
Dedicated PET detectors integrated into the beam delivery systems were considered by many to be the method of choice for the PET verification of proton therapy. Currently in-beam PET detectors for hardon therapy (including carbon beam and proton therapy) are installed or under development in several facilities around the world, such as the Gesellschaft für Schwerioneneforschung (GSI), Darmstadt, Germany [21, 22]; the Heavy Ion Medical Accelerator (HIMA) in Chiba, Japan [23]; the CATANA Protontherapy Center in Catana, Italy [24], and the National Cancer Center (NCC), Kashiwa, Japan [13-15]. The most important advantage of in-beam detectors is the time course of PET acquisitions. For cyclotron based facilities, where the beam is delivered continuously during the treatment, PET acquisition can be started immediately following the treatment, minimizing the delay between treatment and PET acquisition. For synchrotron based facilities, where pulsed beam is delivered, PET data can even be collected during the pauses of beam delivery and continued after the treatment as needed. Because of the timely PET data acquisition, the PET activity level in the tissue is at the highest level for both long half live (11C, 13N, etc) and short half live (15O, 10C, etc) components, and the effect of biological washout of PET activities is minimized. Patient repositioning errors and anatomical morphologic changes can also be avoided or minimized as PET data is acquired with the patient still at the treatment position. For treatment sessions with multiple fields, a short PET scan can be taken after the delivery of each field.
However, integration of a dedicated PET system integrated into the beam delivery system is expensive and technically demanding [19]. One of the major technical challenges is the geometric constrains in a treatment environment. In order to ensure an opening for the beam portal and flexible patient positioning, usually a conventional full-ring detector configuration is not feasible. The time-of-flight technique could be used to partially reverse the effects caused by non-complete angles of PET data collection [25], but also involves higher cost and implementation complexity. Another challenge is the synchronization of the PET data acquisition with the beam control system, especially for synchrotron-based facilities collecting PET data between beam spills. PET acquisition is not possible during beam extraction because of the high prompt gamma and neutron backgrounds.
The currently employed in-beam PET systems mostly use dual-head configurations. At GSI, the detectors are mounted above and below the patient couch [22]. At HIMA, the detectors are mounted on a rotating gantry port [13]. The limited angle configuration with in-complete angular data collection resulted in lower sensitivity, limited field of views and artifacts in reconstructed images. In an effort to allow data collection from all angular directions, another configuration, OpenPET, is currently under development at National Institute of Radiological Science, Chiba, Japan [26-30]. The first generation of OpenPET (Dual-ring) system design consists two axially separated detector rings with the beam passing through the gap between the two rings [28]. Although full-ring detectors are used in this configuration, only oblique lines of response are collected and reconstructed, leading to degradations of sensitivity and image quality. The system configuration proposed for the second generation of OpenPET (Single-ring) has a cylinder shape cut at a slant angle, with the shape of each cut end to be an ellipse [30]. The detector ring can be rotated to form an accessible open space for the beam portal. Even though the data collection is still not complete, part of direct lines of responses can be collected. The sensitivity was found to be 1.2 times higher than the dual-ring Open PET, and the simulation results indicated that uniform resolution can be achieved with depth-of-interaction detectors.
Off-line PET
Off-line PET uses a commercial scanner outside of the treatment room for PET imaging after the treatment. Usually this is an established scanner in a nearby location that normally also serves other applications. The pioneer work was done at the Francis H. Burr Proton Therapy Center at the Massachusetts General Hospital (MGH)[9, 10, 12, 31, 32], Boston, followed by other clinical studies at HIMA[33] and Proton Therapy Institute at the University of Florida[34]. A new large-scale clinical trial, the MIRANDA study, is currently being conducted at University Hospital of Heidelberg, Germany [35]. The study plans to recruit 240 subjects of different tumor types for off-line PET verification of both proton and carbon beam therapies.
The off-line option is attractive because it does not require capital investment for the installation of a new scanner in the treatment room, and it has no impact on the patient throughput in the treatment room. The scanner usually has a full-ring configuration, mostly with a CT component. The full-ring configuration allows data collection from all the angular directions, and the CT scan allows accurate co-registration of PET images with treatment planning CT and reliable attenuation correction in PET reconstructions. However, because the imaging is carried out at a remote site, there is a relatively long delay for PET acquisitions, depending on the distance between the treatment and imaging facilities. The delay in the MGH studies ranged from ~15 to 30 minutes, during which time the short-lived radionuclide species, most importantly 15O, had decayed. Therefore, off-line PET can measure only long half-life contributions, mostly from 11C. The performance is further degraded by the biological washout of the proton induced PET activity, which reduces the activity level in the target region (especially for tissues with high perfusion rates) and also changes the relative activity distributions. Other factors affecting the performance of off-line PET include the repositioning errors and patient anatomical changes during transportation and repositioning. These can be partially compensated if an accompany CT scan is taken with the PET scan[12].
In-room PET
In-room PET uses a stand-alone PET scanner positioned within the treatment room for PET imaging. The first in-room PET studies were also carried out at the Francis H. Burr Proton Therapy Center, MGH [36]. A compact, mobile brain PET scanner, NeuroPET from PhotoDiagnostic Systems, Inc, was used for the PET acquisitions. The scanner was positioned next to the beam nozzle, and the treatment couch was rotated and transported to the scan position after the treatment. No patient re-positioning was necessary. The average delay between treatment and PET acquisition was 2.5 minutes
In-room PET is a compromise between in-beam and off-line PET. The cost of a stand-alone PET scanner is significantly lower compared to the installation of a PET system integrated into the beam delivery system. With no geometric constrains associated with the beam delivery and patient positioning, a full-ring detector can be used for complete data collection and improved image quality. Although there is still a delay between treatment and PET scan, the gap is much shorter than in off-line PET, allowing the collection of abundant 15O signals. Complications caused by biological washout, repositioning errors, anatomical changes, etc., are also greatly reduced or eliminated. In particular, in-room PET is an economical option for most hospital-based proton centers that use a cyclotron for proton beam generation, because the beam is delivered continuously and no PET data collection is possible during the treatment. If a mobile united is invested, the PET scanner can also be shared with other applications if desired. However, since the PET scan needs to be acquired in the treatment room and the time required (including the moving of patient bed and the PET acquisition) is likely to be longer than with in-beam PET, the in-room PET has a relatively higher impact to the patient throughput in the treatment room.
The largest obstacle encountered in the first experience of in-room PET was the co-registration between PET images and the treatment planning CT scan. Because the planned dose (and therefore the predicted activity distributions to be discussed next) was on the CT grid, PET images must be registered with the treatment planning CT images for proper comparison. However, since only the proton irradiated region was activated, the co-registration was difficult without transmission images at the PET scan position. In the reported MGH studies the PET and CT were registered with concentric CT and PET fiducial markers. The co-registration errors range from 2 to 5 millimeters, adding uncertainties not only to the comparison between PET measurements and predictions, but also to the PET attenuation corrections because the attenuation map was generated from the treatment planning CT co-registered to the PET grid. A mobile PET/CT scanner will be available to MGH in the near future, which can be expected to significantly improve the performance of in-room PET.
Prediction of PET activity distributions
Reconstructed PET images must be compared with a reference for the treatment verification. Because proton dose and PET activity distributions are not directly related, treatment verification cannot be carried out by comparing these two distributions directly. Up to data two types of reference images have been used. In the clinical research conducted at HIMA, PET scan taken at an earlier treatment session was used as the reference images in fractionated therapy to confirm the activated volumes in later sessions [13]. In most other studies, PET measurements were compared with predicted PET activity distributions calculated with Monte Carlo simulations or analytical methods. The proposed approaches for the prediction of proton induced activity distributions are discussed.
Monte Carlo simulations
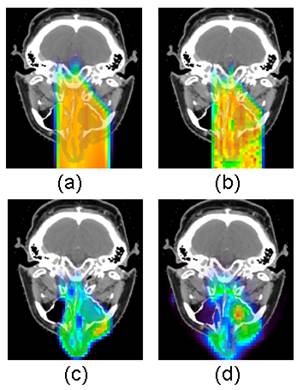
The predicted activity distributions are most often calculated with Monte Carlo simulations using open-source particle transportation packages such as Fluka[37], Geant4[38], SRIM[39] and MCNPX[40]. The simulations are based on the beam parameters and CT images from the treatment plans. Proton fluence at each voxel surface is first simulated, and then convolved with the different cross-section data sets for the main reaction channels and scaled with the target nuclide densities converted from CT images to obtain the distribution of each radionuclide species. Thus calculated distributions are then corrected for radioactive decay and biological washout, taking into consideration timing parameters such as the irradiation time, delay between treatment and scan, and scan duration. The corrected distributions of different radionuclide species are then summed up and blurred with a 3-D Gaussian convolution kernel to model the spatial resolution of the PET scanner. Figure 5 shows an example of Monte Carlo predicted and measured PET distributions in a nasal cavity melanoma clinical case. The spatial distribution of measured PET activity agreed well with the Monte Carlo prediction in this case.
A clinical example of Monte Carlo predicted and measured PET distributions in a nasal cavity melanoma clinical case. The 20-minute PET scan was taken on an in-room, stand-alone PET scanner after a 2-Gy fractionated proton dose delivery, with a 1.9 minute delay between the end of irradiation and the start of PET scan. (a) Treatment planning dose distribution; (2) Monte Carlo simulated dose distribution; (3), Monte Carlo simulated PET activity distribution; (d), PET measurement. The spatial distribution of measured PET activity agreed well with the Monte Carlo prediction in this case [41].
Uncertainties associated with Monte Carlo simulations arise from two major sources. The prediction relies on the proton fluence and energy distribution in each voxel, the nuclear reaction cross sections and the tissue density and elemental composition at the voxel level. One of the factors limiting the accuracy of PET activity prediction is the reliability of the cross section data for the relevant reaction channels. A variety of experimental values for cross sections of different reaction channels have been published, along with theoretical values. However, significant discrepancies have been found between data sets from different sources. Studies by Espana et al [42] indicated that range differences of up to 4.4 mm can be found by using different cross section data sets in certain cases. Another source of uncertainty is CT conversion algorithm, the same factor that also contributes significantly to range uncertainty in treatment planning at the first place. In the simulations treatment planning CT scans are converted to tissue type and density maps, from which elemental composition and target nuclide density are determined for each voxel. In addition to CT conversion, the accuracy of PET activity prediction is also affected by CT stochastic errors, artifacts, resolutions, etc. Espana et al [43] estimated that an intrinsic 1 mm uncertainty for PET range verification is due to CT conversion alone.
Analytical calculations
Despite the uncertainties associated with Monte Carlo simulations, it is still considered the most accurate approach for the prediction of proton induced PET activity distribution. However, considerable time and computing power are required for full-blown Monte Carlo simulations for each radiation field. Therefore, alternative analytical approaches have been explored for a simpler and more direct way to calculate PET activity distributions. Parodi et al [44] first proposed a filtering approach based on Gaussian-power law convolutions to reconstruct the local 11C distribution profile near the distal edge. The model described the one-dimensional 11C activity distribution as a convolution product of the planned dose with a small number of reaction-dependent filter functions. The filter function is based on a special  function defined as the convolution of a Gaussian with a powerlaw function. Good agreement was found between the results of the filtering approach and Monte Carlo simulations for simulation data in the distal fall-off. Attanasi et al [45] further extended the model for 3D activity distribution estimation, and included filter functions for other radionuclide species (15O et al) as well, so that the model can also be used for in-beam and in-room PET verifications. It was reported that in general the predicted activity distributions using the filtering approach were in good agreement (< 1 mm) with Monte Carlo simulation results, but the agreement was limited only to the distal region.
Another analytical method was proposed by Miyatake et al using an activity pencil beam (APB) algorithm [46]. The pencil beam algorithm is a standard algorithm of dose calculation in proton therapy. In APB, contributions of different positron emitters originated from the same target nuclide, such as 11C, 13N and 15O from 16O via reaction channels 16O (p, 3p3n) 11C, 16O (p, 2p2n) 13N and 16O (p, pn)15O respectively, are collectively represented as a 'virtual' positron emitter nuclide. The depth activity distribution of each virtual nuclide is measured experimentally. An activity pencil beam kernel is determined using depth and lateral (which is an effect of multiple Coulomb scattering) activity distributions measured for each of the three major 'virtual' nuclei, 12C, 16O and 40Ca. This kernel, combined with tissue composition information extracted from treatment planning CT images, is used for activity distribution calculation using a pencil beam algorithm similar to the one used in dose calculations in treatment planning. The algorithm being developed is expected to predict PET activity distributions with satisfying accuracy in a few minutes so that it can be incorporated into the clinical routine of treatment monitoring with an in-beam PET system. However, because the measured PET activity distribution contains mixed contributions from radionuclide with different half-lives, the PET measurements depend greatly on the time course of irradiation and data acquisition. These would require virtual nuclei activity distributions to be measured for different combinations of irradiation and delay times.
Biological washout
Regardless of the approach to be used for the prediction of the original PET activity production distribution, the effect of biological washout must be corrected as it can potentially change the activity distribution significantly. Biological washout of proton induced activity starts as soon as the irradiation begins. Although the off-line PET is the most severely affected, biological washout also cannot be ignored in the in-beam and in-room PET measurements. Unfortunately, up to date there is no dedicated model for the correction of biological washout in proton induced PET activity. The currently used washout model is based on animal study results using implanted radioactive or stable carbon beams [9, 19]. In this model, the original PET activity level in each voxel, estimated from Monte Carlo simulations or analytical calculations, is decomposed into three components undergoing fast, medium and slow biological decays. The tissue type in each voxel is also determined based on the Hounsfield Units in the treatment planning CT scan. Thresholds of Hounsfield units are set to identify five tissue types: hard bone, soft bone, fat, muscle and brain. Tissue-specific fractions and biological half-lives are assigned to each of the three components in each voxel. The final activity distribution is thus calculated based on the nuclide radioactive decay rate, assigned biological washout parameters and the time course of irradiation and PET acquisition.
There are many problems with this pre-defined biological washout model. First of all, the currently used model was adopted from carbon-beam study results [47, 48]. Its applicability to proton beam therapy is questionable because projectile fragmentation is the dominant contribution in carbon ion therapy, while only target fragmentation is possible in proton therapy [20]. Secondly, it does not account for varied washout rates of different radionuclide species, i.e. the same washout parameters are assigned for 11C and 15O for the same tissue type. Thirdly, the current model does not account for local variations, while in fact biological clearance rate is greatly affected by physiological environment such as local vasculature development and perfusion rate. In addition, many soft tissue types have very similar CT numbers but very different biological washout characters, while in the current model they are assigned the same washout parameters. On top of all the uncertainties, it is very difficult to obtain accurate biological washout parameters.
To overcome the limits with the current washout model, a kinetic modeling approach was proposed at MGH [49] and is currently under development. The method is based on the observation that 15O is the dominant contribution to PET measurements immediately after proton irradiation. Instead of using pre-defined biological clearance parameters, the model describes the production and elimination of the 15O distribution with a differential equation with two parameters, the production rate during the irradiation and the elimination rate (which is the sum of radioactive and biological clearance rates). The time-activity history obtained from dynamically reconstructed PET image data is then fitted with the model equation to estimate both the production and elimination rates simultaneously. A 15O production map can be produced by fitting the dynamic PET data voxel by voxel, and compared to the original 15O distribution production prediction directly. The kinetic approach does not rely on any arbitrary washout parameters, estimates both the activity production and washout rates of 15O, and the variations in biological washout rates are automatically taken into consideration. However, since 15O dominance is required, the method, if successful, would only be applicable to in-beam and in-room PET modalities.
Use of PET images for proton therapy verification
The measured PET images must be compared with reference images for treatment verification. Several approaches have been proposed and used for the use of PET images in proton therapy verification. In the in-beam PET studies at HIMA [13], a PET activity image was taken every day for fractionated therapy in 48 patients. The activity image of the first day of the treatment was used as a reference, of which the proton-irradiated volume was calculated. The volume was also analyzed for treatments of following days and compared with the reference. If a difference was detected, the causes would be investigated. If the changes were conformed to be due to tumor shrinkage or changes in body shapes, a new CT scan would be acquired and a new treatment plan would be used to replace the old plan. In this study, re-planning was performed for 3 clinical cases out of the 48 subjects.
While comparing proton irradiated volume at different treatment fractions is useful for the monitoring of the consistency of the treatments at different days, it does not provide information whether the actual delivered dose distributions deviate from the treatment plans. In order to detect possible errors in treatment planning, the measured PET images need to be compared with the predicted distributions in a proper way. Because the location of the highest energy deposition in proton therapy is largely determined by the proton range, current clinical research is focused on range verification. Two approaches have been used in the off-line studies at MGH. For the point-wise approach, range verification was performed by comparing the distal fall-off positions at 20% to 50% of the last local maximum in the depth-activity profiles between PET measurements and Monte Carlo predictions [9, 10]. For the shift approach, the range difference between two depth profiles was determined by shifting the normalized fall-off regions against each other to minimize the sum of absolute differences in the activity values [12, 31]. The analysis can be performed either on individual profiles or in the whole fall-off region. In the MGH off-line PET study of 23 subjects, the feasibility of range verification was found to be restricted to a limited amount of positions and tumor sites. The addressed factors contributing to the uncertainties in range verification include the reproducibility of off-line PET, biological washout effect (especially in soft tissue regions), Monte Carlo simulation accuracy, motions, beam arrangements, organ movements and co-registration accuracy. As a result, proton beam range can only be verified within an accuracy of 1~2 mm when the beam ends in low-perfused bony structures of head and neck patients. It was identified that intracranial and cervical spine patients, especially patients with arteriovenous malformations or metal implants, can greatly benefit from the approach [9, 12, 32].
Comparing distal fall-off depth is a simple yet very useful figure of merit for range verification. However, since the distal fall-off depth determination is closely associated with the shape of the activity profiles, both the point-wise and shift approaches depend greatly on the accuracy of the activity distribution predictions and measurements. Monte Carlo simulations are generally considered the most accurate approach for the prediction of proton induced activity distribution, but as discussed previously, there are many factors contributing to the uncertainties in simulations, especially for regions with highly heterogeneous tissue types having large variations in elemental compositions and biological washout rates. The accuracy of PET measurements is also a concern, especially for off-line PET. Differences of up to 30% were observed for repeated measurements on the same patient with the same treatment plan scanned one week apart, possibly due to statistical errors, variations in the elemental composition and changes in the biological washout rates at different days [12]. In cases of complicated distribution patterns in the distal region, the selection of the last local maximum is difficult and often subjective, which subsequently affects the distal fall-off position determination. A more robust method for range verification is very desirable.
In addition to range verification, direct dose verification with PET imaging is also actively pursued, which involves reconstructing radiation dose distributions from measured PET images. The method proposed by Fourkal et al [50] uses an analytical model to calculate positron-emitter species matrices (PESM) based on proton energy fluence distributions. Once the PESM is known, the radiation dose distribution in a patient is obtained from the deconvolution of the 3D PET activity distribution measurements with the PESM. The approach proposed by Remmele et al [51] is based on the filtering approach proposed by Parodi et al [44] and further extended by Attanasi et al [45], in which the expected PET images of activity distributions are calculated by the convolution of the planned dose with specific filter functions. As a reverse process, the estimated dose distribution during the treatment is calculated using deconvolution methods based on the PET images and appropriate filter functions. Since this deconvolution is an ill-posed inverse problem, regularization techniques are used to guarantee a stable solution. Both methods demonstrated feasibility with simulation and/or phantom data, but applying the dose reconstruction techniques on measured patient PET images remains a major challenge because of the degradation of image qualities by noise, artifacts and limited knowledge on biological washout effects.
Conclusions
PET imaging has been proved to be a valuable technique for the in vivo, in situ verification of proton therapy. The three operational modalities, in-beam, in-room and off-line, each has its advantages and disadvantages. Overall, in-room PET seems to be the cost-effective option for most hospital-based proton centers, except for treatment facilities with an off-line scanner available very close by. The performance of proton treatment verification with PET is affected not only by the PET data detecting systems used, but also by the methods used for data processing and interpretation. Additional work is desirable for more reliable criteria for range and/or delivered dose verification and for the development of an accurate biological washout model. Recently a second generation of dose delivery techniques, spot beam scanning, is slowly becoming commercially available to the proton therapy community. This poses new challenge to the treatment verification with PET, and new approaches need to be developed accordingly.
Competing Interests
The authors have declared that no competing interest exists.
References
1. DeLaney TF. Proton therapy in the clinic. Front Radiat Ther Oncol. 2011;43:465-85 doi:000322511 [pii] 10.1159/000322511
2. Paganetti H. Range uncertainties in proton therapy and the role of Monte Carlo simulations. Phys Med Biol. 2012;57:R99-117 doi:10.1088/0031-9155/57/11/R99
3. Yang M, Zhu XR, Park PC, Titt U, Mohan R, Virshup G. et al. Comprehensive analysis of proton range uncertainties related to patient stopping-power-ratio estimation using the stoichiometric calibration. Phys Med Biol. 2012;57:4095-115 doi:10.1088/0031-9155/57/13/4095
4. Lu HM. A point dose method for in vivo range verification in proton therapy. Phys Med Biol. 2008;53:N415-22 doi:S0031-9155(08)89105-1 [pii] 10.1088/0031-9155/53/23/N01
5. Gensheimer MF, Yock TI, Liebsch NJ, Sharp GC, Paganetti H, Madan N. et al. In vivo proton beam range verification using spine MRI changes. Int J Radiat Oncol Biol Phys. 2010;78:268-75 doi:S0360-3016(09)03634-7 [pii] 10.1016/j.ijrobp.2009.11.060
6. Smeets J, Roellinghoff F, Prieels D, Stichelbaut F, Benilov A, Busca P. et al. Prompt gamma imaging with a slit camera for real-time range control in proton therapy. Phys Med Biol. 2012;57:3371-405 doi:10.1088/0031-9155/57/11/3371
7. Min CH, Lee HR, Kim CH, Lee SB. Development of array-type prompt gamma measurement system for in vivo range verification in proton therapy. Med Phys. 2012;39:2100-7 doi:10.1118/1.3694098
8. Moteabbed M, Espana S, Paganetti H. Monte Carlo patient study on the comparison of prompt gamma and PET imaging for range verification in proton therapy. Phys Med Biol. 2011;56:1063-82
9. Parodi K, Paganetti H, Shih HA, Michaud S, Loeffler JS, DeLaney TF. et al. Patient study of in vivo verification of beam delivery and range, using positron emission tomography and computed tomography imaging after proton therapy. Int J Radiat Oncol Biol Phys. 2007;68:920-34 doi:S0360-3016(07)00377-X [pii] 10.1016/j.ijrobp.2007.01.063
10. Parodi K, Paganetti H, Cascio E, Flanz JB, Bonab AA, Alpert NM. et al. PET/CT imaging for treatment verification after proton therapy: a study with plastic phantoms and metallic implants. Med Phys. 2007;34:419-35
11. Parodi K, Enghardt W. Potential application of PET in quality assurance of proton therapy. Phys Med Biol. 2000;45:N151-6
12. Knopf A, Parodi K, Bortfeld T, Shih HA, Paganetti H. Systematic analysis of biological and physical limitations of proton beam range verification with offline PET/CT scans. Phys Med Biol. 2009;54:4477-95 doi:S0031-9155(09)12608-8 [pii] 10.1088/0031-9155/54/14/008
13. Nishio T, Miyatake A, Ogino T, Nakagawa K, Saijo N, Esumi H. The development and clinical use of a beam ON-LINE PET system mounted on a rotating gantry port in proton therapy. Int J Radiat Oncol Biol Phys. 2010;76:277-86 doi:S0360-3016(09)00921-3 [pii] 10.1016/j.ijrobp.2009.05.065
14. Nishio T, Ogino T, Nomura K, Uchida H. Dose-volume delivery guided proton therapy using beam on-line PET system. Med Phys. 2006;33:4190-7
15. Miyatake A, Nishio T, Ogino T, Saijo N, Esumi H, Uesaka M. Measurement and verification of positron emitter nuclei generated at each treatment site by target nuclear fragment reactions in proton therapy. Med Phys. 2010;37:4445-55
16. Maccabee HD, Madhvanath U, Raju MR. Tissue activation studies with alpha-particle beams. Phys Med Biol. 1969;14:213-24
17. Beebe WJ, Vaska P, Dilmanian F, Peggs S, Schlyer D. Simulation of proton therapy treatment verification via PET imaging of induced positron-emitters. IEEE Nuclear Science Symposium and Medical Imaging Conference (NSS/MIC) Conference Records. Portland, Oregon. 2003
18. Experimental Nuclear Reaction Data File: Energy Sciences and Technology Dept; BNL; 2010. EXFOR. http://wwwnndcbnlgov/nndc/exfor/
19. Parodi K, Bortfeld T, Haberer T. Comparison between in-beam and offline positron emission tomography imaging of proton and carbon ion therapeutic irradiation at synchrotron- and cyclotron-based facilities. Int J Radiat Oncol Biol Phys. 2008;71:945-56
20. Enghardt W, Parodi K, Crespo P, Fiedler F, Pawelke J, Ponisch F. Dose quantification from in-beam positron emission tomography. Radiother Oncol. 2004;73(Suppl 2):S96-8
21. Pawelke J, Enghardt W, Haberer T, Hasch BG, Hinz R, Kramer M. et al. In-beam PET imaging of the control of heavy-ion tumour therapy. IEEE Trans Nucl Sci. 1997;44:1492- 8 doi:10.1109/23.632694
22. Enghardt W, Crespo P, Fiedler F, Hinz R, Parodi K, J P. et al. Charged hadron tumour therapy monitoring by means of PET. Nucl Instrum Methods A. 2004;525:284-8
23. Iseki Y, Mizuno H, Futami Y, Tomitani T, Kanai T, Kanazawa M. et al. Positron camera for range verification of heavy-ion radiotherapy. Nucl Instrum Methods A. 2003;515:840-9 doi:doi:10.1016/j.nima.2003.07.005
24. Vecchio S, Attanasi F, Belcari N, Camarda M, Cirrone P, Cuttone G. et al. A PET prototype for in-beam monitoring of proton therapy. IEEE Nuclear Science Symposium. Honolulu, HI. 2007:24-362
25. Crespo P, Shakirin G, Fiedler F, Enghardt W, Wagner A. Direct time-of-flight for quantitative, real-time in-beam PET: a concept and feasibility study. Phys Med Biol. 2007;52:6795-811 doi:S0031-9155(07)48959-X [pii] 10.1088/0031-9155/52/23/002
26. Yamaya T, Inaniwa T, Yoshida E, Nishikido F, Shibuya K, Inadama N. et al. Simulation studies of a new 'OpenPET' geometry based on a quad unit of detector rings. Phys Med Biol. 2009;54:1223-33 doi:S0031-9155(09)87469-1 [pii] 10.1088/0031-9155/54/5/008
27. Yamaya T, Inaniwa T, Mori S, Furukawa T, Minohara S, Yoshida E. et al. Imaging simulations of an "OpenPET" geometry with shifting detector rings. Radiol Phys Technol. 2009;2:62-9 doi:10.1007/s12194-008-0046-x
28. Yamaya T, Yoshida E, Inaniwa T, Sato S, Nakajima Y, Wakizaka H. et al. Development of a small prototype for a proof-of-concept of OpenPET imaging. Phys Med Biol. 2011;56:1123-37 doi:S0031-9155(11)68904-X [pii] 10.1088/0031-9155/56/4/015
29. Yoshida E, Kinouchi S, Tashima H, Nishikido F, Inadama N, Murayama H. et al. System design of a small OpenPET prototype with 4-layer DOI detectors. Radiol Phys Technol. 2012;5:92-7 doi:10.1007/s12194-011-0142-1
30. Tashima H, Yamaya T, Yoshida E, Kinouchi S, Watanabe M, Tanaka E. A single-ring OpenPET enabling PET imaging during radiotherapy. Phys Med Biol. 2012;57:4705-18 doi:10.1088/0031-9155/57/14/4705
31. Knopf A, Parodi K, Paganetti H, Cascio E, Bonab A, Bortfeld T. Quantitative assessment of the physical potential of proton beam range verification with PET/CT. Phys Med Biol. 2008;53:4137-51 doi:S0031-9155(08)73119-1 [pii] 10.1088/0031-9155/53/15/009
32. Knopf AC, Parodi K, Paganetti H, Bortfeld T, Daartz J, Engelsman M. et al. Accuracy of Proton Beam Range Verification Using Post-Treatment Positron Emission Tomography/Computed Tomography as Function of Treatment Site. Int J Radiat Oncol Biol Phys. 2011; doi:S0360-3016(10)00251-8 [pii] 10.1016/j.ijrobp. 2010 02.017
33. Nishio T, Miyatake A, Inoue K, Gomi-Miyagishi T, Kohno R, Kameoka S. et al. Experimental verification of proton beam monitoring in a human body by use of activity image of positron-emitting nuclei generated by nuclear fragmentation reaction. Radiol Phys Technol. 2008;1:44-54
34. Hsi W, Indelicato DJ, Vargas C, Duvvuri S, Li Z, Palta J. In vivo verification of proton beam path by using post-treatment PET/CT imaging. Med Phys. 2009;36:4136-46
35. Combs SE, Bauer J, Unholtz D, Kurz C, Welzel T, Habermehl D. et al. Monitoring of patients treated with particle therapy using positron-emission-tomography (PET): the MIRANDA study. BMC Cancer. 2012;12:133. doi:1471-2407-12-133 [pii] 10.1186/1471-2407-12-133
36. Zhu X, Espana S, Daartz J, Liebsch N, Ouyang J, Paganetti H. et al. Monitoring proton radiation therapy with in-room PET imaging. Phys Med Biol. 2011;56:4041-57 doi:S0031-9155(11)81726-4 [pii] 10.1088/0031-9155/56/13/019
37. Parodi K, Ferrari A, Sommerer F, Paganetti H. Clinical CT-based calculations of dose and positron emitter distributions in proton therapy using the FLUKA Monte Carlo code. Phys Med Biol. 2007;52:3369-87 doi:S0031-9155(07)38453-4 [pii] 10.1088/0031-9155/52/12/004
38. Pshenichnov I, Mishustin I, Greiner W. Distributions of positron-emitting nuclei in proton and carbon-ion therapy studied with GEANT4. Phys Med Biol. 2006;51:6099-112 doi:S0031-9155(06)29938-X [pii] 10.1088/0031-9155/51/23/011
39. Tuckwell W, Bezak E. Calculation of the positron distribution from 15O nuclei formed in nuclear reactions in human tissue during proton therapy. Phys Med Biol. 2007;52:2483-98 doi:S0031-9155(07)25841-5 [pii] 10.1088/0031-9155/52/9/010
40. Seravalli E, Robert C, Bauer J, Stichelbaut F, Kurz C, Smeets J. et al. Monte Carlo calculations of positron emitter yields in proton radiotherapy. Phys Med Biol. 2012;57:1659-73 doi:10.1088/0031-9155/57/6/1659
41. Min CH, Zhu X, Winey BA, Grogg K, Testa M, El Fakhri G. et al. Clinical application of in-room positron emission tomography for in vivo treatment monitoring in proton radiation therapy. Int J Radiat Oncol Biol Phys. 2013;86:183-9 doi:S0360-3016(12)03906-5 [pii] 10.1016/j.ijrobp.2012.12.010
42. Espana S, Zhu X, Daartz J, El Fakhri G, Bortfeld T, Paganetti H. The reliability of proton-nuclear interaction cross-section data to predict proton-induced PET images in proton therapy. Phys Med Biol. 2011;56:2687-98 doi:S0031-9155(11)81703-3 [pii] 10.1088/0031-9155/56/9/003
43. Espana S, Paganetti H. The impact of uncertainties in the CT conversion algorithm when predicting proton beam ranges in patients from dose and PET-activity distributions. Phys Med Biol. 2010;55:7557-71
44. Parodi K, Bortfeld T. A filtering approach based on Gaussian-powerlaw convolutions for local PET verification of proton radiotherapy. Phys Med Biol. 2006;51:1991-2009
45. Attanasi F, Knopf A, Parodi K, Paganetti H, Bortfeld T, Rosso V. et al. Extension and validation of an analytical model for in vivo PET verification of proton therapy--a phantom and clinical study. Phys Med Biol. 2011;56:5079-98 doi:S0031-9155(11)72186-8 [pii]. 10.1088/0031-9155/56/16/001
46. Miyatake A, Nishio T, Ogino T. Development of activity pencil beam algorithm using measured distribution data of positron emitter nuclei generated by proton irradiation of targets containing (12)C, (16)O, and (40)Ca nuclei in preparation of clinical application. Med Phys. 2011;38:5818-29 doi:10.1118/1.3641829
47. Mizuno H, Tomitani T, Kanazawa M, Kitagawa A, Pawelke J, Iseki Y. et al. Washout measurement of radioisotope implanted by radioactive beams in the rabbit. Phys Med Biol. 2003;48:2269-81
48. Tomitani T, Pawelke J, Kanazawa M, Yoshikawa K, Yoshida K, Sato M. et al. Washout studies of 11C in rabbit thigh muscle implanted by secondary beams of HIMAC. Phys Med Biol. 2003;48:875-89
49. Zhu X, Alpert NM, Min CH, Normandin M, Paganetti H, Bortfeld T. et al. Verification of proton therapy with PET: A kinetic modeling approach. J Nucl Med. 2012;53:264
50. Fourkal E, Fan J, Veltchev I. Absolute dose reconstruction in proton therapy using PET imaging modality: feasibility study. Phys Med Biol. 2009;54:N217-28 doi:S0031-9155(09)01942-3 [pii]. 10.1088/0031-9155/54/11/N02
51. Remmele S, Hesser J, Paganetti H, Bortfeld T. A deconvolution approach for PET-based dose reconstruction in proton radiotherapy. Phys Med Biol. 2011;56:7601-19 doi:S0031-9155(11)85764-7 [pii] 10.1088/0031-9155/56/23/017
Author contact
![]() Corresponding author: Georges El Fakhri, White 427, 55 Fruit Street, Boston, MA 02114. Email: elfakhrimgh.harvard.edu Phone: (617) 726-9640 Fax:(617) 726-6165.
Corresponding author: Georges El Fakhri, White 427, 55 Fruit Street, Boston, MA 02114. Email: elfakhrimgh.harvard.edu Phone: (617) 726-9640 Fax:(617) 726-6165.