Theranostics
13.3
Impact Factor
 Global reach, higher impact
Theranostics 2012; 2(12):1140-1159. doi:10.7150/thno.4305 This issue Cite
Review
Bursting Bubbles and Bilayers
Steven P. Wrenn1 ![]() , Stephen M. Dicker1, Eleanor F. Small1, Nily R. Dan1, Michał Mleczko2, Georg Schmitz2, Peter A. Lewin3
, Stephen M. Dicker1, Eleanor F. Small1, Nily R. Dan1, Michał Mleczko2, Georg Schmitz2, Peter A. Lewin3
1. Drexel University, Department of Chemical and Biological Engineering, 3141 Chestnut Street, Philadelphia, PA 19104, USA.
2. Lehrstuhl für Medizintechnik, Universitätsstr. 150, Ruhr-Universität Bochum, 44801 Bochum, GERMANY.
3. Drexel University, School of Biomedical Engineering, Science & Health Systems, 3141 Chestnut Street, Philadelphia, PA 19104, USA.
Received 2012-2-29; Accepted 2012-6-18; Published 2012-12-11
Citation:
Wrenn SP, Dicker SM, Small EF, Dan NR, Mleczko M, Schmitz G, Lewin PA. Bursting Bubbles and Bilayers. Theranostics 2012; 2(12):1140-1159. doi:10.7150/thno.4305. https://www.thno.org/v02p1140.htm
Other stylesAbstract
This paper discusses various interactions between ultrasound, phospholipid monolayer-coated gas bubbles, phospholipid bilayer vesicles, and cells. The paper begins with a review of microbubble physics models, developed to describe microbubble dynamic behavior in the presence of ultrasound, and follows this with a discussion of how such models can be used to predict inertial cavitation profiles. Predicted sensitivities of inertial cavitation to changes in the values of membrane properties, including surface tension, surface dilatational viscosity, and area expansion modulus, indicate that area expansion modulus exerts the greatest relative influence on inertial cavitation. Accordingly, the theoretical dependence of area expansion modulus on chemical composition - in particular, poly (ethylene glyclol) (PEG) - is reviewed, and predictions of inertial cavitation for different PEG molecular weights and compositions are compared with experiment. Noteworthy is the predicted dependence, or lack thereof, of inertial cavitation on PEG molecular weight and mole fraction. Specifically, inertial cavitation is predicted to be independent of PEG molecular weight and mole fraction in the so-called mushroom regime. In the “brush” regime, however, inertial cavitation is predicted to increase with PEG mole fraction but to decrease (to the inverse 3/5 power) with PEG molecular weight. While excellent agreement between experiment and theory can be achieved, it is shown that the calculated inertial cavitation profiles depend strongly on the criterion used to predict inertial cavitation. This is followed by a discussion of nesting microbubbles inside the aqueous core of microcapsules and how this significantly increases the inertial cavitation threshold. Nesting thus offers a means for avoiding unwanted inertial cavitation and cell death during imaging and other applications such as sonoporation. A review of putative sonoporation mechanisms is then presented, including those involving microbubbles to deliver cargo into a cell, and those - not necessarily involving microubbles - to release cargo from a phospholipid vesicle (or reverse sonoporation). It is shown that the rate of (reverse) sonoporation from liposomes correlates with phospholipid bilayer phase behavior, liquid-disordered phases giving appreciably faster release than liquid-ordered phases. Moreover, liquid-disordered phases exhibit evidence of two release mechanisms, which are described well mathematically by enhanced diffusion (possibly via dilation of membrane phospholipids) and irreversible membrane disruption, whereas liquid-ordered phases are described by a single mechanism, which has yet to be positively identified. The ability to tune release kinetics with bilayer composition makes reverse sonoporation of phospholipid vesicles a promising methodology for controlled drug delivery. Moreover, nesting of microbubbles inside vesicles constitutes a truly “theranostic” vehicle, one that can be used for both long-lasting, safe imaging and for controlled drug delivery.
Keywords: ultrasound, cavitation, sonoporation, microbubble, liposome, membrane.
Introduction
This paper reviews ultrasound-induced inertial cavitation of phospholipid-coated microbubbles and ultrasound-induced sonoporation of phospholipid bilayers. In addition to the ultrasound wave, the common link between these two phenomena is the presence of a phospholipid membrane. Moreover, inertial cavitation of microbubbles is one putative mechanism by which sonoporation of phospholipid bilayers is believed to occur. Accordingly, a central theme of the paper is how phospholipid membrane properties influence acoustic phenomena. The paper describes, via a combination of experiment and mathematical modeling, how membrane material properties (in particular, the area expansion modulus, KA, but also curvature, surface tension, and surface dilatational viscosity) influence the inertial cavitation threshold pressure. This is followed by a discussion of the influence of nesting one or more microbubbles inside the aqueous core of a polymeric microcapsule, which significantly inhibits inertial cavitation and prevents cell death when inertial cavitation does occur. Inertial cavitation is then discussed in the context of sonoporation, along with other putative mechanisms believed to account for ultrasound-induced pore formation in phospholipid bilayers. This is followed by a description of how the kinetics of sonoporation correlate with bilayer phase behavior, suggesting the possibility that sonoporation can be used to control the rate of drug release from phospholipid vesicles. The phrase “reverse sonoporation” is used to describe ultrasound-induced release of drug from a liposome and to distinguish this from traditional sonoporation, in which microbubbles are used to deliver cargo into a cell. Reverse sonoporation gives one the ability to control when, where, and how fast drug is released. Taken together, nesting of microbubbles inside phospholipid vesicles constitutes a “theranostic” vehicle that can be used for both long-lasting, safe imaging and for controlled drug delivery.
Inertial Cavitation
Background
The use of coated microbubbles as ultrasound contrast agents (UCAs) for enhancement of ultrasonic images is well known and has gone through several generations of development.[1, 2] Early UCAs, now considered first-generation agents, comprised air plus a shell of albumin, lipid, or acrylate; second-generation agents replaced air with heavier, fluorinated compounds (e.g., octafluoropropane, perfluorobutane, or sulfur hexafluoride) that dissolve more slowly; and third-generation agents incorporated additional species (e.g., charged surfactants or PEGylated lipids) into the stabilizing shell to prevent bubble coalescence and convey stealth quality so as to prolong circulation time.[3] It is now appreciated that a phospholipid monolayer coating provides reasonable longevity without sacrificing too greatly the acoustic response, and the fact that phospholipid composition and microstructure can influence microbubble material properties and resulting acoustic phenomena is widely recognized.[4-9]
The popularity of UCAs for imaging has spawned additional applications for coated microbubbles, including drug delivery and gene therapy. Targeted delivery is achieved by incorporation of ligands into the microbubble shell to facilitate binding to specific receptors, analogous to avidin-biotin binding, in the body. [10-13] Microbubbles are attractive for gene therapy applications because insonification of microbubbles in close proximity to cells causes transient opening of cell membranes, a process known as sonoporation, thereby permitting delivery of cargo into the cell.[14-18] Investigations into sonoporation phenomena suggest strongly that the transport mechanism involves temporary pore formation (hence the name). Although inertial cavitation is expected to play a role in forming the pores, the detailed mechanism has yet to be fully explained.[19-24]
Safety Considerations
A significant challenge faced when using microbubbles for imaging, drug delivery, and sonoporation applications is that the microbubbles can undergo inertial cavitation, leading to cell death and tissue damage.[25-27] The fact that inertial cavitation can have deleterious effects dates back to at least 1917 with Langevin's observation of fish dying immediately upon being placed near an ultrasound source.[28] Safety concerns relating to inertial cavitation-induced cell death and tissue damage are today well recognized,[26, 29-31] and the clinical importance of avoiding inertial cavitation is evidenced by the adoption in 1993 of a so-called mechanical index (MI) by the US Food and Drug Administration (FDA).[32] The MI was developed as a predictor of cavitation in vivo, [33] and the FDA set a regulatory limit in 1997 that the MI must be maintained below a value of 1.9.[28] The use of MI points plainly to a lack of fundamental understanding of inertial cavitation of UCAs. As articulated by O'Brien, “…It is unfortunate that the MI has become the UCA exposure quantity…the MI is an exposure quantity available to system operators… but the science is weak…”[28]
O'Brien appears to be referring to the science of inertial cavitation of externally added, coated microbubbles, as the theory of cavitation for intrinsic, uncoated bubbles (i.e., those generated by nucleation of dissolved gas or vaporization of liquid), is well established,[34, 35] as is the experimental methodology for measuring inertial cavitation in vitro.[36] It is only recently that inertial cavitation of UCAs has been considered. In particular, the O'Brien group has measured inertial cavitation of the commercially available contrast agents OptisonTM[37, 38] and Definity®.[39, 40]
Much more needs to be done, both to enable UCAs to reach their full potential without sacrificing safety and to put new microbubble applications, which seek to take advantage of inertial cavitation, on a sound scientific footing. For example, microbubbles are being examined as inertial cavitation nuclei to increase control and precision during focused ultrasound surgery (FUS) and avoid unwanted tissue ablation.[3, 41, 42] Inertial cavitation is also being pursued as a mechanism for controlled release of drugs. In particular, microbubbles are co-encapsulated with drugs inside a vesicle or microcapsule where the drug has little-to-no (side) effect. Drug is released on command using ultrasound as a remote-mechanical trigger to induce inertial cavitation of the microbubbles; the ensuing shock wave then cracks the microcapsule (or forms pores in the vesicle) shell.[43, 44]
What is needed now is a fundamental understanding of what sets the inertial cavitation threshold of lipid-coated microbubbles. Such information requires systematic investigations in which the lipid coating material properties are carefully controlled by changes in chemical composition, but such systematic studies are lacking. We recently performed a preliminary study of inertial cavitation of non-commercial, lipid-coated microbubbles.[45] We build on those preliminary investigations herein.
Theory
Clean Bubbles
A fundamental understanding of inertial cavitation requires a mathematical model that accurately describes the physics of lipid coated microbubbles upon exposure to ultrasound. Modeling of a lipid-coated microbubble begins with an analysis of the way a clean (that is, lacking a surface coating) microbubble responds to ultrasound. This, in turn, begins with the analysis of how a cavity (no gas) collapses in a fluid. Rayleigh was one of the first to study this problem (in 1917), followed by Plesset (in 1949).[46] Following on the efforts of Rayleigh and Plesset, the collapse of gas bubbles in the presence of a sound field was first examined by Blake (in 1949) and by Noltingk and Neppiras (in 1950).[46] In simple terms, each of these authors viewed the problem as an energy balance, which can be stated in words as:
Work done by bubble = Kinetic energy gained by surrounding liquid (i)
or, mathematically, as
(1)
where Ro is resting bubble radius, R is dynamic bubble radius, r is radial position in the surrounding fluid,  is fluid radial velocity, PL is the pressure in the liquid just outside the bubble, and P∞ is pressure infinitely far away from the bubble. Eqn (1) can be re-written in the form
(2)
where  and
and  denote bubble wall velocity and bubble wall acceleration, respectively. Note that eqn (2) does not include a viscosity term. Poritsky was the first to consider (or discover) the effect of viscosity (in 1952); rather than viewing the problem as an energy balance, Poritsky viewed the problem from a fluid mechanics perspective (i.e., mass plus momentum balances) and found that the influence of bulk liquid viscosity, η, enters through the boundary condition when solving the Navier-Stokes equation.[34] Poritsky's solution was
(3)
In view of Poritsky's viscosity contribution one sees that the energy balance (i) can be amended as
Work done by bubble - Energy lost to viscous dissipation = Kinetic energy gained by surrounding liquid (ii)
Recognizing that a Laplace pressure exists across the gas-liquid interface, such that the internal gas pressure equals PL plus the quantity 2σ/R, where σ is surface tension, and that the term PVγ is a constant for the gas, enables one to write PL as a function of initial and dynamic radius as
(4)
The value of γ, the polytropic index, equals unity for isothermal processes (no heat flow restrictions) and equals the ratio of the heat capacity of the gas at constant pressure to that at constant volume for adiabatic processes (no heat transfer). Neither extreme is likely to hold during insonation, and the value of γ might not be constant during a single ultrasound cycle or upon inertial cavitation.[34]
Modifications to RPNNP
Taking the RPNNP equation as a starting point, numerous efforts have been made to account for the influence of a coating at the gas/liquid interface. For example, de Jong et al. in 1992 introduced a shell parameter, Sshell, which they related to a bulk property, namely Young's modulus (E).[47] de Jong and Hoff followed this a year later by replacing Sshell with a new elasticity parameter, SP, and adding a new term, Sf, which they named the “shell friction.”[48] Three years later Hoff and Hoff described a new approach, implementing the Kelvin-Voigt model for viscoelastic solids to describe the coating in terms of the bulk modulus, K, and the volume viscosity, μK.[49]
Frinking and de Jong revisited the problem in 1998, invoking a new friction parameter, SF, to describe the viscosity of the shell and a new elasticity parameter, Keff.[50] A different approach was taken by Doinikov and Dayton, who used the Lagrangian equations to solve the bubble energy balance, including dissipation effects.[51] Doinikov and Dayton's solution is equivalent to that of de Jong and Hoff with Sp being proportional to the product of coating thickness and bulk modulus and with Sf being proportional to the product of coating thickness and bulk viscosity.[51] Another approach that takes into account the presence of a coating is that of Church.[52]
Other investigators have modified the RPNNP equation by challenging the assumption that the liquid surrounding the bubble is incompressible. Specifically, Herring contends that this assumption is tantamount to claiming that the speed of sound in water is infinite and is therefore incorrect; as discussed by Vokurka [53], Herring offers an alternative approach that treats the speed of sound as a constant. The Herring equation reads
(5)
where c is the speed of sound in water and  is the time derivative of the pressure just outside the bubble. As is the case for developers of the RPNNP equation, Herring did not address the influence of a coating at the gas-water interface. Accordingly, attempts have been made to modify the Herring equation to describe the influence of a lipid coating on the bubble dynamics. Perhaps the most well known modification of the Herring equation is the model proposed by Morgan et al.[54]
The Morgan modification of the Herring equation, which describes the monolayer in terms of two parameters, χ and μsh, has enjoyed widespread use. Chatterjee and Sarkar took a somewhat different approach, building on rheological models that describe biological membranes and fluid interfaces with adsorbed surfactants and proteins, and wrote a Rayleigh-Plesset type equation that involves the surface dilatational viscosity, κs.[55] The surface dilatational viscosity, which is rigorously defined for interfacial systems, [55-59] was later used by Marmottant et al., who put forth a model to account for the fact that surface tension increases with area per (surfactant) molecule.[60-63] Rather than using a single value for surface tension, Marmottant et al. treat surface tension as a discontinuous function; depending on bubble radius, they set surface tension equal to one of two different constants or make surface tension proportional to χ. In this way, the Marmottant et al. model accounts for a variety of microbubble phenomena, including buckling and rupture.
As they did with modifications of the RPNNP equation, Doinikov and Dayton re-worked the Herring equation to include coating effects and present a solution that is equivalent to the Marmottant et al. model with χ being proportional to the product of coating thickness and bulk modulus and κs being proportional to the product of coating thickness and bulk viscosity.
The foregoing discussion is not exhaustive, and a review of the topic is available.[64] Noteworthy among the works involving bubble coatings is the work of Glazman, who describes adsorption of surface-active agents in the context of the Gibbs adsorption isotherm and relates elastic properties to changes in surface tension that arise from changes in surface concentration of adsorbed molecules. Also noteworthy is the work of Sarkar et al., who first consider the influence of a constant surface dilatational elasticity [65] and later compare the constant elasticity model with two varying elasticity models.[66]
Area Expansion Modulus
Building on these prior works, we introduce below a modified Herring equation that is written in terms of the area expansion modulus, KA, defined as
(6)
where G is the Gibbs free energy, ns is the number of surfactant molecules in the monolayer, and A is the area of the monolayer. Given that surface tension is the first derivative of Gibbs free energy with respect to area, KA is a membrane property that describes how surface tension varies with area. Prior models involved the area expansion modulus, which goes by other names[65, 66]; the choice of the name area expansion modulus, and the symbol KA, is made here to be consistent with experimental investigations.
A key point of relevance herein is that KA is measurable.[61] Indeed, to write a bubble model in terms of KA we appeal to micropipette experiments used to measure the area expansion modulus and recognize that an externally applied modulation to the thermodynamic pressure, ΔP, places the membrane under tension, τ.[67, 68] A similar tension arises due to microbubble expansion caused by application of ultrasound, with τ = -(1/2)ΔP·R. By definition, KA = τ/α, where α is the strain caused by the applied tension and equals the change in area divided by the initial area, or (R2-Ro2)/Ro2. Algebra then gives the result
(7)
We note that this result is equivalent to an expression that accounts for the influence of dilatational surface elasticity, ES, in a viscoelastic interfacial rheological model derived previously by Sarkar et al.[65]
By returning to the original Herring equation and following the approach of Marmottant et al., by expressing the influence of area expansion modulus via eqn (7), and by invoking the result of Chatterjee and Sarkar to capture the influence of surface dilatational viscosity, one arrives at a bubble physics model written in terms of KA. Eqn (iii) describes the model in words, and eqn (8) is the mathematical result obtained by solving the energy balance.
(iii)
(8)
Eqn (8) describes the influence of a coating using three membrane properties, each of which can be measured. Accordingly, eqn (8) could potentially be used to make predictions about microbubble behavior, which would be useful if the dependence of the material properties on microbubble composition were known (and bearing in mind that KA values measured under quasi-static conditions might not necessarily be applicable to the transient conditions that arise upon application of ultrasound). For example, the way in which KA varies with poly(ethylene glycol) PEG molecular weight and mole fraction is well described. [69-72] This information could potentially be used to design microbubbles in a rational way with eqn (8), simply by changing the molecular weight or amount, or both, of PEG in the microbubble lipid coating to achieve a desired value of KA.
In particular, PEG displays two different concentration regimes, each with different physical characteristics, known as the “mushroom” and the “brush.”[73-75] The mushroom and brush regimes, which are set by the local PEG mole fraction, exhibit markedly different dependencies of PEG chain density on PEG mole fraction and molecular weight; as a result, the two PEG regimes exhibit markedly different dependencies of area expansion modulus on PEG mole fraction and PEG molecular weight.[76]
To understand how PEG influences cavitation one must recognize that the local mole fraction of PEG in a microbubble monolayer does not equal the PEG mole fraction in the starting lipid mixture from which the microbubble is formed; this is because lipid species with a stronger affinity for the monolayer, or with a smaller energetic penalty due to localization within the monolayer, are represented in the monolayer at a higher fraction than in the initial mixture.[76] Furthermore, the extent to which the local, monolayer PEG mole fraction differs from the PEG mole fraction in the starting lipid mixture depends on the PEG regime. As a result, the mushroom and brush regimes give rise to different surface PEG chain densities, σm and σb (PEG chains per area), respectively, within the microbubble monolayer:
(9a)
(9b)
where Xo is the concentration of PEG chains in the mixture, Eads is the adsorption energy per polymer chain (normalized by kT) and N is the number of freely rotating polymer segments; for PEG the molecular weight (MW) of a segment is 44 g/mol such that N = MW/44.[77]
Using the definition of KA in eqn (6) and recognizing that in the case of a dilute mushroom layer the energy of the polymer is independent of chain density it becomes clear that KA is independent of PEG molecular weight and composition in the mushroom regime and thus equals KA,o, the area expansion modulus of the lipid monolayer in the absence of PEG, eqn (10a). In the brush regime, on the other hand, chains overlap such that one obtains eqn (10b).
Mushroom:(10a)
Brush:(10b)
Thus, KA increases in the brush regime as one increases PEG mole fraction, which might seem obvious. Perhaps counter-intuitively, KA decreases with PEG molecular weight. It is quite conceivable that an increase in PEG molecular weight would make the monolayer stiffer - for a given mole fraction of PEG within the monolayer. However, an increase in molecular weight makes incorporation of PEG into the monolayer more difficult such that the net effect is a predicted decrease in KA with increasing (inverse 3/5 power of) PEG molecular weight for a given overall mole fraction of PEG within the system. Figure 1 summarizes these ideas.
Figure 1
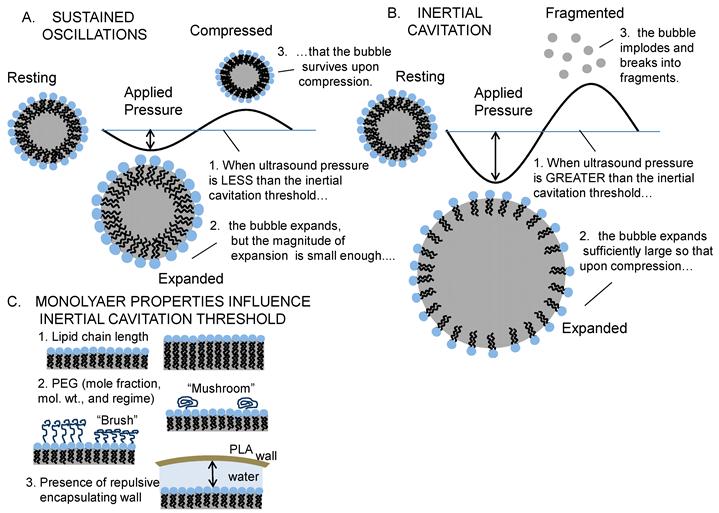
Inertial Cavitation of Lipid-Coated Microbubbles: Ultrasound causes lipid-coated microbubbles to expand and contract. If the pressure is below a critical value, called the inertial cavitation threshold, then the bubble undergoes sustained oscillations (A). If the pressure is above the inertial cavitation threshold, then inertial forces govern the collapse; this is typically associated with the bubble imploding and breaking into small fragments (B). The inertial cavitation threshold pressure depends on the material properties of the lipid coating (e.g., area expansion modulus and surface tension), which are set by the monolayer composition (lipid chain length and PEG mol. wt. & regime - brush vs. mushroom), and on the presence of a PLA microcapsule and distance to the PLA wall (C).
Predicting Inertial Cavitation Thresholds
While certainly a significant step forward, writing a bubble physics model in terms of KA is not the end of the story. This is because of the inherent inability of any bubble model, regardless of its accuracy, to predict inertial cavitation. The bubble models merely describe the magnitude of the microbubble oscillations as a function of time; no single criterion has been established that identifies, unequivocally, when a microbubble will undergo inertial cavitation. Indirect attempts have been made by defining a critically expanded radius in terms of the resting radius. For clean bubbles, cavitation has been said to occur when the bubble expands to twice the resting radius[78]. Others claim cavitation does not occur unless or until the bubble expands to 2.3 times the resting radius.[79] The origin of relative expansion as a criterion for inertial cavitation stems from Flynn's decomposition of the bubble acceleration into two terms, an inertial function (IF) and pressure function (PF), and the identification of the ratio of the maximal bubble radius to the resting radius at which the IF intersects the PF as the critical normalized maximal radius, (Rmax/Ro)c. Strictly speaking, inertial cavitation occurs when inertial forces control the collapse, and this occurs when (Rmax/Ro) exceeds (Rmax/Ro)c; practically speaking, this occurs when R/Ro ranges from 2 - 3 for clean bubbles and higher values for coated bubbles.[34, 78, 80] O'Brien et al. find that the amount of expansion required for inertial cavitation of commercial contrast agents varies from 3.4 to 8.0 times the resting radius.[40]
Figure 2 shows the prediction methodology and the influence of the inertial cavitation criterion. First, eqn (8) is used to calculate the dynamic bubble radius and generate a “radius-time” plot, in which the quantity (R/Ro) is given as a function of time. Four such radius-time plots are shown, each for a different applied ultrasound pressure (50, 200, 500, and 1000 kPa) and for an initial resting radius of 1 micrometer; the greater the pressure, the greater the magnitude of the oscillations. Next, the radius-time plots are analyzed against a criterion for inertial cavitation so as to determine whether inertial cavitation has occurred. If the microbubble populations were monodisperse, then this would be the end of the analysis; one would simply find the pressure at which inertial cavitation occurs.
Figure 2
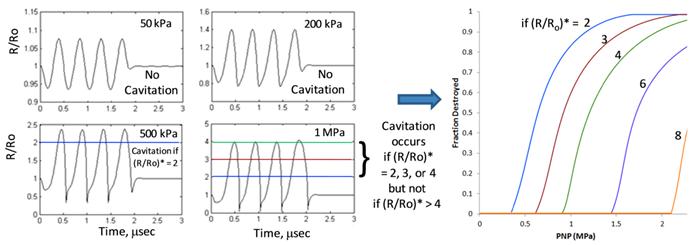
Predicted Cavitation Destruction Profiles: We use eqn (8) to predict the magnitude of microbubble oscillations as a function of time for a specified value of the area expansion modulus, KA (as well as other material properties) and for a specified ultrasound pressure (KA = 50 mN/m, σ = 51 mN/m, and κs = 7 x 10 -6 sP) . The result is a “radius-time” plot, in which the ratio of radius to resting radius (R/Ro) is plotted versus insonification time. Four radius-time plots are shown for four different ultrasound peak negative pressures (0.05, 0.2, 0.5, and 1.0 MPa), each exhibiting a different maximal value of R/Ro (~1.1, 1.4, 2.3, and 4.1, respectively). Such information can be used to predict cavitation destruction profiles if one specifies a critical value, (R/Ro)*, at which cavitation occurs; that is, cavitation is predicted to occur only when the maximal value of (R/Ro) in the radius time plot exceeds (R/Ro)*. For example, if (R/Ro)* is 2, then cavitation is not predicted to occur at 50 kPa or 200 kPa but is predicted to occur at 500 kPa and 1 MPa. If (R/Ro)* is 3 or 4 (or strictly speaking, anywhere in the range 2.5 - 4.1 as (R/Ro)* need not be a whole number), then cavitation is predicted to occur at 1 MPa but not at the lower pressures. If (R/Ro)* is greater than 4.1, then cavitation is not predicted to occur at any of the four pressures shown; cavitation would require a pressure greater than 1 MPa. Generating radius-time plots for a large number of pressures leads to the predicted cavitation destruction profiles shown in the rightmost panel. Predictions are shown for (R/Ro)* values in the range 2 - 8. Given that the ultrasound frequency is fixed (here, 2.25 MHz), a single (R/Ro)* value will translate to different microbubble wall velocities for different resting radii (Ro). It is therefore unlikely that inertial cavitation can be predicted using a single value of (R/Ro)*; alternatively, one could potentially use microbubble wall velocity, rather than (R/Ro)*, as a criterion for predicting inertial cavitation (see Fig. 3).
Figure 3
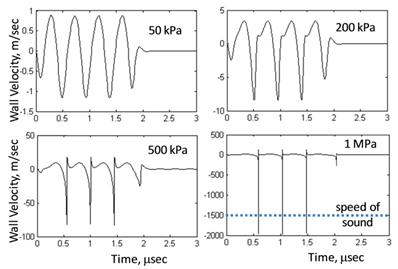
Microbubble Wall Velocity: Eqn (8) is used to plot microbubble wall velocity, rather than radius (as was done in Fig. 2), versus time. Conditions are the same as in Figure 2 (material properties are fixed: KA = 50 mN/m, σ = 51 mN/m, and κs = 7 x 10⁻⁶ sP at four different pressures: 50, 200, 500, and 1000 kPa). Analogous to a critical bubble expansion, (R/Ro)*, one could define a critical microbubble wall velocity relative to the speed of sound  *, as a predictor of inertial cavitation. Note that the microbubble wall velocity exceeds the speed of sound only at a pressure of 1 MPa. If the criterion for cavitation were
  * = 1, then cavitation would occur at 1 MPa but not at the lower pressures.
However, most microbubble formulations are not monodisperse. In such situations, one must generate a “cavitation destruction profile,” in which the fraction of bubbles destroyed by inertial cavitation is plotted as a function of ultrasound (peak negative) pressure (PNP). To generate an inertial cavitation destruction profile, one repeats the above analysis for a wide range of initial resting radii and records the inertial cavitation pressure for each initial resting radius (typically, a plot of inertial cavitation versus initial radius will display a minimum, although this will depend on driving frequency[35]). One then compares this result with the size distribution of a given microbubble population; the size distribution is easily measured for experimental samples or can simply be specified for the purpose of simulations. At a given pressure, the fraction of microbubbles in the population whose inertial cavitation threshold pressure was calculated to be less than the prevailing pressure is recorded, and this process is repeated over a wide range of pressures; results are plotted as the fraction of bubbles destroyed versus applied pressure. Such graphs, or inertial cavitation destruction profiles, reflect the fact that the microbubble populations are not monodisperse; if they were mondisperse, then inertial cavitation would occur at a single pressure, and the inertial cavitation destruction profile would appear as a step function. As the pressure required for inertial cavitation depends on bubble size, and as bubble populations contain a distribution of sizes, inertial cavitation is predicted to occur over a range of pressures as seen in Figure 2. For details, see Dicker et al. [45]
A highlight of Figure 2 is that the predicted inertial cavitation profile is highly sensitive to the criterion used for cavitation. That is, if the criterion for inertial cavitation is based on a critical bubble expansion, (R/Ro)*, such that no inertial cavitation occurs unless the maximal value of (R/Ro), as calculated by eqn (8), exceeds (R/Ro)*, then the predicted inertial cavitation profile depends heavily on the chosen value of (R/Ro)*. For example, if (R/Ro)* is 3, then inertial cavitation is not predicted to occur at 500 kPa whereas if (R/Ro)* is just 2, then inertial cavitation is predicted to occur at 500 kPa. The sensitivity to (R/Ro)* values in the range 2 - 8 is shown. As an alternative to (R/Ro)*, one might consider using the microbubble wall velocity - perhaps relative to the speed of sound - as a criterion for inertial cavitation. Figure 3 shows microbubble wall velocity, as calculated from eqn (8), for the same conditions as in Figure 2. Supposing the criterion for inertial cavitation were that the microbubble wall velocity must exceed the speed of sound, then inertial cavitation would be predicted to occur at 1 MPa but not at the lower pressures.
In addition to the sensitivity to the criterion used to identify inertial cavitation, it is natural to ask what is the sensitivity of inertial cavitation to the monolayer material properties contained within eqn (8)? Figure 4a shows predicted inertial cavitation profiles for a range of experimentally relevant KA values; by comparison, the effects of surface tension (Fig. 4b) and surface dilatational viscosity (Fig. 4c) on inertial cavitation are small. Comparison of Figure 4 with Figure 2 further reveals how significantly (R/Ro)* influences the prediction of inertial cavitation.
Measuring Inertial Cavitation Thresholds
The method for measuring cavitation is conceptually straightforward. A microbubble is examined within the focal overlap region of two, focused ultrasound transducers. One transducer excites the microbubble with successive pulses of ultrasound at a given pressure, and a second transducer (oriented 90° relative to the first) detects the acoustic activity of the microbubble. The region of focal overlap is sufficiently small (and the microbubble concentration sufficiently dilute) that only a single microbubble is present yet sufficiently large that the microbubble cannot diffuse away on the time scale of the experiment. Comparison of acoustic activity from pulse to pulse at multiple excitation pressures permits obvious identification of the inertial cavitation threshold pressure as that pressure at which the microbubble vanishes and broadband noise arises.
The specific system we utilize comprises two Olympus-NDT (Waltham, MA) V395 focused ultrasound transducers oriented at exactly 90° relative to one another within a plexi-glass, de-ionized water-filled tank. One transducer acts as an excitation source and transmits pulsed ultrasound at a single frequency. A second transducer serves as an emission detector. While within the focal region, a microbubble experiences multiple excitation pulses, and bubble response to each pulse is measured, recorded, and analyzed. Hundreds of microbubbles are sampled in this same manner at a given power setting, and the power is then adjusted - and the process repeated - so as to determine bubble response over a range of acoustic intensities (pressures). The presence of inertial cavitation is determined experimentally by analyzing successive waveforms, calculating the difference of the waveforms and comparing with system noise; inertial cavitation is identified as a difference that is much greater (that is, at least ten times as large as) the system noise. Details of the methodology are published.[45, 85]
One key aspect of the methodology worth noting here is the fact that a given bubble formulation does not exhibit a single inertial cavitation threshold pressure but rather a range of pressures commensurate with the polydispersity of the formulation. Experimentally, hundreds of microbubbles from the same microbubble formulation are sampled at each pressure in a range of applied pressures, and the fraction of bubbles destroyed at each pressure is measured and recorded. The results are graphed as a so-called inertial cavitation destruction profile, which is a plot of the fraction of bubbles destroyed as a function of ultrasound peak negative pressure. The point is that the experimental methodology takes into account the effect of sample polydispersity; however, such sample polydispersity cannot be distinguished from the possibility that a given microbubble (or a monodisperse population) might display a multitude of behaviors.
Figure 5 shows inertial cavitation destruction profiles from an experimental study involving sulfur hexafluoride microbubbles coated by a monolayer of DSPC with varying amounts of PEGylated DSPE of varying molecular weights and mole fractions. A few observations are noteworthy: Samples in the mushroom regime fall roughly onto a single curve (Fig. 5A), irrespective of PEG mol. wt. or mole fraction, suggesting that inertial cavitation is insensitive to changes in either PEG molecular weight or composition. This result is consistent with the prediction of eqn (10a). In the brush regime, inertial cavitation is observed to be sensitive to both PEG molecular weight and composition. Specifically, increasing the PEG mole fraction at a fixed molecular weight (Fig. 5B) increases the inertial cavitation threshold, and increasing the PEG molecular weight at a fixed PEG mole fraction (Fig. 5C) decreases the inertial cavitation threshold. These results, too, are consistent with theory according to eqn (10b).
Comparing Predictions with Measurements
Qualitatively, the results of Figure 5 are consistent with theory in that they follow the trends one would expect from eqns (8), (10a), and (10b). Admittedly, a few data points violate the trends, and more experimental work is warranted; nevertheless, the majority of the data acquired are consistent with the theoretical framework presented above. For illustrative purposes, Figure 6 shows a direct, quantitative comparison of calculated inertial cavitation profiles (solid lines) with measured inertial cavitation profiles (symbols) for samples representative of both the mushroom (A) and brush (B) regimes. At first glance, the comparison appears to show excellent agreement between theory and experiment, but the results can be misleading. Although the calculated profiles in Figure 6 are not best fits of the data, they are also not, strictly speaking, predictions. Making a priori predictions would require known values for the surface tension, surface dilatational viscosity, and area expansion modulus. In principle, such values can be obtained from experiment, but the values are not yet known for the specific system studied here. Thus, testing the predictive power of eqn (8) must wait until the physical properties are measured for the microbubble monolayers used herein.
Figure 4
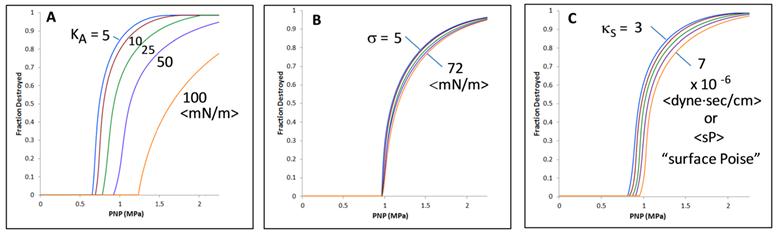
Predicted Inertial Cavitation Profiles and Sensitivity to Membrane Properties: Predicted inertial cavitation destruction profiles are calculated using eqn (8). Sensitivity of the predictions to area expansion modulus (A), surface tension (B), and surface dilatational viscosity (C) is shown for ranges of material property values expected to be realized in practice. Except where varied as shown in a given panel, material properties were KA = 50 mN/m, σ = 51 mN/m, and κs = 7 x 10 -6 sP, and the criterion used for cavitation was (R/Ro)* = 4. Driving frequency was set at 2.25 MHz to match experiments.
Figure 5
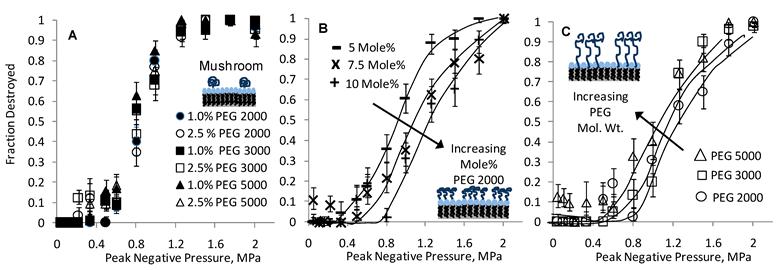
Influence of PEG (Regime, MW, and Mole Fraction) on Microbubble Inertial Cavitation: Measured cavitation destruction profiles are shown for mushroom (A) and brush (B and C) regimes. Within the mushroom regime, cavitation is insensitive to changes in either PEG MW or mole fraction. Within the brush regime, on the other hand, increasing the PEG mole fraction (from 5 to 10 mole% PEG at a fixed mol. wt. of 2000 g/mol) increases the cavitation threshold (B), and increasing the PEG MW (from 2000 to 5000 g/mol at a fixed composition of 10 mole% PEG) decreases the cavitation threshold (C). All samples in panels A-C comprised sulfur hexafluoride (SF6) as the gas core and DSPC as the coating phospholipid. Ultrasound driving frequency was 2.25 MHz. Lines are drawn as an aid to the eye. Adapted from [45].
Figure 6
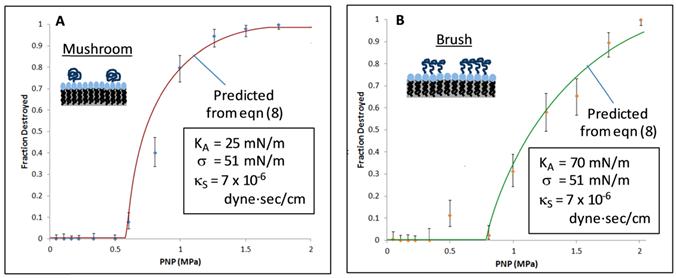
Comparison of Inertial Cavitation Predictions with Experiments: Eqn (8) was used to predict inertial cavitation profiles for two cases: (A) a mushroom regime sample and (B) a brush regime sample. Both samples comprised nominally 2 micron diameter microbubbles of sulfur hexafluoride coated by a monolayer of DSPC, for which the surface tension and dilatational viscosity were fixed at 51 mN/m and 7 x 10⁻⁶ sP (surface Poise), respectively. The mushroom sample included 1 mole% of DSPE-PEG 2000 with an estimated area expansion modulus of 25 mN/m. The brush sample was made using 10 mole% DSPE-PEG 2000, for which the area expansion modulus was calculated via eqn (10b) to be 70 mN/m. The criterion used for cavitation in both cases was (R/Ro)* = 3.
In the meantime, we have estimated the values based on what is known in the literature. We set the surface tension to 51 mN/m to match prior studies,[54, 86] bearing in mind that the surface tension value has relatively minor influence on the cavitation destruction profile (per Fig. 4B). We set the surface dilatational viscosity to 7 x 10⁻⁶ sP, based on a value for octanoic acid reported by Kao et al., bearing in mind that this value varies with surfactant concentration and that reported surface dilatational viscosity values depend on the measurement method. [58] We hold the values of the surface tension and surface dilatational viscosity fixed in the two (mushroom and brush) regimes, as the primary surfactant (DSPC) is the same in both regimes. To our knowledge, area expansion modulus has not yet been measured for DSPC-PEG monolayers coating gas bubbles. We therefore estimated the area expansion modulus of the mushroom regime sample, which contained 1 mole% of DSPE-PEG 2000, to be 25 mN/m, based on the work of Rawicz et al. involving bilayers surrounding an aqueous core. [61] Proceeding from this value for the mushroom regime sample, we calculated a value of 70 mN/m for the area expansion modulus of the brush regime sample, which contained 10 mole% DSPE-PEG 2000, using eqn (10b) and Eads = 8.4. Finally, we set (R/Ro)* to a value of 3 and held this value fixed - as the criterion for inertial cavitation - in both regimes. Similar to a need for values of the material properties, testing the predictive capabilities of eqn (8) will require greater knowledge as to the criterion for inertial cavitation. Given these considerations, one might say the agreement between theory and experiment is reasonable yet more work needs to be done.
Nesting Microbubbles Inside Microcapsules or Giant Vesicles
We recently described nesting of microbubbles inside the aqueous core of microcapsules, both for long-lasting, safe imaging[44, 81] and for controlled drug delivery[43]. A microcapsule shell can be made from a biodegradable polymer such as poly(lactic) acid (PLA) or from a (self-assembled) phospholipid bilayer (in which case the microcapsule is a phospholipid vesicle, or liposome). We find that PLA is advantageous for imaging for at least four reasons: 1) it prevents gas escape into the bulk fluid, thus slowing gas diffusion and increasing microbubble longevity; 2) it inhibits inertial cavitation, thus increasing the inertial cavitation threshold and improving safety; 3) it absorbs the energy of inertial cavitation when inertial cavitation does occur, thus inhibiting cell death and improving safety; and 4) it gives contrast-to-tissue ratios that are equally bright to commercial agents and that persist at least an order of magnitude longer. [45, 81] Naturally, there are also likely to be some disadvantages. Primary among these are the fact that PLA microcapsules are necessarily larger than the microbubbles they encapsulate. Additionally, PLA microcapsules are stiffer than phospholipid membranes. Considering the latter, we find that a phospholipid bilayer is well-suited for drug delivery because the rate of ultrasound-induced release from liposomes can be tuned using bilayer phase behavior.[43, 81, 87] In this section we consider the influence of a PLA shell on inertial cavitation; we consider the influence of a phospholipid bilayer on release kinetics in the Sonoporation section.
Nesting microbubbles inside a microcapsule or vesicle is shown in Figure 7. Figure 7A shows an electron micrograph of the microcapsules, along with a cartoon representation (7B) and a fluorescent micrograph (7C) revealing the presence of microbubbles inside the aqueous core. The number of microbubbles within a microcapsule and the relative sizes of microbubbles and microcapsules are readily varied via changes in recipe and homogenization speeds. Figure 8 shows that the nested configuration significantly inhibits inertial cavitation. For example, a pressure of 1.4 MPa led to complete destruction of a population of DSPC-coated, SF6 microbubbles when those microbubbles were freely floating (that is, un-nested) but led to destruction of less than half of a population of identical microbubbles that were nested inside PLA microcapsules.
The nested configuration has not been addressed in any of the foregoing bubble models, but the dramatic influence on inertial cavitation suggests that nesting microbubbles is worthy of further investigation. One possible explanation for the increase in inertial cavitation threshold pressure observed with nested formulations relates to changes in microbubble acoustic absorption and damping. Another possible explanation is that the inhibition of inertial cavitation in the nested configuration arises from surface repulsions similar to those observed when microbubbles are insonified near a stiff wall.[88-91] Specifically, we hypothesize that the PLA microcapsule resists microbubble expansion in a manner analogous to the way a stiff wall causes microbubble jetting. That is, a repulsive force arises as the microbubble wall, owing to gas expansion, approaches the microcapsule wall, and the magnitude of this force is inversely proportional to the square of the distance between the two walls; the repulsion slows the velocity of the microbubble wall, thereby inhibiting inertial cavitation.
We are presently investigating various aspects of nesting, including then number and size of nested microbubbles, microbubble size polydispersity, interactions between microbubbles, and varying microcapsule shell materials, whose stiffness and toughness may vary. In particular, we are interested in nesting microbubbles inside an aqueous core surrounded by a phospholipid bilayer; not only is the bilayer deformable, which is interesting from a scientific viewpoint, but it is susceptible to sonoporation. [43, 81, 87] Accordingly, nesting of microbubbles inside the aqueous core of a liposome (or giant, uni-lamellar phospholipid vesicle) constitutes a controllable drug delivery vehicle whereby ultrasound-induced cavitation of the microbubbles within the vesicles facilitates (reverse sono)poration of the vesicle bilayer and hence release of drug from the vesicle.[43] It is this phenomenon to which we now turn our attention.
Figure 7
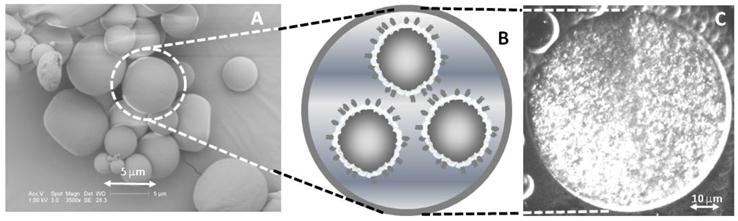
Nesting Microbubbles within PLA Microcapsules: A) Electron micrograph of a typical batch of PLA microcapsules. The size is easily varied via homogenization speed; clinical applications require diameters smaller than 10 microns for passage through capillaries. B) Cartoon representation showing multiple microbubbles inside the aqueous core of a single PLA microcapsule. Each microbubble is coated with a phospholipid monolayer, and the microbubbles are nested inside a single PLA shell that serves to limit microbubble expansion and thus inhibit inertial cavitation. C) A fluorescent micrograph showing a large population of rhodamine-labeled microbubbles contained within a PLA microcapsule. The PLA microcapsule in panel C was made for visualization purposes and is sufficiently large (~50 μm diameter) that individual microbubbles, each approximately 1-2 microns in diameter, appear as bright dots. Adapted from [81] and [43]
Figure 8
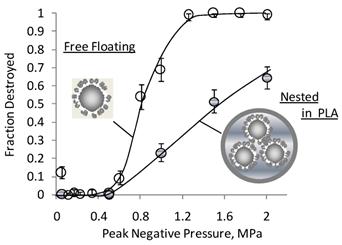
Nesting Inhibits Inertial Cavitation: Cavitation destruction profiles for two samples of microbubbles, both having identical coatings of DSPC plus 5 mole% DSPE-PEG (with a PEG mol. wt. of 5000 g/mol) are shown: freely floating (not nested) and nested within the aqueous core of a PLA microcapsule. Nesting microbubbles within PLA microcapsules significantly reduces inertial-cavitation induced destruction of microbubbles. For example, whereas complete destruction is achieved at a pressures of 1.4 MPa when the microbubbles are freely floating, less than half of the microbubbles are destroyed when the microbubbles are nested inside PLA. In addition to increasing the inertial cavitation threshold, the PLA wall absorbs cavitation energy when pressures are high enough to cause cavitation; thus, the PLA wall inhibits the cell death that would otherwise occur with cavitation.[81] Adapted from [44]
Sonoporation
Putative Mechanisms
Sonoporation is a relatively young phenomenon that is receiving growing interest because of the great promise it holds for drug delivery.[18, 92] In the most common embodiment, sonoporation involves the placement of a microbubble in close proximity to a living cell.[15] The microbubble, in response to alternating phases of positive and negative ultrasound pressure, produces transient pores in the cell membrane. Such pores, which are also found to arise in simulations,[93, 94] have been shown to facilitate transport of molecules across an otherwise impermeable cell membrane.[15, 17, 21, 22]
Despite the popularity of sonoporation, the detailed mechanism of sonoporation remains largely unknown. Excellent reviews of the topic are available. [19, 23, 82, 95] Briefly, some contend that the mechanism requires inertial cavitation,[25, 27, 96] while others contend that sustained microbubble oscillations - or stable cavitation - is sufficient; in the latter case, shear stresses associated with acoustic microstreaming are believed to play a key role.[16, 17, 23, 24] Still others contend that both types of cavitation are important.[97] Figure 9 summarizes these putative sonoporation mechanisms.
What the foregoing sonoporation mechanisms have in common is that they require the presence of a microbubble or a cell, or both. However, ultrasound is known to facilitate leakage from phospholipid vesicles, which are not cells and contain no proteins, in the absence of microbubbles.[98, 99] Sonoporation of phospholipid vesicles (or liposomes) shows us that the putative sonoporation mechanisms of Figure 9 do not tell the whole story, but this fact has gone largely ignored or unnoticed. The observation is important because in addition to delivery of cargo into a cell, one can now envision ultrasound-triggered release of cargo from a vesicle, or “reverse sonoporation.” We therefore propose additional mechanisms in Figure 10 to account for reverse sonoporation of liposomes.
First is nucleation of a gas bubble within the vesicle bilayer (Fig. 10D), whereby subsequent growth, expansion, and/or translocation of this bubble creates the pore for sonoporation. This idea is not new. Such intra-membrane nucleation has been previously suggested by Schroeder et al.[82]. A related idea, similar to that in panel 10D, is that ultrasound can tear apart bilayer leaflets, thus creating what Krasovitski et al. refer to as a “bilayer sonophore” or BLS.[20] While formation of a BLS would not require the presence of a microbubble, it would require - as conceded by Krasovitski et al. - the presence of cellular proteins; accordingly, the theory introduced by Krasovitski et al. is not sufficient to explain sonoporation of protein-free liposomes. Also not new is that ultrasound can catastrophically disrupt a phospholipid vesicle (Fig. 10E); indeed, this is believed to be a primary means by which ultrasound generates small, uni-lamellar vesicles from multi-lamellar vesicles and has been shown to contribute - at least in part - to ultrasound-induced leakage from liposomes.[100]
There is a new idea we wish to present, which to our knowledge has not been previously discussed. That is, we believe that in the presence of ultrasound it is possible - perhaps even probable - to nucleate dissolved gases (e.g., oxygen, carbon dioxide, nitrogen, etc.) or vaporize water itself within the aqueous core of a vesicle. Expansion of the gas or vapor then dilates the system, leading to greater separation between phospholipid molecules than in the resting state; this is shown in Fig. 10F. Such dilation, which could, strictly speaking, arise even in the absence of formation of a gas or vapor pocket within the aqueous core, would permit diffusion across the bilayer during negative portions of the ultrasound wave. While not involving pores per se, this mechanism would account for the transport observed in microbubble-free, protein-free, cell-free liposome systems. Moreover, for the case of nesting microbubbles inside the aqueous core of liposomes, dilation (Fig. 10F) could be an additional mechanism (in addition to those of Fig. 9) by which microbubbles facilitate transport across an otherwise impermeable bilayer.
There is second, new mechanism we wish to propose. Specifically, one could imagine a hybrid model involving microbubbles and intra-membrane cavitation. That is, a microbubble could fuse with a phospholipid bilayer, be that bilayer a cell membrane or a vesicle bilayer, in a fashion analogous to vesicle-vesicle membrane fusion. [101, 102] The result, shown as Figure 11, would be a bilayer that contains a gas pocket similar to the nucleated gas envisioned by Schroeder et al. (10D) or the BLS envisioned by Krasovitski et al. Although the end result is the same, this mechanism (Fig. 11G) would require no nucleation of gas and no tearing apart of leaflets between proteins.
Reverse Sonoporation
Figure 11 is not the only possible combination of microbubbles and liposomes. We previously described covalently linking microbubbles to the outer monolayer of liposomes[9] and nesting of microbubbles inside the aqueous core [43] as means to facilitate ultrasound-induced leakage of drugs. We refer to ultrasound-induced drug release from vesicles as reverse sonoporation. An advantage of liposomes for drug release is that the kinetics of release are tunable with vesicle size[99] and bilayer phase behavior.[87] It is also possible that the mechanism of (reverse) sonoporation varies with phase. We recently reported that liquid-ordered bilayers show no evidence of destruction, whereas liquid- disordered bilayers exhibit partial destruction.[87] Enden et al. also found that destruction contributes partially to observed ultrasound-induced leakage from vesicles.[100]
We now take a closer look at those findings and consider results from a reverse sonoporation study in a lipid system with well-defined phase behavior. The liposomal bilayers comprised a ternary mixture of 1,2-dioleoyl-phosphocholine (DOPC), 1,2-dipalmitoyl-phosphocholine (DPPC), and cholesterol. The primary utility of this particular lipid mixture is that it has a two-phase region, in which liquid-ordered domains, or rafts, coexist with a liquid-disordered phase, and has been well characterized.[103-108] Release was measured via monitoring of the de-quenching of calcein with steady-state fluorescence spectroscopy, as described previously.[87]
Our data suggest that the rate of release is faster for the liquid-disordered phase than for the liquid-ordered phase, as shown in Figure 12. The data (denoted by symbols) are presented in terms of a dimensionless time parameter suggested by diffusion analysis [Dt/a2], where D is the diffusion coefficient of the encapsulant in the bulk medium (here, calcein in water) and a is the liposome diameter.[109] In Figure 12a solid lines are best fits to a diffusion model, as would be expected for either a poration (Figure 10D) or dilation (Figure 10F) mechanism. The diffusion model, which we developed to describe release from a sphere with a surface resistance, is given by equations (11) and (12):[110, 111]
(11)
where f is the fraction of the component's mass M, released (via diffusion) at time t and M∞ is the initial amount encapsulated, D is the diffusion coefficient in the sphere's aqueous region, a is the sphere's (liposome) radius, DB is the diffusion coefficient through the bilayer, and L is a dimensionless permeability parameter that defines the properties of the lipid bilayer: L=aDB/(hD), where h is the bilayer thickness.[109] The eigenvalues, βn, are given by the roots of the expression:[109]
(12)
As shown in Figure 12a, the diffusion model fits the experimental data well, without accounting for any liposome destruction. However, a similarly good fit can be obtained by a model that accounts only for liposome destruction. Specifically, solid lines in Figure 13b are best fits of a destruction model in which the rate of liposome destruction is proportional to the first order of liposome concentration such that the number of remaining liposomes decreases exponentially with time. Thus, release data alone cannot distinguish between the contributions of diffusion (Fig. 12a) and liposome destruction (Fig. 12b).
As an initial attempt to distinguish mechanisms and quantify the relative contributions of liposome destruction versus diffusion through the bilayer, we performed a particle counting experiment in which we measured the number of liposomes and their diameter, under the application of ultrasound, using a Nanosight LM10-HS. As shown in Figure 13, the overall number of liposomes decreases with ultrasound exposure time, with the most pronounced decrease (nearly 50%) occurring in the first four minutes of ultrasound exposure. This result strongly suggests that at least some vesicle destruction is occurring, consistent with our prior studies.[87] However, more studies are needed to determine the exact extent and rate of liposome destruction. Once we are able to measure independently the rate of liposome destruction, we can then quantify the contributions of the two mechanisms and attain an accurate measure of the bilayer permeability parameter, L. Once L is known, it could be linked to pore properties such as overall area fraction and diameter. For an array of permanent pores;[110-112]
(13)
where φB is the fraction of surface area occupied by pores, and b is a pore radius. This expression would then need to be modified to account for the transient nature of the pores.
Figure 9
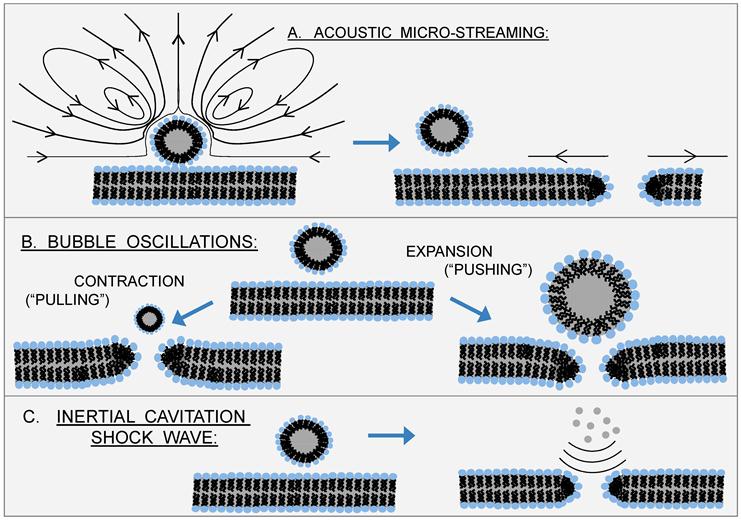
Putative Sonoporation Mechanisms Involving Microbubbles: Sonoporation traditionally involves exogenous microbubbles in close proximity to cells, and the mechanism of action by which ultrasound forms transient pores in the cell membrane is believed to stem from various microbubble phenomena: A) acoustic streaming associated with stable cavitation; B) bubble/cell membrane interactions arising from bubble oscillations; and C) shock waves generated by inertial cavitation. In each case, the net result is a disruption (or pore) in the cell membrane and reorientation of phospholipids in the vicinity of the pore to prevent exposure of acyl chains. Re-drawn from Delalande 2011.[19]
Figure 10
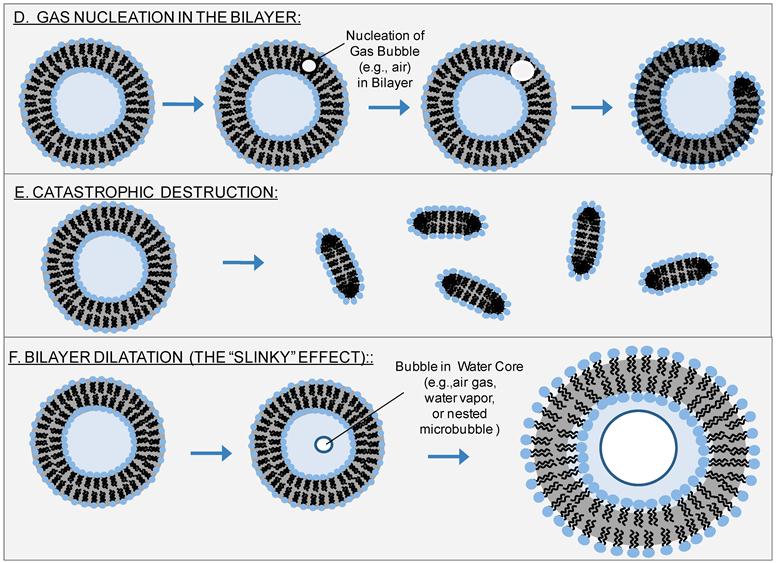
Reverse Sonoporation Mechanisms: Sonoporation traditionally involves microbubbles in close proximity to cells. However, sonoporation is also known to occur with liposomes. With the exception of nesting microbubbles inside the aqueous core of phospholipid vesicles, the putative mechanisms of Figure 9 are not applicable here; another mechanism or mechanisms must account for ultrasound-induced leakage from liposomes. One possibility is nucleation of a gas bubble in the hydrophobic region of the phospholipid bilayer; subsequent growth, expansion, and/or translocation of this bubble creates the pore for transport (D).[82] Another possibility is that inertial cavitation of bubbles (generated either inside the liposome core, within the liposomal bilayer, or in the bulk aqueous phase) catastrophically disrupts the liposome (indeed, this is believed to be the mechanism by which sonication creates small, uni-lamellar vesicles from giant, multi-lamellar vesicles) (E). Lastly, we propose a new mechanism, which recognizes that negative ultrasound pressure causes the entire liposome to expand, leading to dilation and increased separation between phospholipids (F). Such dilation would be enhanced by formation of a bubble - e.g., via nucleation of dissolved gases or vaporization of water - (or by nesting of one or more microbubbles) inside the aqueous core of the liposome and subsequent expansion of this bubble with negative ultrasound pressure. Although mechanism (F) would not create holes per se, it would account for the increased membrane permeability observed upon application of ultrasound.
Figure 11
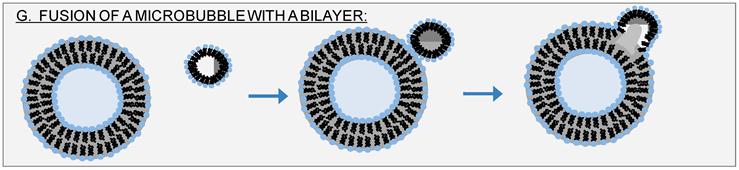
A Hybrid Model - Fusion of a Microbubble with a Bilayer: We combine the notion that sonoporation traditionally involves microbubbles with the intra-membrane gas nucleation mechanism (Fig. 10D) described by Schroeder et al.[82]
Figure 12
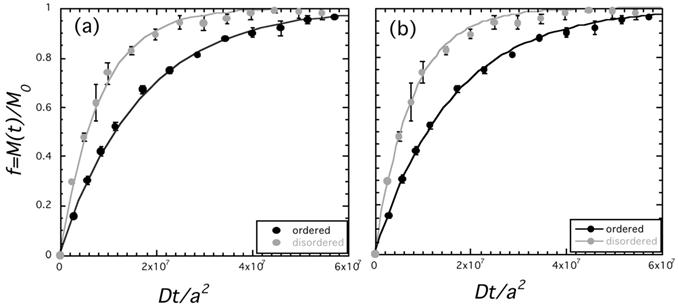
Reverse Sonoporation Kinetics of Calcein from DOPC/DPPC/Cholesterol Liposomes. f = M(t)/M∞ denotes the fractional release of calcein. 100% release is determined from complete dissolution by triton. Dt/a2 is the dimensionless time, where D is the diffusion coefficient of calcein in water (3.5 x 10⁻⁶ cm2/s)[83, 84] and a is the average diameter of the vesicles, as measured by dynamic light scattering (184 nm for the liquid-disordered sample and 171 nm for the liquid-ordered sample). The lines denote fits to (a) a diffusion model using equations (12) and (13) with a value of L = 2 x 10⁻⁸ for the liquid-ordered phase, and L = 4 x 10⁻⁸ for the liquid-disordered phase, and to (b) a first-order destruction model [dN(t)/dt = -(N(t)/τ), where N is the number of liposomes, so that f(t) = exp (-t/τ)], with τ = 1.6 x 10⁷ for the liquid-disordered phase, and τ = 7.8 x 10⁶ for the liquid-ordered phase. The compositions (molar ratios) are 0.05:0.60:0.35 DOPC:DPPC:cholesterol for the liquid-ordered phase, and 0.76:0.20:0.04 for the liquid-disordered phase. [For experimental details see Small 2011]
Figure 13
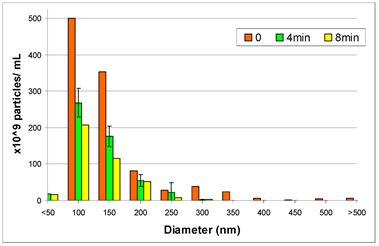
Results from a Nanosight LM10-HS Study of Liposome Number and Size Distribution Under Applied Ultrasound: The sample corresponds to the liquid-disordered sample of Figure 12. Time refers to ultrasound (20 kHz, continuous wave) exposure time, where 0 denotes the initial distribution. The overall reduction in the size distribution, which indicates a loss of particles, is evidence of ultrasound-induced vesicle destruction and is consistent with mechanism (E) in Figure 10.
Concluding Remarks
Phospholipid monolayer-coated microbubbles and phospholipid bilayer vesicles are attractive candidates for “theranostic” applications because of their tunability with membrane composition and the sensitivity of acoustic phenomena to the resulting membrane properties. This paper has given specific, quantitative examples of how membrane properties influence inertial cavitation of microbubbles and how membrane phase behavior influences kinetics and mechanisms of sonoporation of liposomes. Such information will potentially be useful in guiding rational design and optimization of theranostic applications and technologies that involve combinations of ultrasound, microbubbles, and liposomes.
Competing Interests
The authors have declared that no competing interest exists.
References
1. Postema M, Schmitz G. Bubble dynamics involved in ultrasonic imaging. Expert Review of Molecular Diagnostics. 2006;6:493-502
2. Klibanov A. Targeted delivery of gas-filled microspheres, contrast agents for ultrasound imaging. Adv Drug Deilvery Rev. 1999;37:139-57
3. Stride E, Edirisinghe M. Novel microbubble preparation technologies. Soft Matter. 2008;4:2350-9
4. Borden M, Dayton P, Zhao S, Farquhar M. Physico-chemical Properties of the Microbubble Lipid Shell. IEEE International Ultrasonics, Ferroelectrics, and Frequency Control Joint 50th Anniversary Conference. 2004:20-3
5. Borden MA, Longo ML. Dissolution Behavior of Lipid Monolayer-Coated, Air-Filled Microbubbles: Effect of Lipid Hydrophobic Chain Length. Langmuir. 2002;18:9225-33 doi:10.1021/la026082h
6. Borden MA, Longo ML. Oxygen Permeability of Fully Condensed Lipid Monolayers. The Journal of Physical Chemistry B. 2004;108:6009-16 doi:10.1021/jp037815p
7. Borden MA, Pu G, Runner GJ, Longo ML. Surface phase behavior and microstructure of lipid/PEG-emulsifier monolayer-coated microbubbles. Colloids and Surfaces B: Biointerfaces. 2004;35:209-23 doi:10.1016/j.colsurfb.2004.03.007
8. Duncan PB, Needham D. Test of the Epstein-Plesset Model for Gas Microparticle Dissolution in Aqueous Media: Effect of Surface Tension and Gas Undersaturation in Solution. Langmuir. 2004;20:2567-78 doi:10.1021/la034930i
9. Wrenn S, Mleczko M, Schmitz G. Phospholipid-stabilized microbubbles: Influence of shell chemistry on cavitation threshold and binding to giant uni-lamellar vesicles. Applied Acoustics. 2009;70:1313- 22
10. Kheirolomoom A, Dayton PA, Lum AFH, Little E, Paoli EE, Zheng H. et al. Acoustically-active microbubbles conjugated to liposomes: Characterization of a proposed drug delivery vehicle. Journal of Controlled Release. 2007;118:275-84 doi:10.1016/j.jconrel.2006.12.015
11. Lum AFH, Borden MA, Dayton PA, Kruse DE, Simon SI, Ferrara KW. Ultrasound radiation force enables targeted deposition of model drug carriers loaded on microbubbles. Journal of Controlled Release. 2006;111:128-34 doi:10.1016/j.jconrel.2005.11.006
12. Unger E, masunaga T, McCreery T, Schumann P, Sweitzer R, Quiqley R. Therapeutic applications of microbubbles. Eur J Radiology. 2002;42:160-8
13. Klibanov A. Targeted delivery of gas-filled microspheres, contrast agents for ultrasound imaging. Adv Drug Deilvery Rev. 1994;37:139-57
14. Wu J, Chen D, Pepe J, Himberg BE, Ricń M. Application of liposomes to sonoporation. Ultrasound in Medicine and Biology. 2006;32:429-37 doi:10.1016/j.ultrasmedbio.2005.11.019
15. van Wamel A, Kooiman K, Harteveld M, Emmer M, ten Cate FJ, Versluis M. et al. Vibrating microbubbles poking individual cells: Drug transfer into cells via sonoporation. Journal of Controlled Release. 2006;112:149-55 doi:10.1016/j.jconrel.2006.02.007
16. Wu J. Theoretical study on shear stress generated by microstreaming surrounding contrast agents attached to living cells. Ultrasound in Medicine and Biology. 2002;28:125-9 doi:10.1016/s0301-5629(01)00497-5
17. Wu J, Ross J, Chiu J. Reparable sonoporation generated by microstreaming. Your access to this publication is provided through the subscription of Drexel University Library Welcome Message Help Journal of the Acoustical Society of America. 2002;111:1460-4
18. Tlaxca JL, Anderson CR, Klibanov AL, Lowrey B, Hossack JA, Alexander JS. et al. Analysis of in vitro Transfection by Sonoporation Using Cationic and Neutral Microbubbles. Ultrasound in Medicine and Biology. 2010;36:1907-18 doi:10.1016/j.ultrasmedbio.2010.05.014
19. Delalande A, Kotopoulis S, Rovers T, Pichon C, Postem M. Sonoporation at a low mechanical index. Bubble Science Engineering and Technology. 2011;3:3-11
20. Krasovitski B, Frenkel V, Shoham V, Kimmel E. Intramembrane cavitation as a unifying mechanism for ultrasound-induced bioeffects. Proc Natl Acad Sci USA. 2011;108:3258-63
21. Karshafian R, Bevan PD, Williams R, Samac S, Burns PN. Sonoporation by Ultrasound-Activated Microbubble Contrast Agents: Effect of Acoustic Exposure Parameters on Cell Membrane Permeability and Cell Viability. Ultrasound in Medicine and Biology. 2009;35:847-60 doi:10.1016/j.ultrasmedbio.2008.10.013
22. Zhou Y, Kumon RE, Cui J, Deng CX. The Size of Sonoporation Pores on the Cell Membrane. Ultrasound in Medicine and Biology. 2009;35:1756-60 doi:10.1016/j.ultrasmedbio.2009.05.012
23. Doinikov A, Bouakaz A. Theoretical investigation of shear stress generated by a contrast microbubble on the cell membrane as a mechanism for sonoporation. J Acoust Soc Am. 2010;128:11-9
24. Marmottant P, Hilgenfeldt S. Controlled vesicle deformation and lysis by single oscillating bubbles. Nature. 2003;423:153- 6
25. Zarnitsyn VG, Prausnitz MR. Physical parameters influencing optimization of ultrasound-mediated DNA transfection. Ultrasound in Medicine and Biology. 2004;30:527-38 doi:10.1016/j.ultrasmedbio.2004.01.008
26. Gruzman H, McNamara A, Nguyen D, Prausnitz M. BIOEFFECTS CAUSED BY CHANGES IN ACOUSTIC CAVITATION BUBBLE DENSITY AND CELL CONCENTRATION: A UNIFIED EXPLANATION BASED ON CELL-TO-BUBBLE RATIO AND BLAST RADIUS. Ultrasound in Medicine and Biology. 2003;29:1211-22
27. Schlicher RK, Radhakrishna H, Tolentino TP, Apkarian RP, Zarnitsyn V, Prausnitz MR. Mechanism of intracellular delivery by acoustic cavitation. Ultrasound in Medicine and Biology. 2006;32:915-24 doi:10.1016/j.ultrasmedbio.2006.02.1416
28. O'Brien JW. Ultrasound-biophysics mechanisms. Progress in Biophysics and Molecular Biology. 2007;93:212-55 doi:10.1016/j.pbiomolbio.2006.07.010
29. Dialecki D. WFUMB SAFETY SYMPOSIUM ON ECHO-CONTRAST AGENTS: BIOEFFECTS OF ULTRASOUND CONTRAST AGENTS IN VIVO. Ultrasound in Medicine and Biology. 2007;33:205-13
30. Nyborg W. WFUMB SAFETY SYMPOSIUM ON ECHO-CONTRAST AGENTS: MECHANISMS FOR THE INTERACTION OF ULTRASOUND. Ultrasound in Medicine and Biology. 2007;33:224-32
31. Hallow DM, Mahajan AD, McCutchen TE, Prausnitz MR. Measurement and correlation of acoustic cavitation with cellular bioeffects. Ultrasound in Medicine and Biology. 2006;32:1111-22 doi:10.1016/j.ultrasmedbio.2006.03.008
32. Abbott J. RATIONALE AND DERIVATION OF MI AND TI—A REVIEW. Ultrasound in Medicine and Biology. 1999;25:431-41
33. Barnett SB, Ter Haar GR, Ziskin MC, Nyborg WL, Maeda K, Bang J. Current status of research on biophysical effects of ultrasound. Ultrasound in Medicine and Biology. 1994;20:205-18 doi:10.1016/0301-5629(94)90060-4
34. Leighton T. The Acoustic Bubble. San Diego, CA: Academic Press, Inc. 1994
35. Apfel RE, Holland CK. Gauging the likelihood of cavitation from short-pulse, low-duty cycle diagnostic ultrasound. Ultrasound in Medicine and Biology. 1991;17:179-85 doi:10.1016/0301-5629(91)90125-g
36. Webb I, Payne S, Coussios C. The effect of temperature and viscoelasticity on cavitation dynamics during ultrasonic ablation. J Acoust Soc Am. 2011;130:3458- 66
37. Ammi AY, Cleveland RO, Mamou J, Wang GI, Bridal SL, O'Brien WD. Ultrasonic contrast agent shell rupture detected by inertial cavitation and rebound signals. Ultrasonics, Ferroelectrics and Frequency Control, IEEE Transactions on. 2006;53:126-36
38. Ammi A, Mamou J, Wang G, Cleveland R, Bridal S, O'Brien W. Determining Thresholds For Contrast Agent Collapse. IEEE International Ultrasonics, Ferroelectrics, and Frequency Control Joint 50th Anniversary Conference. 2004:346- 9
39. King D, Malloy M, Roberts A, Haak A, Yoder C, O'Brien WD. Determination of postexcitation thresholds for single ultrasound contrast agent microbubbles using double passive cavitation detection. J Acoust Soc Am. 2010;127:3449-55
40. King D, O'Brien W. Comparison between maximum radial expansion of ultrasound contrast agents and experimental postexcitation signal results. J Acoust Soc Am. 2011;129:114-21
41. Tran B, Seo J, Hall T, Fowlkes J, Cain C. Microbubble-Enhanced Cavitation for Noninvasive Ultrasound Surgery. IEEE Trans Ultrasonics, Ferroelectrics and Frequency Control. 2003;50:1296-304
42. Feshitan JA, Vlachos F, Sirsi SR, Konofagou EE, Borden MA. Theranostic Gd(III)-lipid microbubbles for MRI-guided focused ultrasound surgery. Biomaterials. 2012;33:247-55 doi:10.1016/j.biomaterials.2011.09.026
43. Wrenn S, Dicker S, Small E, Mleczko M. Controlling Cavitation for Controlled Release. IEEE International Ultrasonics Symposium Proceedings. 2009:104-7
44. Dicker S, Mleczko M, Hensel K, Bartolomeo A, Schmitz G, Wrenn S. Coencapsulation of lipid microbubbles within polymer microcapsules for contrast applications. Bubble Science Engineering and Technology. 2011;3:12- 9
45. Dicker S, Mleczko M, Schmitz G, Wrenn S. Determination of microbubble cavitation threshold pressure as function of shell chemistry. Bubble Science Engineering and Technology. 2010;2:55- 64
46. Neppiras E. ACOUSTIC CAVITATION. Physics Reports (Review Section of Physics Letters). 1980;61:159-251
47. de Jong N, Hoff L, Skotland T, Bom N. Absorption and scatter of encapsulated gas filled microspheres: Theoretical considerations and some measurements. Ultrasonics. 1992;30:95-103 doi:10.1016/0041-624x(92)90041-j
48. de Jong N, Hoff L. Ultrasound scattering properties of Albunex microspheres. Ultrasonics. 1993;31:175-81 doi:10.1016/0041-624x(93)90004-j
49. Hoff L, Hoff B. Acoustic Properties of Shell-encapsulated, gas-filled ultrasound contrast agents. IeEE Utrasonics Symposium. 1996:1441-4
50. Frinking PJA, de Jong N. Acoustic Modeling of Shell-Encapsulated Gas Bubbles. Ultrasound in Medicine and Biology. 1998;24:523-33 doi:10.1016/s0301-5629(98)00009-x
51. Doinikov A, Dayton P. Spatio-temporal dynamics of an encapsulated gas bubble in an ultrasound field. J Acoust Soc Am. 2006;120:661- 9
52. Church C. The effects of an elastic solid surface layer on the radial pulsations of gas bubbles. J Acoust Soc Am. 1995;97:1510- 21
53. Vokurka K. Comparison of Rayleigh's, Herring's and Gilmore's Models of Gas Bubbles. Acustica. 1986;59:214-9
54. Morgan K, Allen J, Daython P, Chomas J, Klibanov A, Ferrara K. Experimental and theoretical evaluation of microbubble behavior: effect of transmitted phase and bubble size. IEEE Trans Ultrasonics, Ferroelectrics and Frequency Control. 2000;47:1494-509
55. Chatterjee D, Sarkar K. A Newtonian rheological model for the interface of microbubble contrast agents. Ultrasound in Medicine and Biology. 2003;29:1749-57 doi:10.1016/s0301-5629(03)01051-2
56. Scriven L. Dynamics of a fluid interface. Equation of motion for Newtonian surface fluids. Chemical Engineering Science. 1960;12:98- 108
57. Djabbarah NF, Wasan DT. Dilational viscoelastic properties of fluid interfaces—III Mixed surfactant systems. Chemical Engineering Science. 1982;37:175-84 doi:10.1016/0009-2509(82)80152-8
58. Kao RL, Edwards DA, Wasan DT, Chen E. Measurement of interfacial dilatational viscosity at high rates of interface expansion using the maximum bubble pressure method. I. Gas—liquid surface. Journal of Colloid and Interface Science. 1992;148:247-56 doi:10.1016/0021-9797(92)90133-7
59. Lopez J, Vogel M, Hirsa A. Influence of coexisting phases on the surface dilatational viscosity of Langmuir monolayers. Physical Review E. 2004;70:1-5
60. Crane J, Putz G, Hall S. Persistence of Phase Coexistence in Disaturated Phosphatidylcholine Monolayers at High Surface Pressures. Biophys J. 1999;77:3134-43
61. Rawicz W, Olbrich K, McIntosh T, Needham D, Evans E. Effect of Chain Length and Unsaturation on Elasticity of Lipid Bilayers. Biophys J. 2000;79:328-39
62. Sández MI, Suárez A, Gil A. Surface Pressure-Area Isotherms and Fluorescent Behavior of Phospholipids Containing Labeled Pyrene. Journal of Colloid and Interface Science. 2002;250:128-33 doi:10.1006/jcis.2002.8346
63. Pétriat F, Roux E, Leroux JC, Giasson S. Study of Molecular Interactions between a Phospholipidic Layer and a pH-Sensitive Polymer Using the Langmuir Balance Technique. Langmuir. 2004;20:1393-400 doi:10.1021/la035583f
64. Stride E. The influence of surface adsorption on microbubble dynamics. Phil Trans R Soc A. 2008;366:2103- 15
65. Sarkar K, Shi W, Chatterjee D, Forsberg F. Characterization of ultrasound contrast microbubbles using in vitro experiments and viscous and viscoelastic interface models for encapsulation. J Acoust Soc Am. 2005;118:539- 50
66. Shirshendu P, Katiyar A, Sarkar K, Chatterjee D, Shi W, Forsberg F. Material characterization of the encapsulation of an ultrasound contrast microbubble and its subharmonic response: Strain-softening interfacial elasticity model. J Acoust Soc Am. 2010;127:3846-57
67. Discher B, Won Y, Ege D, Lee J, Bates F, Discher D. et al. Polymersomes: Tough vesicles made from Diblock Copolymers. Science. 1999;284:1143- 6
68. Kim DH, Costello MJ, Duncan PB, Needham D. Mechanical Properties and Microstructure of Polycrystalline Phospholipid Monolayer Shells: Novel Solid Microparticles. Langmuir. 2003;19:8455-66 doi:10.1021/la034779c
69. Evans E, Rawicz W. Elasticity of ''Fuzzy'' Biomembranes. Physical Review Letters. 1997;79:2379-82
70. Szleifer I, Gerasimov O, Thompson D. Spontaneous liposome formation induced by grafted poly(ethylene oxide) layers: Theoretical prediction and experimental verification. Proc Natl Acad Sci USA. 1998;95:1032-7
71. Rovira-Bru M, Thompson D, Szleifer I. Size and Structure of Spontaneously Forming Liposomes in Lipid/PEG-Lipid Mixtures. Biophys J. 2002;83:2419-39
72. Marsh D. Elastic Constants of Polymer-Grafted Lipid Membranes. Biophys J. 2001;81:2154-62
73. de Gennes P. Polymers at an interface; a simplified view. Advances in Colloid and Interface Science. 1987;27:189-209 doi:10.1016/0001-8686(87)85003-0
74. Kenworthy A, Hristova K, Needham D, McIntosh T. Range and Magnitude of the Steric Pressure Between Bilayers Containing Phospholipids with Covalently Attached Poly(ethylene glycol). Biophys J. 1995;68:1921- 36
75. Kenworthy A, Simon S, McIntosh T. Structure and Phase Behavior of Lipid Suspensions Containing Phospholipids with Covalently Attached Poly(ethylene glycol). Biophys J. 1995;68:1903- 20
76. Dan N. Brush Adsorption from Polydisperse Solutions. Macromolecules. 1994;27:2310- 2
77. Marsh D, Bartucci R, Sportelli L. Lipid membranes with grafted polymers: physicochemical aspects. Biochimica et Biophysica Acta (BBA) - Biomembranes. 2003;1615:33-59 doi:10.1016/s0005-2736(03)00197-4
78. Flynn H. Cavitation dynamics. II. Free pulsations and models for cavitation bubbles. J Acoust Soc Am. 1975;58:1160- 70
79. Walton A, Reynolds G. Sonoluminescence. Advnaces in Physics. 1984;33:595-660
80. Stride E, Coussios C. Cavitation and contrast: the use of bubbles in ultrasound imaging and therapy. Journal of Engineering in Medicine (Proceedings of the Institution of Mechanical Engineers - Part H). 2010;224:171- 91
81. Mleczko M, Dicker S, Wrenn S, Schmitz G. influence of microbubble shell chemistry on the destruction threshold of ultrasound contrast agent microbubbles. Acoustical Imaging. 2012 In Press
82. Doinikov A, Dayton P. Maxwell rheological model for lipid-shelled ultrasound microbubble contrast agents. Journal of the Acoustical Society of America. 2007;121:3331-40
83. Wrenn S, Dicker S, Small E, Maghnouj A, Hahn S, Mleczko M. et al. Microcapsules: Reverse Sonoporation and Long-lasting, Safe Contrast. Acoustical Imaging. 2012;31:81- 90
84. Small E, Willy M, Lewin P, Wrenn S. Ultrasound-induced transport across lipid bilayers: Influence of phase behavior. Colloids and Surfaces A: Physiochem Eng Aspects. 2011;390:40- 7
85. Krasovitski B, Kimmel E. Shear Stress Induced by a Gas Bubble Pulsating in an Ultrasonic Field Near a Wall. ieee transactions on ultrasonics, ferroelectrics, and frequency control. 2004;51:973-9
86. Marmottant P, Versluis M, de Jong N, Hilgenfeldt S, Lohse D. High-speed imaging of an ultrasound-driven bubble in contact with a wall: “Narcissus” effect and resolved acoustic streaming. Experiments in Fluids. 2006;41:147-53 doi:10.1007/s00348-005-0080-y
87. Overvelde M, Garbin V, Dollet B, de Jong N, Lohse D, Versluis M. Dynamics of Coated Microbubbles Adherent to a Wall. Ultrasound in Medicine and Biology. 2011;37:1500-8 doi:10.1016/j.ultrasmedbio.2011.05.025
88. Vos HJ, Dollet B, Versluis M, de Jong N. Nonspherical Shape Oscillations of Coated Microbubbles in Contact With a Wall. Ultrasound in Medicine and Biology. 2011;37:935-48 doi:10.1016/j.ultrasmedbio.2011.02.013
89. Mehier-Humbert S, Bettinger T, Yan F, Guy RH. Plasma membrane poration induced by ultrasound exposure: Implication for drug delivery. Journal of Controlled Release. 2005;104:213-22 doi:10.1016/j.jconrel.2005.01.007
90. Koshiyama K, Kodama T, Yano T, Fujikawa S. Structural change in lipid bilayers and water penetration induced by shock waves. Biophys J. 2006;91:2198-205
91. Leontiadou H, Mark A, Marrink S. Molecular Dynamics Simulations of Hydrophilic Pores in Lipid Bilayers. Biophys J. 2004;86:2156-64
92. Schroeder A, Kost J, Barenholz Y. Ultrasound, liposomes, and drug delivery: principles for using ultrasound to control the release of drugs from liposomes. Chemistry and Physics of Lipids. 2009;162:1-16 doi:10.1016/j.chemphyslip.2009.08.003
93. Dijkmans P, Juffermans L, Musters R, van Wamel A, Cate F, van Gilst W. et al. Microbubbles and ultrasound: from diagnosis to therapy. Eur J Echocardiography. 2004;5:245-56
94. Zarnitsyn V, Rostad C, Prausnitz M. Modeling Transmembrane Transport through Cell Membrane Wounds Created by Acoustic Cavitation. Biophys J. 2008;95:4124- 38
95. Nyborg W. ULTRASOUND, CONTRAST AGENTS AND BIOLOGICAL CELLS; A SIMPLIFIED MODEL FOR THEIR INTERACTION DURING IN VITRO EXPERIMENTS. Ultrasound in Medicine and Biology. 2006;32:1557- 68
96. Lin H-Y, Thomas JL. Factors Affecting Responsivity of Unilamellar Liposomes to 20 kHz Ultrasound. Langmuir. 2004;20:6100-6 doi:10.1021/la049866z
97. Pong M, Umchid S, Guarino AJ, Lewin PA, Litniewski J, Nowicki A. et al. In vitro ultrasound-mediated leakage from phospholipid vesicles. Ultrasonics. 2006;45:133-45 doi:S0041-624X(06)00345-3 [pii] 10.1016/j.ultras.2006.07.021 [doi]
98. Enden G, Schroeder A. A mathematical model of drug release from liposomes by low frequency ultrasound. Annals of Biomedical Engineering. 2009;37:2640- 5
99. Luk AS, Kaler EW, Lee SP. Phospholipase C-induced aggregation and fusion of cholesterol-lecithin small unilamellar vesicles. Biochemistry. 1993;32:6965-73
100. Nir S, Bentz J, Wilschut J, Duzgunes N. Aggregation and fusion of phospholipid vesicles. Progress in Surface Science. 1983;13:1-124 doi:10.1016/0079-6816(83)90010-2
101. Brown AC, Towles KB, Wrenn SP. Measuring raft size as a function of membrane composition in PC-based systems: Part II--ternary systems. Langmuir. 2007;23:11188-96 doi:10.1021/la7006342 [doi]
102. Brown AC, Towles KB, Wrenn SP. Measuring raft size as a function of membrane composition in PC-based systems: Part 1--binary systems. Langmuir. 2007;23:11180-7 doi:10.1021/la700633b [doi]
103. Brown DA, London E. Functions of lipid rafts in biological membranes. Annu Rev Cell Dev Biol. 1998;14:111-36 doi:10.1146/annurev.cellbio.14.1.111 [doi]
104. Towles KB, Brown AC, Wrenn SP, Dan N. Effect of membrane microheterogeneity and domain size on fluorescence resonance energy transfer. Biophys J. 2007;93:655-67 doi:S0006-3495(07)71317-6 [pii] 10.1529/biophysj.106.090274 [doi]
105. Troup GM, Tulenko TN, Lee SP, Wrenn SP. Detection and characterization of laterally phase separated cholesterol domains in model lipid membranes. Colloids and Surfaces B: Biointerfaces. 2003;29:217-31
106. Troup GM, Tulenko TN, Lee SP, Wrenn SP. Estimating the size of laterally phase separated cholesterol domains in model membranes with Förster resonance energy transfer: a simulation study. Colloids and Surfaces B: Biointerfaces. 2004;33:57-65
107. Prausnitz M, Lee C, Liu C, Pang J, Singh T, Langer R. et al. Transdermal transport efficiency during skin electroporation and iontophoresis. Journal of Controlled Release. 1996;38:205- 17
108. Yoshida N, Tamura M, Kinjo M. Fluorescence correlation spectroscopy: a new tool for probing the microenvironment of the internal space of organelles. Single Molecule. 2000;14:279- 83
109. Crank J. The mathematics of diffusion. New York, NY: Oxford University Press. 1975
110. Rosenberg R, Dan N. Controlling surface porosity and release from hydrogels using a colloidal particle coating. Journal of Colloid and Interface Science. 2010;349:498- 504
111. Rosenberg R, Dan N. Diffusion through colloidosome shells. Journal of Colloid and Interface Science. 2011;345:478- 82
112. Berg H. Random walks in biology. Princeton NJ: Princeton University Press. 1993
Author contact
![]() Corresponding author: Tel: 215.895.6694; Fax: 215.895.5837; Email: spw22edu.
Corresponding author: Tel: 215.895.6694; Fax: 215.895.5837; Email: spw22edu.
Citation styles
APA
Wrenn, S.P., Dicker, S.M., Small, E.F., Dan, N.R., Mleczko, M., Schmitz, G., Lewin, P.A. (2012). Bursting Bubbles and Bilayers. Theranostics, 2(12), 1140-1159. https://doi.org/10.7150/thno.4305.
ACS
Wrenn, S.P.; Dicker, S.M.; Small, E.F.; Dan, N.R.; Mleczko, M.; Schmitz, G.; Lewin, P.A. Bursting Bubbles and Bilayers. Theranostics 2012, 2 (12), 1140-1159. DOI: 10.7150/thno.4305.
NLM
Wrenn SP, Dicker SM, Small EF, Dan NR, Mleczko M, Schmitz G, Lewin PA. Bursting Bubbles and Bilayers. Theranostics 2012; 2(12):1140-1159. doi:10.7150/thno.4305. https://www.thno.org/v02p1140.htm
CSE
Wrenn SP, Dicker SM, Small EF, Dan NR, Mleczko M, Schmitz G, Lewin PA. 2012. Bursting Bubbles and Bilayers. Theranostics. 2(12):1140-1159.
This is an open access article distributed under the terms of the Creative Commons Attribution (CC BY-NC) License. See http://ivyspring.com/terms for full terms and conditions.