Theranostics
13.3
Impact Factor
- Current Issue
- Advance Articles
- Volume 16; 2026
- Volume 15; 2025
- Volume 14; 2024
- Volume 13; 2023
- Volume 12; 2022
- Archive
- Cover Images
- Cover Suggestion
- Special Issues
Top
INTRODUCTION
QD ASSEMBLY AND FUNCTIONALIZATION
QD AS A PASSIVE FLUORESCENT LABEL
QD "SMART PROBES"
QD ENABLED SINGLE MOLECULE...
UNCONVENTIONAL SENSING...
CONCLUSION AND FUTURE OUTLOOK
Acknowledgements
References
INTRODUCTION
QD ASSEMBLY AND FUNCTIONALIZATION
QD AS A PASSIVE FLUORESCENT LABEL
QD "SMART PROBES"
QD ENABLED SINGLE MOLECULE...
UNCONVENTIONAL SENSING...
CONCLUSION AND FUTURE OUTLOOK
Acknowledgements
References
International Journal of Biological Sciences
International Journal of Medical Sciences
 Global reach, higher impact

Theranostics 2012; 2(7):631-654. doi:10.7150/thno.4308 This issue Cite
Review
Quantum Dot Enabled Molecular Sensing and Diagnostics
Yi Zhang1, Tza-Huei Wang2 ![]()
1. Department of Biomedical Engineering, Johns Hopkins University School of Medicine, Baltimore, MD 21205, USA.
2. Department of Biomedical Engineering, Department of Mechanical Engineering, Sidney Kimmel Comprehensive Cancer Center, Center of Cancer Nanotechnology Excellence, Johns Hopkins University, Baltimore, MD 21205, USA.
Received 2012-3-1; Accepted 2012-3-31; Published 2012-7-4
Citation:
Zhang Y, Wang TH. Quantum Dot Enabled Molecular Sensing and Diagnostics. Theranostics 2012; 2(7):631-654. doi:10.7150/thno.4308. https://www.thno.org/v02p0631.htm
Other stylesAbstract
Since its emergence, semiconductor nanoparticles known as quantum dots (QDs) have drawn considerable attention and have quickly extended their applicability to numerous fields within the life sciences. This is largely due to their unique optical properties such as high brightness and narrow emission band as well as other advantages over traditional organic fluorophores. New molecular sensing strategies based on QDs have been developed in pursuit of high sensitivity, high throughput, and multiplexing capabilities. For traditional biological applications, QDs have already begun to replace traditional organic fluorophores to serve as simple fluorescent reporters in immunoassays, microarrays, fluorescent imaging applications, and other assay platforms. In addition, smarter, more advanced QD probes such as quantum dot fluorescence resonance energy transfer (QD-FRET) sensors, quenching sensors, and barcoding systems are paving the way for highly-sensitive genetic and epigenetic detection of diseases, multiplexed identification of infectious pathogens, and tracking of intracellular drug and gene delivery. When combined with microfluidics and confocal fluorescence spectroscopy, the detection limit is further enhanced to single molecule level. Recently, investigations have revealed that QDs participate in series of new phenomena and exhibit interesting non-photoluminescent properties. Some of these new findings are now being incorporated into novel assays for gene copy number variation (CNV) studies and DNA methylation analysis with improved quantification resolution. Herein, we provide a comprehensive review on the latest developments of QD based molecular diagnostic platforms in which QD plays a versatile and essential role.
Keywords: Quantum Dot, Diagnostics, Sensing, Nanosensor, Nanoassembly.
INTRODUCTION
One of the main goals in the rapidly growing field of nanotechnology is to develop novel nanoscale functional materials that uniquely differ in their physical and chemical properties as compared to bulk counterparts. Originally created with the motivation to investigate materials' behavior at molecular level [1], nanocrystals were soon born and have since triggered great interest. Semiconductor nanocrystals, or quantum dots (QDs), are among the most exciting and ubiquitous discoveries that have come out of the nanotechnology field. A QD is a cluster of a few hundred to thousands of atoms [2] arranged in binary (e.g. CdSe, CdTe, GaAs, InAs, AlN, SiC and etc.) or ternary compounds (e.g. InGaN, InGaP, InGaAs and etc.). The size of a QD typically ranges from 1 to 20 nm [2]. At such small scales, QDs exhibit a molecule-like behavior by interacting with light through electronic transition dipoles [1]. Upon excitation by a photon, a single electron is promoted from the valence band to the conduction band, creating an electron-hole pair (i.e. exciton). As the size of QDs become relatively small as compared to the bulk exciton Bohr radius, which is typically a few nanometer (~5.6 nm for CdSe) [1], the wave function of the exciton is confined in all three spatial dimensions at the QD boundary, thereby leading to a quantized energy level. The shift in energy level, otherwise described as an increase in the QD band gap, increases as the QD size decreases [3-5]. Such strong size dependencies facilitate the ability to fine tune the QD emission wavelength over almost the entire visible spectrum [1]. This amazing attribute of QDs make them ideal substitutes for conventional organic fluorophores [6]. The pros and cons of the QDs compared to the traditional fluorophore s are discussed in details in Ref. [6].
Since the first demonstration of QDs as a fluorescent label in biological systems [7, 8], there has been a trend of integrating functional nanomaterials in variety of biomolecular assays. Modern molecular biology techniques lay the foundation for molecular diagnostics which play an essential role in modern medicine [9]. Molecular diagnostics heavily rely on the measurements of physical and chemical parameters of clinical samples. This ultimately requires detailed inspections of biomolecules as well as their interactions with other molecules and the environment [9]. Fluorescence based methods suit the aforementioned goals perfectly by providing sensitive, reproducible, and quantitative detection of target molecules [6, 10-12].
QDs are able to improve the performance of fluoroassays by offering a number of benefits over traditional organic fluorophores, such as high brightness, longer fluorescence lifetime, better photostability, as well as narrow and symmetric emission spectrum. The excitation spectrum of QDs extends far into the UV region and hence multiple QDs can be excited with a single light source. As a result, up to 6 QD emission spectra can be combined without significant spectral crosstalk, which offers an unprecedented degree of multiplexing [13]. Also, the exceptional fluorescent properties of QDs make them an exceptional fluorescence resonance energy transfer (FRET) donor because of the avoidance of acceptor spectral bleed-through [14]. This is due to the fact that the excitation sources of QDs are far apart from the excitation spectrums of FRET acceptors, thereby avoiding direct excitation of the acceptor. Furthermore, narrow and symmetric emission spectra of QDs ensure high degree of FRET donor-acceptor spectral overlap and high FRET efficiencies, meanwhile avoiding donor spectral bleed-though caused by the asymmetric tailing of donor emission spectrum, which often occurs with organic fluorophores [6]. In addition, QDs can also be designed to function as a nanoscaffold, offering a large surface area as solid substrate for molecule adsorption. Consequently, multiple acceptors can be conjugated to a single QD. This increased acceptor to donor ratio gives rise to higher FRET efficiencies and detection sensitivities. The evergrowing interest in QDs also prompts studies on their non-photoluminescence properties, such as electrohydrodynamic [15], electrochemical [16, 17], and photoelectrical [18-20] properties. These new phenomena are carefully investigated and adapted to new molecular assays.
This review comments on the latest development of QD based sensing strategies and their applications towards molecular diagnostics. We begin with a brief discussion on the use of a QD as a "passive" fluorescent tag that replaces traditional organic fluorophores in many conventional assays. Then we focus on "smart" QD probes, such as quantum dot fluorescence resonance energy transfer (QD-FRET) sensing system, QD electron transfer sensing system, QD photochemical sensing system QD single molecule detection (SMD) platform and QD barcode that are designed to achieve high-sensitivity, high-throughput and multiplexed detection. Other non-photoluminescence properties of QDs are also examined for their applications in unconventional molecular assays. In summary, we provide a detailed evaluation of QD as a versatile participant in various types of molecular sensing platforms.
QD ASSEMBLY AND FUNCTIONALIZATION
QDs can be synthesized in non-polar solvents [21, 22], aqueous solutions [2] or on a solid substrate [23]. Although synthesis directly in aqueous solutions result in water-soluble QDs, the crystalline quality thus the emission bandwidth of the QD is compromised [24]. On the other hand, synthesis in non-polar solvents produces hydrophobic QDs with high degrees of monodispersity (<5%) [21], which further ensures a narrow emission bandwidth. Furthermore, a common practice is to passivate QDs with an inorganic layer, forming a core-shell structure, e.g. CdSe QD with ZnS shell (Fig. 1). By incorporating a passivation shell, there is a reduction in the number of surface defects at the core-shell interface, which ultimately enhances QD luminescence by improving its quantum yield and narrowing the emission spectrum [25]. Moreover, the shell also stabilizes the QD core, preventing core materials such as Cd and Se from leaching out, thus reducing cytotoxicity [25]. Therefore, to make QDs suitable for biological applications, which are typically in an aqueous environment, the surface of QDs needs to be rendered hydrophilic with an additional organic capping layer with exposed reactive groups for bioconjugation (Fig. 1). (Methods for QD surface modification are reviewed extensively in Refs. [26-29]).
To participate in molecular sensing, simple yet robust conjugation schemes are required to link desired probes to QDs. The organic capping layer on a QD surface possesses reactive groups, allowing direct conjugation of target molecules through covalent linkage using variety of chemistries (See Refs. [26-29] for detailed review). A popular approach uses biotin-avidin (including neutravidin and streptavidin) interaction as a universal linkage that connects desired probes to the QD [30]. Avidins or biotins are covalently attached to QD surface while probes such as oligonucleotides, antibodies, or aptamers are connected to the conjugate. The high affinity of biotin-avidin interaction ensures strong linkage between the QD and probes, providing a rapid and strong conjugation. Another widely used tactic is to tag the desired molecule with a polyhistidine peptide by co-expression [31] or chemical ligation [32-34]. Conjugation is realized through self- assembly of the polyhistidine tag on the zinc-rich QD surface via metal-affinity coordination [31-35].
Figure 1
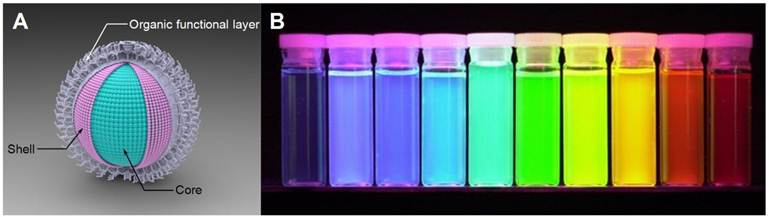
A) Schematic illustration of QD structure. B) QDs display distinctive colors under UV excitation. Figure 1b is adapted with permission from [36], copyright 2001 Nature Publishing Group.
QD AS A PASSIVE FLUORESCENT LABEL
Early QD applications within biological contexts centered on incorporating QDs into traditional bioanalytical assays as superior substitutes for organic fluorophores. This was done in the hopes that the unique optical properties of QDs such as high brightness and excellent photostability could greatly improve assay performance.
Immunoassay
Chan et al. first demonstrated QDs as fluorescent reporters in an immunoassay [8]. QDs that were conjugated to immunoglobin G (IgG) showed extensive aggregation in the presence of a specific polyclonal antibody that recognized the Fab fragment of the immunoglobin. In contrast, QD-IgG sensors incubated with bovine serum albumin (BSA) as the negative controls were well dispersed with no signs of aggregation. Later, similar approaches were applied to detect various other protein targets. Geho et al. used streptavidin conjugated QDs as a universal fluorescent indicator in a reverse phase sandwich immunoassay [37]. This assay began with preparing whole cell lysates that were then fixed on a nitrocellulose slide. Primary antibodies that recognized the extracellular signal-regulated kinases (ERK) and phosphoERK were then incubated with the slides. The presence of targets were confirmed by incubating with a QD655 reporter conjugated to the secondary antibody (QD655 denotes QD with peak emission at 655nm. Same notation is used throughout the paper.). As another example, Goldman et al. performed multiplexed detection of protein toxins cholera toxin (CT) and staphylococcal enterotoxin B (SEB) [30]. Anti-CT and anti-SEB antibodies were conjugated to QD535 and QD595 respectively. Target toxins were first immobilized by primary antibodies to a microtiter plate and then recognized by the QD-conjugated antibodies to form a sandwich immunoassay. The authors further expanded the assay for quaternary toxin analysis using four different QDs [38]. Because the emission spectra of the selected QDs were not well resolved, a deconvolution algorithm was implemented to better determine the concentration of each species. This process assumed that the composite spectrum was a superposition of individual QD spectrum. Hu et al. applied the QD-based immunoassay to detect cancer biomarkers from human serum samples on a microfluidic protein array with an estimated detection limit of 250 fM [39]. QDs have also improved the sensitivity of Western blot analysis [40-42]. Ornaberg et al. managed to detect 20 pg of p42 mitogen-activated phosphokinase (p42 MAPK) protein within a Western blot using QD conjugated antibodies [42] and demonstrated excellent quantification capabilities. Shin et al. replaced QD conjugated antibodies with QD functionalized RNA aptamers to detect His-tagged recombinant proteins using Western blot [43].
Nucleic Acids Detection
QDs have also been effectively conjugated to oligonucleotides to serve as fluorescent probes for target specific nucleic acid detection. Gerion et al. successfully identified single nucleotide polymorphism (SNP) and single base deletion of tumor suppressor gene P53 on a cDNA microarray with QDs conjugated DNA oligonucleotides as hybridization probes [44]. Both hybridization and detection took place at room temperature with the signal-to-noise ratio above 10. On the same platform, the authors also demonstrated multiplexed detection of hepatitis B and C viruses using DNA probes labeled with two different QDs. In another novel application, Karlin-Neumann et al. combined molecular-inversion probes (MIP) [45, 46], a GeneChip® universal tag array, and QDs to genotype more than 10,000 SNPs in a single reaction [46]. MIPs with SNP recognition sequences at both termini were hybridized to target genomic DNA, forming an open circular structure adjacent to the SNP site. The gapped MIP was filled upon addition of nucleotides complementary to the SNP. The probe was then circularized by a ligation reaction, which provided allelic identification. Each MIP contained a unique tag sequence that hybridized to a specific location on the universal tag array. Four types of QDs were functionalized so that each QD only bound specifically to one deoxynucleotide incorporated in the SNP sites (i.e. either A, C, G or T). QDs have served as excellent alternatives to organic dyes in SNP microarray applications due to their high accuracy and improved signal-to-noise ratio. Other groups further enhanced the signal-to-noise ratio of DNA microarrays through surface plasma enhanced QD emission [47, 48].
Imaging
Great effort has been put into adapting QDs as novel fluorescent tags to imaging applications. Many labeling techniques, whether specific or nonspecific, have been extensively investigated. Detailed reviews on topics regarding QD-based imaging applications can be found in Refs. [26-29].
QD "SMART PROBES"
As a luminescent probe, QDs outperform traditional organic fluorophores in many aspects due to their excellent optical properties. In addition, a QD can act as a nanoscaffold, thereby providing a structural platform and functional solid substrate for molecule adsorption and interaction. Recently, QDs have been used as active components of complex biosensing platforms which often rely on nonradiative energy transfer between a QD and other organic fluorophores or nanoparticles. Many of these QD-based nano-biosensing techniques enable homogeneous and wash-free assays, thereby eliminating stringent washing steps to greatly simplify assay protocols.
Quantum Dot Mediated Fluorescence Resonance Energy Transfer
Fluorescence resonance energy transfer (FRET) is an energy transfer process via dipole-dipole interactions between a fluorescent donor-acceptor pair. FRET is highly dependent on the distance between the acceptor and donor fluorophores. Only when the donor and acceptor molecules are in very close proximity, is there efficient energy transfer from donor to acceptor (Equation 1). As a result of this spatial relationship, FRET is an invaluable tool for studying molecular interactions.
(1)
where E is the FRET efficiency that depends on the donor-acceptor separation distance r and the Förster distance R0 .
QDs have highly advantageous properties that make them excellent FRET donors as compared to organic fluorophores. Great effort has been put into understanding the basic physical properties of QD-FRET [27, 49, 50]. To ensure high FRET efficiency, a FRET pair is selected to ensure maximum spectral overlap between the donor emission spectrum and the acceptor excitation spectrum. Due to the small Stokes shift of most organic fluorophores, excitation sources often directly excite acceptors to certain extent. Moreover, the emission spectra of traditional organic donors are usually asymmetric, tailing into the long wavelength spectrum. This usually coincides with the acceptor emission spectrum, causing donor bleed-through. In both cases, undesired signals in the acceptor channel increase the background noise and impair the sensitivity of FRET-based molecular sensing. In contrast, QDs have large "effective" Strokes shift and hence can be excited with a short-wavelength light source. These light sources, which are usually placed in the UV region, are far away from acceptor emission spectrum, thereby significantly minimizing direct acceptor excitation. Additionally, because the emission spectrum of QD is narrow and symmetric, it can be placed close to the acceptor excitation spectrum to ensure maximum spectral overlap meanwhile minimizing donor spectral bleed-through. On one hand, compared to FRET between two organic fluorophores, the FRET efficiency between the QD and the organic fluorophore is relatively low in a single-donor-single-acceptor construct due to the large size of the QDs which increases the distance between the donor and the acceptor [51]. On the other hand, QDs offer large surface area for molecular adsorption, allowing multiple acceptors to concentrate on their surface. The increased acceptor to donor ratio significantly enhances the FRET efficiency.
Detection of Specific Targets
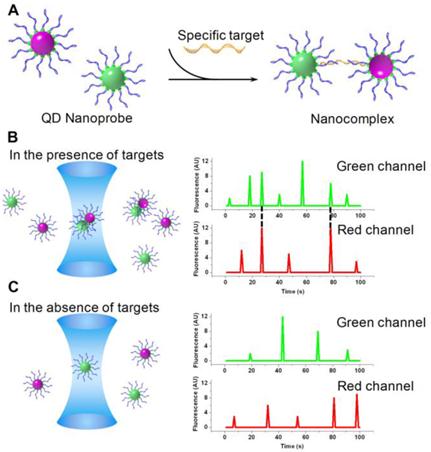
A wide variety of applications have been derived based on QD-FRET. One major area of interest is implementing QD-FRET for genetic and epigenetic analysis. Zhang et al. designed a QD-FRET sensor for sequence-specific DNA detection [52]. Probes labeled with biotin and Cy5 were allowed to hybridize to a DNA target, forming a sandwich hybrid (Fig. 2A) that self assembled on the QD via biotin-streptavidin interactions. The self-assembled nanosensor detected the presence of targets through FRET signals, which was indicated by a combination of fluorescent signals from both the QD and Cy5 channels. In the absence of targets, only signals from the QD channel were detected (Fig. 2B). By incorporating DNA ligation, the QD nanosensor was later applied to detect a KRAS point mutation. Two probes labeled with biotin and Cy5 were designed to hybridize adjacent to the mutation site. The 3' terminal of the Cy5-labeled reporter probe included a discrimination site that recognized the mutation. The ligation reaction joined the fully matched probes into a single DNA strand with dual labels. QDs were then introduced to detect the ligated DNA strands through QD-FRET. The nanosensor successfully identified mutations in samples from patients with ovarian serous borderline tumors (SBTs). The performance outmatched those from molecular beacon probes (Fig. 2C). Bailey et al. developed a QD-FRET based methylation analysis named MS-qFRET [53]. Promoter hypermethylation of tumor suppressor genes is an important cancer biomarker valuable for early cancer diagnostics [54-58]. To assess promoter methylation status, genomic DNA was first subjected to bisulfite conversion which converted unmethylated cytosines to uracils while leaving methylated cytosines unaltered. Then a pair of methylation specific primers labeled with biotin or Cy5 respectively, were introduced to amplify the target sequence using methylation specific PCR [59]. Amplicons were terminated by biotin at one end and Cy5 on the other. They self assembled onto QDs through biotin-streptavidin interactions, bringing the Cy5 fluorophore in very close proximity to the QD. Upon proper excitation, the presence of methylated alleles was confirmed by an increase in the Cy5 emission and a decrease in the QD emission intensity, as expected from FRET. Quantification of DNA methylation level was achieved using an arbitrary q-score calculated based on intensities at the peak emission of QD605 and Cy5 (605nm and 670nm respectively) (Fig. 2D). MS-qFRET successfully detected 15 pg of the methylated allele in the presence of a 10,000-fold great number of unmethylated alleles. The high sensitivity of MS-qFRET enabled a direct, one-step DNA methylation detection assay that overcame challenging patient sputum conditions that otherwise would have required nested PCR. MS-qFRET was also applied to evaluate the effectiveness of DNA demethylation drug in cell lines (Fig. 2E) and patients with myelodysplastic syndromes (MDS) (Fig. 2F) who are subjected to epigenetic treatment. MS-qFRET has since been improved by incorporating Cy5 conjugated dCTP, resulting in multiple Cy5 molecules per amplicon [60]. As a result, the increased acceptor to donor ratio greatly enhanced FRET efficiency thus detection sensitivity. Bakalova et al. employed QD-FRET to select small-interfering RNA (siRNA) for RNA interference (RNAi) [61]. siRNA was covalently linked to QDs using carbodiimide chemistry. Target mRNA molecules were amplified in vitro in the presence of Cy5 conjugated dCTP. The Cy5 labeled mRNA recognized and hybridized to the siRNA sequence. siRNA sequences were then screened based on FRET signals. Algar et al. carried out a series of studies on solid phase nucleic acid hybridization assays using the QD-FRET nanosensor platform [62-64]. To do so, QDs were first immobilized on the surface of an optical fiber. Biotinylated oligonucleotide probes were fixed on the solid substrate via a biotin-neutravidin bridge. Target DNA molecules labeled with fluorescent acceptors induced FRET upon hybridization to the surface immobilized probes. Luminescence sources excited QD through total internal reflection within the optical fiber. The optical fiber based solid phase QD-FRET platform demonstrated multiplexing capability using a single-donor/multi-acceptor scheme or multi-donor/multi-acceptor scheme [63] for SNP screening [62].
Figure 2
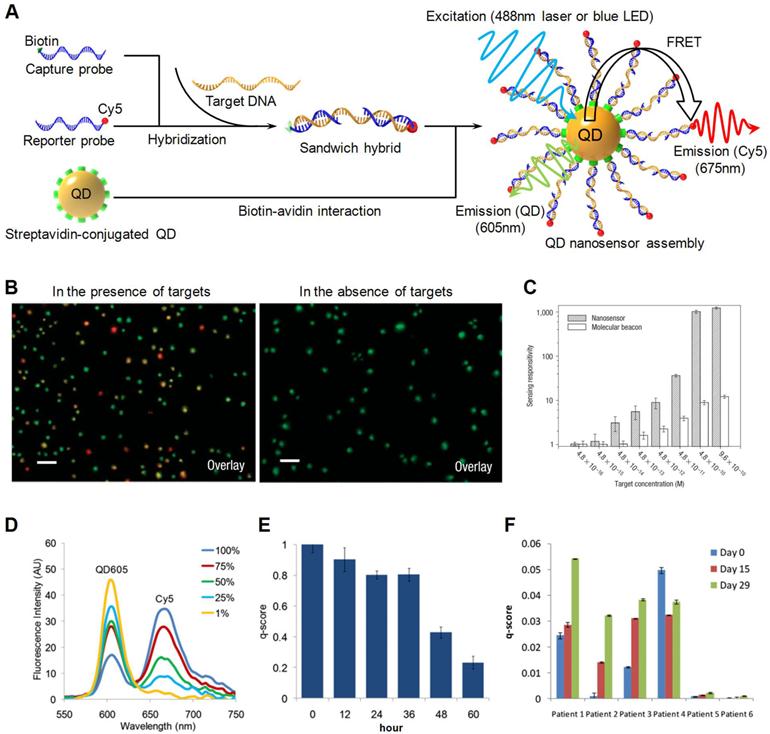
Schematic illustration of QD-FRET. A) Two probes labeled with biotin and Cy5 respectively hybridize to the target and form a sandwich hybrid. The hybrids self assemble onto the QD surface to form a QD-FRET nanosensor. B) Fluorescent images of nanosensors in the presence of targets (left) and in the absence of targets (right). C) Comparison between QD-FRET nanosensor and molecular beacon probe. D) Quantification of DNA methylation level using QD-FRET. E) DNA methylation level of demethylation drug treated cell lines monitored using QD-FRET in a course of 60 hr. F) DNA methylation level of MDS patients monitored using QD-FRET in a course of 30 days. For each patient, the DNA methylation was measured pretreatment at day 0, and at day 15 and day 29 post-treatment. Figure 2b and 2c are reprinted with permission from [52], copyright 2005 Nature Publishing Group. Figure 2d-e are reprinted with permission from [53], copyright 2009 Cold Harbor Laboratory Press.
Figure 3
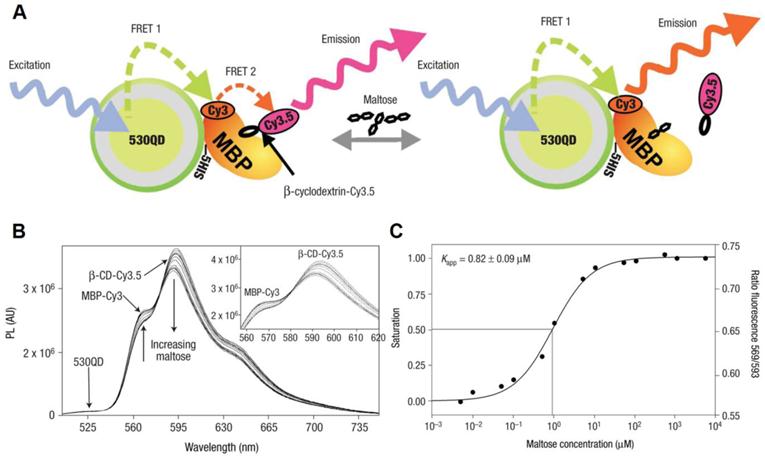
QD-FRET for maltose detection. A) Schematic of a 530QD-MBP-Cy3-β-CD-Cy3.5 maltose sensor assembly. A 530-nm QD is surrounded by ~10 MBPs (only one shown for clarity), each monolabeled with Cy3 at cysteine 95 (maximum absorption ~556 nm, maximum emission ~570 nm). Specifically bound β-CD-Cy3.5 (maximum absorption ~575 nm, maximum emission ~595 nm) completes the QD-10MBP-Cy3-β-CD-Cy3.5 sensor complex. Excitation of the QD results in FRET excitation of the MBP-Cy3, which in turn FRET excites the β-CD-Cy3.5. Added maltose displaces β-CD-Cy3.5 leading to increased Cy3 emission. B) Maltose sensing of 530QD-MBP-Cy3-β-CD-Cy3.5. (Inset) Close-up of the MBP-Cy3 and β-CD-Cy3.5 fluorescence portions. Note the isosbestic point at ~581 nm. A shift of ~4nm in β-CD-Cy3.5 maximum emission was observed for the MBP-Cy3-bound form attributable to bound dye rigidity and inner filtering. C) Transformation of titration data. The left axis shows fractional saturation and the right axis shows the ratio of PL at 593 nm/569 nm. Assuming the range of useful measurement to be between 10 and 90% saturation, this translates into a sensing range of ~100 nm to 10 μM maltose. Reprinted with permission from [65], copyright 2003 Nature Publishing Group.
QD-FRET has also been applied to detect other specific targets. A two-step QD-FRET maltose sensor based on competitive ligand binding was reported by Medintz et al [65]. Cy3 labeled maltose binding protein (MBP) adsorbed to a QD surface through polyhistidine tag (Fig. 3A). A maltose competitor β-cyclodextrin (β-CD), which competed with maltose for the same saccharide binding pocket on MBP, was labeled with Cy3.5. In the absence of maltose, Cy3.5-β-CD bound to QD530-MBP-Cy3 and formed a complex. Excitation of QD530 activated Cy3 which functioned as a relay that in turn transferred energy to Cy3.5. In the presence of maltose, the binding of unlabeled maltose displaced Cy3.5-β-CD, breaking the second FRET chain and leading to the increase in Cy3 intensity accompanied by decreased Cy3.5 emission (Fig. 3B). Binding constant determined using two-step FRET agreed with previous results (Fig. 3C). A similar QD-FRET competitive assay was developed to detect 2,4,6-trinitrotoluene (TNT) in an aqueous environment [66]. Anti-TNT specific antibody fragments were immobilized on a QD surface via a polyhistidine tag. The TNT concentration was determined by observing the change in QD photoluminescence caused by FRET, which depended on the competition between TNT and a dye-labeled TNT analogue. Willard et al. linked QDs to tetramethylrhodamine (TMR)-conjugated streptavidin via a biotin labeled bovine serum albumin (bBSA). They then studied biotin-streptavidin interactions using QD-FRET. The authors proposed FRET was the major energy transfer mechanism, yet other factors also contributed to the quenching of the QD signal. Snee et al. constructed a QD-FRET pH sensor by introducing pH sensitive fluorophores as FRET acceptors [67]. The squaraine dye, whose molar distinction coefficient was pH dependent, was covalently linked to QDs. At pH of 6, squaraine, which has a large absorption coefficient, exhibited high emission through QD-FRET. As the pH was increased to 10, the absorption coefficient of squaraine significantly dropped and the emission peak was no longer visible. Suzuki et al. presented a similar QD-FRET sensor using fluorescein as a pH dependent acceptor [68]. Prasuhn et al. built a calcium sensor based on QD-FRET [69]. A special dye called CaRbCl was conjugated to a peptide immobilized on a QD surface. Pendent carboxyl groups of CaRbCl interacted with Ca2+ and significantly changed the quantum yield of the dye, altering the QD-FRET efficiency. Although the sensor was designed for Ca2+ sensing, it was able to detect other divalent and monovalent ions, though with different responsiveness.
Figure 4
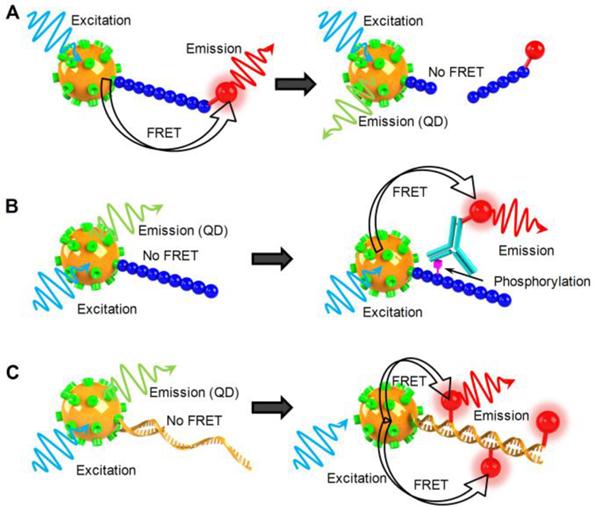
Schematic illustration of QD-FRET nanosensor for analysis of enzyme activity. a) QD-FRET sensor for the study of protease. b) QD-FRET sensor for the study of protein kinase. c) QD-FRET sensor for the study of DNA polymerase.
Examine Enzyme Activity
FRET has long been an indispensable tool for probing molecular interactions. Lately, there has been a trend of utilizing QD-FRET to monitor various enzymatic activities. QDs can serve as nanoscaffolds to immobilize enzymes or the substrates of enzymes on the QD surface. Meanwhile, the QD also functions as signal transducer that reports information regarding molecular structure, conformation, and interaction through the QD-FRET mechanism.
Proteases were one of the earliest enzymes studied by QD-FRET nanosensors. Medintz et al. immobilized fluorophores or quencher labeled peptides on QDs via polyhistidine tags to form QD-peptide nanosensors [34]. The photoluminescence of these QD nanosensors were quenched by the proximal FRET acceptor via a peptide linker that contained sequences recognizable by caspase-1, collagenase, or chymotrypsin. Upon recognition by the corresponding enzyme, the substrate peptide was specifically cleaved to release the acceptor fluorophore from the QD-peptide nanoassembly, leading to the recovery of QD photoluminescence (Fig. 4A). The Michaelis constant Kd and maximum reaction rate Vmax were estimated from a Michaelis-Menten plot, and the results agreed reasonably well with previously reported values. The authors also examined inhibitor effects on proteolytic activities. Either thrombin alone or together with a thrombin inhibitor was added to the peptide conjugated QD-FRET sensor. The inhibitor decreased the activity of thrombin by covalently and irreversibly modifying thrombin's active site. The inhibitory mechanism was experimentally confirmed by the Lineweaver-Burk graph as the plots for both cases shared the same Km but different Vmax. Sapsford et al. monitored botulinum neurotoxin (BoNTs) activity using a similar QD-FRET sensing system [70]. BoNT serotype A light chain (LcA) cleaves specific regions of synaptosomal-associated protein 25, which leads to neuroparalysis. The peptide substrate of BoNT was labeled with Cy3 and conjugated to QDs. A caspase 3 QD-FRET sensing system was constructed by tagging the peptide substrate with Texas red and covalently conjugating it to QDs [69]. Instead of using organic fluorophores as FRET acceptors, Boeneman et al. coexpressed a fluorescent protein mCherry with the peptide substrate for caspase 3 sensing [31]. Suzuki et al. prepared a recombinant GFP mutant containing a trypsin recognition sequence for the study of trypsin activity using QD-FRET [68], which led to an interesting observation. Rather than changing the QD photoluminescence, cleavage by trypsin shifted the entire emission spectrum.
Protein kinases are a group of enzymes that regulates vital cell functions through phosphorylation events by activating or deactivating a wide range of downstream enzymes. Using a QD-FRET sensing system, Ghadiali et al. studied the activity of nonreceptor tyrosine kinases Abl and Src [71]. Peptide substrates were immobilized on QD surfaces. After phosphorylation, an Alexa647 labeled phosphotyrosine specific monoclonal antibody was introduced to tag the phosphoryl group with FRET acceptors (Fig 4B). The degree of phosphorylation was determined by the ratio of acceptor/donor emission intensities. The same system was also used to quantitatively measure enzyme inhibitor potency through staurosporine titration in order to to evaluate the potential of a QD-FRET kinase sensing system as a drug-screening platform.
Another group of enzymes of great interest are those that interact and modify nucleic acids such as DNA and RNA. These incredibly important enzymes have formed the basis of modern molecular biology. A number of recent studies exploited the advantages of QD-FRET nanosensors to investigate the activities of DNA modification enzymes. Huang et al. developed a staphylococcus aureus sensor by detecting the micrococcal nuclease (MNase) biomarker using QD-FRET [72]. ROX labeled single stranded DNA (ssDNA) were conjugated to QDs through biotin-streptavidin interaction, forming a QD-ssDNA sensor. MNase could then cleave the surface immobilized ssDNA, setting the ROX dye free and breaking the FRET pairing. As a result, the presence of MNase was indicated by the decreased emission of ROX accompanied by the recovery of QD emission. The ssDNA-QD-FRET sensor was applied to monitor MNase concentrations in staphylococcus aureus cell cultures. The QD-FRET results matched the expected concentrations at various growth phases of the bacterial cultures. Suzuki et al. reported a DNase QD-FRET sensor constructed in a similar fashion by conjugating dye labeled double stranded DNA (dsDNA) to QDs [68].
Apart from "cleavage-based" enzymes, other families of enzymes involve reactions that add functional groups or monomers to existing nucleic acid templates. They are important for DNA replication, repair, transcription or signal transduction. The "addition reactions" facilitate the incorporation of fluorophores to target molecules, enabling a variety of fluorescence detection schemes. For example, Suzuki et al. employed QD-FRET to study polymerase activity [68]. A biotin labeled template was generated by asymmetric PCR and pre-annealed to primers before assembling onto QD surfaces (Fig. 4C). The primer was elongated with Klenow fragments in the presence of 4 normal dNTPs with additional Alexa532 labeled dUTPs. Alexa532 was incorporated into the DNA-QD nanoassembly through polymerization, and QD-FRET signals were used as a measure of polymerase activity. Patolsky et al. performed the same study using a similar QD-FRET sensor [73]. A surface immobilized thiolated primer was used to capture and amplify M13Φ bacteriophage DNA. Once again, QD-FRET was monitored over the course of 2 hrs. As the reaction proceeded, the QD emission was gradually quenched with a steady increase of Texas Red emission. The same group also monitored telomerase activity using a similar sensor design [73]. Template DNA was directly conjugated to QDs. The telomerization reaction incorporated Texas Red labeled dUTP and activated energy transfer. FRET efficiency was discovered to increase with time as the reaction proceeded. The authors demonstrated the time dependence of QD-FRET in enzymatic reactions, suggesting great potential for QD-FRET nanosensors as real-time fluorescent reporters.
Tracking intracellular gene delivery
One important aspect of gene therapy is the delivery of therapeutic agents across cellular membrane into the cytoplasm or designated intracellular compartments. Cellular uptake of exogenous substances is accomplished through a series of internal mechanisms. In particular, foreign DNA is not efficiently transported across the cell membrane. As a result, genes are often packaged in "vectors" to increase their delivery efficiency. Non-viral vectors bundle DNA into polymeric nanoscaffolds and transfer genetic cargo into the intracellular environment. For example, cationic polymers bind DNA to form polymer-DNA nanocomplexes through electrostatic interaction. One major challenge of non-viral vector based gene delivery is that the stability of the nanocomplex must be cautiously optimized since either pre-mature disintegration or over stability would impair the transfection efficiency and render the gene therapy ineffective. Therefore, understanding the mechanism and kinetics of intracellular trafficking and unpacking of these nanocomplexes is crucial for designing the optimal gene carriers. QD-FRET nanosensors are ideal for examining the integrity of nanocomplexes in vivo because of their ability to monitor reaction kinetics in homogenous conditions. Ho et al. built a QD-FRET sensor with chitosan-DNA nanocomplexes by conjugating QD605 to plasmid DNA (pDNA) and tagging chitosan polymer with Cy5 [74]. The nanocomplex closely packed the QD and Cy5 within a confined space, facilitating energy transfer (Fig. 5). QD-FRET signals did not only track the location of the nanocomplexes as they crossed the cellular membrane but also helped monitor the unpacking of nanocomplexes after cellular uptake. Chen et al. applied the same system to quantitatively compare three polymer gene carriers, chitosan, polyethylenimine (PEI) and polyphosphoramidate (PPA) [75]. As the polymer carrier disintegrated, pDNA was released into cellular compartments, leading to decreasing FRET intensity. The distribution of free pDNA was determined by analyzing the FRET efficiencies of individual nanocomplexes in various cellular compartments. The overall unpacking process was then modeled as a first-order reaction. Chen et al. expanded the capability of this system and created a two-step QD-FRET sensor to not only monitor the disintegration of the polymer carrier but also the degradation of the DNA [76]. In addition to the QD and Cy5 labeling described earlier, pDNA was stained with intercalating dye. The intact nanocomplex had all three fluorophores in close proximity with the intercalating dye serving as a FRET relay. The first FRET occurred between QD525 and the intercalating dye, which in turn transferred energy to Cy5 in the second FRET. The unpacking of pDNA from the carrier then switched off QD-FRET. However, the signal from the intercalating dye was still detectable as long as the pDNA remained intact. Recently, the same QD-FRET system was applied to evaluate gene delivery efficiency of a micelle vector [77] and to compare the performance of lipoplex and polyplex vectors for gene delivery [78].
QD-FRET was also applied to track intracellular drug delivery. Bagalkot et al. tracked the delivery of doxorubicin (Dox) using a QD based bi-FRET system [79]. A PSMA aptamer was tagged to a QD. Dox then intercalated the aptamer and induced the quenching of the QD. In addition, Dox simultaneously quenched the QD through a Bi-FRET process. The QD-Aptamer-Dox complex was delivered into cells via PSMA mediated endocytosis. The release of Dox from the nanocomplex recovered the fluorescent signals and enabled the tracking of intracellular drug delivery.
Figure 5
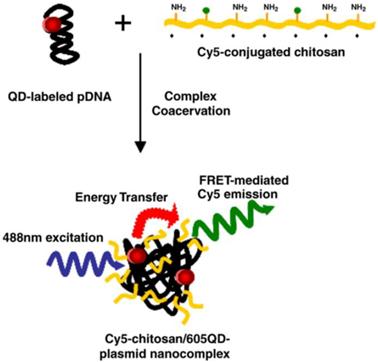
pDNA and chitosan were labeled with 605QD and Cy5, respectively. Condensation of DNA and chitosan by complex coacervation formed QD-FRET nanocomplexes. Upon excitation at 488 nm, QD-FRET-mediated Cy5 emission (pseudo-colored green) indicates a compact and intact nanocomplex. Reprinted with permission from [74], copyright 2006 Elsevier B.V.
QD as FRET Acceptor
QDs are commonly perceived as an efficient FRET donor due to its narrow and symmetric emission band which minimizes donor spectral bleed-through. Furthermore, QDs are not considered ideal FRET acceptors because their excitation spectra are extremely broad and extend deep into the UV region. Any attempt of using QDs as FRET acceptor would inevitably cause direct QD excitation, leading to notable acceptor bleed-through. The only way to resolve the fluorescent emission by direct excitation from that induced by FRET is to measure the difference in fluorescence life time. Since photoexcitation does not offer straightforward FRET measurements, alternative donor sources are sought for transferring energy to QDs.
Bioluminescence resonance energy transfer (BRET) is one QD-FRET variations in which QDs are designed to serve as FRET acceptors. A bioluminescence protein Renilla luciferase (Luc8) was conjugated to a QD. In the presence of Luc8 substrate, bioluminescent energy is released from Luc8 through an oxidation reaction and then transferred to the QD through BRET [80-82]. A BRET based sensor was designed to analyze the enzyme activity of matrix metalloproteinases (MMPs) whose function involved degrading the extracellular matrix. MMPs are found to be upregulated in various types of human cancers [80]. A short peptide consisting of a MMP-2 substrate and a polyhisitidine tag were fused to Luc8. The fusion protein self assembled onto QD surface via the polyhistidine tag, which then brought Luc8 complexes close to the QDs. Upon the addition of Luc8 substrate coelenterazine, bioluminescence from Luc8 was observed with emission peak centering at ~480nm. The energy transfer between Luc8 and QD alone was inefficient as evidenced by the weak emission of the QDs. However, once Ni2+ ion was supplemented to the reaction, BRET efficiency was significantly enhanced. The enhancement seemed to be very specific to Ni2+ as other divalent ions did not have similar effects. To detect MMP-2, the fusion protein was digested with MMP-2 during which the peptide segment containing the polyhistidine tag was cleaved. As a result, the fusion protein could not bind to the QD, thereby preventing BRET from taking place. The BRET MMP-2 sensor exhibited exceptional specificity and sensitivity, capable of detecting 2 ng/mL MMP-2. So et al. also demonstrated the same BRET sensor as a self -illuminating source for in vivo imaging [81].
Chemiluminescence is another alternative energy source that serves as a FRET donor. For example, Luminol is a chemiluminescent reagent that is activated by oxidants such as H2O2. The reaction requires a catalyst to decompose H2O2 into H2O and O2. The hemin/G-quadruplex horseradish peroxidase (HRP) mimicking catalytic nucleic acids (DNAzymes) were discovered to generate chemiluminescence through catalyzing the oxidation of luminol by H2O2 [83, 84]. Freeman et al. included aptamer domains into the DNAzyme subunits [85]. One of the aptamer subunits was conjugated to a QD. In the presence of aptamer targets, ATP or Hg2+ in this case, the DNAzyme subunits self assembled into active hemin/G-quadruplex DNAzyme structures and promoted the chemiluminescence resonance energy transfer (CRET) by catalyzing luminol emission. As shown in Figure 6A, nucleic subunits included domain I and II of the HRP mimicking DNAzyme, as well as domain V and VI of an anti-ATP aptamer. In the absence of ATP, the two subunits are not able to form a stable complex. However, in the presence of ATP, the aptamer domains binds to ATP and the resulting complex leads to the formation of a hemin/G-quadruplex that catalyzes the chemiluminescent reaction and gives rise to CRET. In contrast to FRET, the emission intensities of donors and acceptors increased or decreased concurrently because the amount of energy transferred to the QD was proportional to the chemiluminescent energy available (Fig. 6B). QD-CRET sensors were also configured to detect specific DNA sequences (Fig. 6C). A DNA hairpin structure consisting of a few functional domains were conjugated to QDs. The DNAzyme forming domain was blocked in the presence of the hairpin loop. The sequence recognition domain resided in the loop. As the target DNA hybridized to the recognition sequence and opened the hairpin, the DNAzyme forming domain was freed, leading to the self assembly of a hemi/G-quadruplex DNAzyme. DNA hairpins with three different target recognition sequences were conjugated to QD490, QD560 and QD620 respectively to form three QD-CRET DNA probes. Upon hybridization to their respective targets, Hemin and H2O2 were added to induce CRET. The presence of targets was indicated by emission of specific QDs probes through CRET. With the proposed QD-CRET sensor, the authors successfully resolved three targets in a multiplexed format (Fig. 6D).
Although transferring energy to QDs through a photoluminescent donor would cause acceptor spectral bleed-through, QD signals resulting from FRET can still be extracted from the background of QD emission. It is achievable using time-resolved fluorescence because of the difference in luminescence decay time between direct emission and emission through FRET. Hildebrandt et al. and Charbonnière et al. used Lanthanides such as Eu and Te as photoluminescent donors and QDs as FRET acceptors for time-resolved fluoro-immunoassays [86, 87]. Other donor options have also been explored. Anni et al. evaluated blue emitting polymers [88]. In addition, Kagan et el. [89] and Algar et al. [90] experimented with QD to QD FRET sensors.
Figure 6
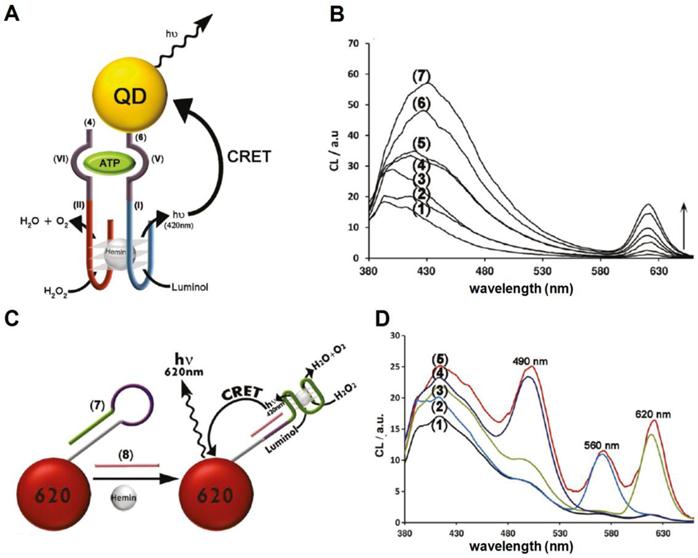
QD-CRET nanosensor. A) QD-CRET detection of ATP by two subunits consisting of the conjugated anti-ATP and HRP-DNAzyme subunits. Upon the recognition of ATP by the aptamer, the chemiluminescence of luminol is activated and the energy is transfer to QD. B) Luminescence spectrum corresponding to the CRET signal of the QDs at λ= 612 nm in the absence of ATP, curve (1), and in the presence of different concentrations of ATP: (2) 1.25*10-7 M, (3) 1.25 *10-6 M, (4) 5*10-6 M, (5) 12.5 *10-6 M, (6) 5 *10-5 M, (7) 1 *10-4 M, C) QD-CRET detection of specific DNA sequence. The hybridization of DNA target to the hairpin opens the loop and allows the formation of hemin/G-quadruplex which gives rise to QD-CRET signals. D) (1) The luminescence spectrum of QDs mixture corresponding to the CRET signal in the absence of DNA targets; (2) in the presence of the target 1; (3) in the presence of target 2; (4) in the presence of target 3; (5) in the presence of all three targets. Reprinted with permission from [85], copyright 2011 American Chemical Society.
Fluorescence Quenching of QD
In addition to environmental conditions, QD emission intensities are strongly influenced by proximal molecules or nanoparticles that QDs interact with. Under many circumstances, the photoluminescence of QDs is drastically quenched through numerous mechanisms. This seemingly undesirable phenomenon can serve as an advantageous feature. For example, quenching mechanism can be designed to act like a molecular switch for fluorescent signals, which would make QDs an ideal homogeneous sensing platform for studying molecular interactions and detecting specific targets.
The quenching effect is commonly observed in conventional QD-FRET. The energy transfer from QDs to organic fluorophores naturally leads to the decrease in photoluminescence of QDs accompanied by increased emissions of acceptor fluorophores. As an alternative, the FRET acceptor may be switched with a fluorescent quencher. By doing so, emission from the acceptor is removed from the FRET spectra. As a result, the only effect observed would be the quenching of the QD. Medintz et al. replaced the FRET acceptor Cy3 with a quencher molecule to detect maltose and investigate proteolytic activity in examples discussed above in the QD-FRET section [34, 65]. Freeman et al. synthesized Nile-blue functionalized QDs for the sensing of 1,4-dihydronicotinamide adenine dinucleotide (phosphate) cofactor, i.e. NAD(P)H [91]. The QDs were efficiently quenched by the Nile blue through FRET. The Nile blue dye assisted the oxidation of the NAD(P)H cofactors. In the presence of NADH, the dye was reduced to a different form that was not able to absorb photons in the visible spectrum, thereby stopping QD quenching. The proposed NADH-sensitive QD sensor was applied to monitor the change in intracellular metabolism of HeLa cell lines in response to drug treatment. Levy et al. designed a QD aptamer beacon for the detection of thrombin [92]. An aptamer sequence containing a thrombin-binding domain was covalently conjugated to a QD. An oligonucleotide complementary to the aptamer sequence was labeled with a fluorescent quencher DABCYL. Upon hybridization to the aptamer, DABCYL was brought to the vicinity of the QD to quench QD emission. Thrombin displaced the DABCYL labeled oligonucleotide by binding to the same aptamer. Hence, the presence of thrombin separated the FRET pair and recovered the photoluminescence of the QDs. Dong et al. proposed a QD sensing system by using graphene oxide (GO) as QD quencher. GO was associated to QDs via a DNA hairpin linker that contained a recognition sequence complementary to DNA targets [93]. While the hairpin was closed, GO strongly interacted with the loop region and quenched QD emission. Once the target was introduced, the hairpin hybridized to the complementary sequence and opened the loop, which weakened the interaction between GO and DNA, leading to the recovery of QD emission.
Metallic nanoparticles also possess the ability to suppress the photoluminescence of QDs. The energy transfer between gold nanoparticle (AuNP) and QDs have been extensively studied, and a number of analytical models have been proposed [94]. Kim et al., Chang et al. and Lowe et al. proposed similar AuNP based QD quenching systems to examine protease activities [95-97]. Peptide substrates were linked to QDs and AuNP at two termini. When protease enzymes were present, they were able to cut the substrate and set the AuNP free thereby recovering QD emission. Liu et al. constructed a more elaborate QD-AuNP sensor for simultaneous detection of adenosine and cocaine [98]. QD and AuNP were interconnected through the hybridization of a surface conjugated DNA aptamer. When the aptamer substrates were absent, QDs and AuNPs were closely packed into large aggregates whereby the emissions of the QDs were greatly quenched. However, in the presence of adenosine or cocaine, the aptamers bound to their respective substrates and destabilized the aggregates, which were indicated by the recovery of QD emission.
Another mechanism frequently observed in QD photoluminescence quenching relies on charge transfer. Medintz et al. constructed a QD/dopamine redox coupled nanoassembly for pH sensing [99]. Dopamine molecules self assembled onto the QD surface through covalently linked polyhistidine tags and functioned as the pH-dependent electron acceptors. Upon photoexcitation, the excited electrons from the conduction band of the QDs were transferred to the oxidized dopamine, causing QD quenching. The degree of the quenching was controlled by the amount of oxidized dopamine species. At low pH, the oxidization was inefficient, therefore the quenching was insignificant. As the pH increased, more dopamine molecules were converted to the oxidized species, leading to enhanced QD quenching. The authors utilized the QD/dopamine nanoassembly to estimate the intracellular pH. Aryal et al. developed a fatty acids sensor by coupling a modified intestinal fatty acid binding protein (IFABP) to QDs [100]. The modified IFABP contained a ruthenium complex in its hydrophobic binding pocket that allowed nonspecific binding of palmitate, which decreased the water occupancy of the binding pocket and altered the electron transfer rate, causing the quenching of QD photoluminescence. Sandros et al. modified the MBP a ruthenium complex for maltose sensing[101]. In the absence of maltose, the distance between the ruthenium complex and the QD was short enough to allow electron transfer to occur, resulting in the quenching of the QD. The binding of maltose induced conformational change of MBP, increasing the distance between the electron donor and acceptor, preventing the charge transfer thereby recovering the QD emission. Impellizzeri et al., developed a photoactivated QD by conjugating photocleavable 2-nitrobenzyl group to its surface [102]. The QD was quenched was believed to be a result of the electron transfer from the QD to the organic ligands. The UV irradiation photolyzed the ligands and removed the quencher from the QD surface, thereby restoring the QD emission. Choi et al. discovered that thrombin quenched PbS QDs through charge transfer [103]. PbS QDs were capped with a thrombin binding aptamer, which bound to thrombin via a heparin binding site or fibrinogen recognition site and induced QD quenching. It was also found that prostate-specific antigen triggered the same effect, suggesting potential applications in cancer diagnostics.
Temperature is another factor that may cause QD quenching due to the temperature dependence of the quantum yield. Walker et al. developed an optical temperature sensor based on this property [104].
Figure 7
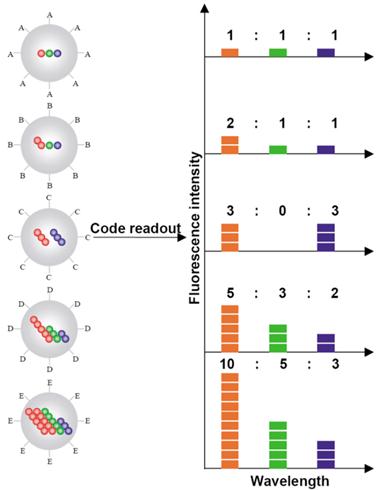
Schematic illustration of the optical coding based on wavelength and intensity multiplexing. Large spheres represent polymer microbeads, in which small colored spheres (multicolor quantum dots) are embedded according to predetermined intensity ratios. Molecular probes (A-E) are attached to the bead surface for biological binding and recognition, such as DNA-DNA hybridization and antibody-antigen/ligand-receptor interactions. The numbers of colored spheres (red, green, and blue) do not represent individual QDs, but are used to illustrate the fluorescence intensity levels. Optical readout is accomplished by measuring the fluorescence spectra of single beads. Both absolute intensities and relative intensity ratios at different wavelengths are used for coding purposes; for example (1:1:1) (2:2:2), and (2:1:1) are distinguishable codes. Adapted with permission from [36], copyright 2001 Nature Publishing Group.
QD Barcodes
Multicolor barcoding has enabled high degree of multiplexing in biomolecular assays. Han et al. created a two-parameter optical barcode by embedding QDs in polystyrene microbeads in a controlled manner [36]. Both the colors and intensities were precisely modulated for coding. A specific color-intensity combination would pinpoint an exact barcode in the pool of thousands (Fig. 7). Theoretically, the combination of m colors and n intensity levels could generate (nm-1) barcodes. For example, a coding system with 6 colors and 10 intensity levels could have a theoretical coding capacity close to one million. In reality, the coding capacity is typically far less than the theoretical limit due to the spectral cross talk and intensity variations. Nonetheless, this approach offers a large number of distinctive molecular identifiers, which greatly increase the detection throughput. Originally, microbeads barcodes were generated by swelling nonporous polystyrene beads in organic solvent containing QDs. However, the brightness and uniformity were not ideal for coding applications. An improved protocol developed by Gao et al. immobilized surfactant coated QDs on mesoporous polystyrene beads via hydrophobic interaction [105, 106]. The resulting microbeads barcodes were about 1000 times brighter and 5 times more uniform in their fluorescent intensities. Xu et al. applied a 2-color/3-intensity barcode system for multiplex SNP analysis [107]. Target SNP sites were PCR amplified and amplicons were hybridized to allelic specific probes encoded by the microbead barcodes. A Cy5 fluorophore that served as positive control was conjugated to amplicons via biotin-streptavidin interaction to confirm the presence of targets. Analysis of 10 SNP alleles in 94 samples was performed with close to 100% accuracy as verified by Taqman assay. Klostranec et al. encoded antibodies that recognized HBV, HCV and HIV pathogen biomarkers using a 2-color/2-intensity barcode system and showed multiplex pathogen detection on a microfluidic platform driven by electrokinetic flow [108]. A few other groups focused on barcode synthesis techniques aiming at improving the throughput [109] and barcode uniformity [110].
QD ENABLED SINGLE MOLECULE DETECTION
Single molecule detection (SMD) techniques have made great advancements in past few decades. Solution phase SMD is developed primarily based on confocal fluorescence spectroscopy or microscopy, which acquires signal from a confined volume (typically femtoliter range). The detection volume is limited by the illumination volume of the laser source and the collection efficiency function confined by the pinhole [111]. SMD offers tremendous advantages over conventional fluorescence based detection methods. The small detection volume greatly reduces the background noise thereby improving detection sensitivity. While performing SMD measurements, the targets are kept at low concentrations so that the average number of molecules residing in the detection volume is less than unity. The passage of target molecules through the detection volume results in single fluorescent bursts carrying the information of individual molecules. Unlike ensemble analysis that measures averaged fluorescence properties, SMD interrogates individual molecules and provides statistical information on the entire target population.
With the development of novel fluorescent probes and sensing strategies, SMD pushes the detection limit to the extreme, providing an exceptional platform for sensing scarce molecules at low concentrations. QDs are ideal fluorescent tags for SMD based sensing. The signal to noise ratio of SMD is highly dependent on specific brightness of the fluorophores and the transient time of molecules passing through the detection volume. To attain high analysis throughput, samples are often driven through the detection volume at high speed, which decreases the molecule transient time and inevitably reduces the burst hence the signal to noise ratio. QDs alleviate these issues due to their high brightness. In addition, QDs are exceedingly photostable when compared to organic fluorophores, which allow them to withstand high-intensity illumination within the confocal setup for much longer periods of time.
SMD QD-FRET Detection
By uniting the extremely low background of QD-FRET nanosensors and the incredibly high sensitivity of SMD, Zhang et al. reported a single-QD sensor for target specific nucleic acid detection [52]. First, a biotin labeled capture probe and a Cy5 labeled reporter probe were hybridized to the target DNA to form a sandwich hybrid structure (Fig. 2A), which then self assembled onto streptavidin coated QDs. The QD nanosensor assembly was then interrogated in a microfluidic capillary (Fig. 8A). Donor and acceptor fluorescent bursts were detected simultaneously with two avalanche photo diodes (APD). In the absence of target DNA, only QD bursts were witnessed because no FRET pair was established (Fig. 8B). In contrast, positive control gave fluorescent bursts in both QD and Cy5 channels (Fig. 8B). FRET factor distribution was obtained by calculating individual FRET factors based on the intensities of the donor burst and its corresponding acceptor burst using single particle FRET (spFRET) techniques [112, 113]. The spFRET histograms clearly exhibited a right shift (higher FRET factor) with increased acceptor to donor ratio (Fig. 8C). Subsequently, the same single QD nanosensor was functionalized with a variety of probes to detect cocaine [114] and study molecular interactions [115, 116]. Pons et al. carefully studied a maltose binding protein (MBP) based QD-FRET system with SMD [117]. Cy3 labeled MBP was allowed to self assemble onto a QD surface. By closely examining the spFRET distribution, the authors concluded that the self assembly process resulted in a group of subpopulations each of which had a unique acceptor to donor ratio that followed Poisson distribution with the expectation value of N, which was the ensemble acceptor to QD ratio. The QD-FRET distribution observed by SMD was the summation of all the subpopulations. Direct correlation between spFRET and ensemble FRET was revealed by comparing the FRET efficiencies and their dependence on donor-acceptor distance.
SMD QD Burst Coincidence Detection
Fluorescent burst coincidence detection is designed specifically for SMD platforms. Two QD labeled probes were designed to recognize the same target and form a dually labeled complex (Fig. 9A). As the complex passes through the detection volume, signals from both QDs are detected simultaneously, resulting in a pair of coincident fluorescent bursts in two independent channels (Fig. 9B). The concentrations of probes and targets are in the sub-nanomolar range. Under such conditions, the average number of molecules remaining in the detection volume is less than unity. As a consequence, in the absence of target, two probes pass through the detection volume independently and the resulting fluorescent bursts in each of the two channels are uncorrelated (Fig. 9C). It is important to ensure that no spectral crosstalk exists between the two fluorophores to avoid false coincidence. Due to small Stokes shift of organic dyes, dual-excitation is required for coincidence detection. However, it is intricate to align the illumination volumes of two lasers and correct the chromatic aberration [111]. In contrast, the unique optical properties of QDs permit single excitation for QDs of different colors. As a result, multi-color coincidence can be achieved with QDs using simple confocal setups with a single excitation source.
Yeh et al. labeled two probes with QD525 and QD605 respectively [118]. The two probes hybridized to targets and cross-linked into a nanocomplex. The presence of targets was hence detected by the coincident fluorescent bursts from the two QDs. Single-excitation coincidence detection was also accomplished by replacing QD525 with an organic fluorophore whose emission spectrum resembled that of QD525. The authors also demonstrated multiplexed detection with pairwise coincidence using probes labeled with three different QDs. Yeh et al. developed a point mutation detection method by a combination of single particle coincidence analysis and allele-specific ligation reactions [119]. Streptavidin-conjugated QD605 is used to capture and locally concentrate Oregon Green 488-labeled ligation products such that the presence of the product and hence the genotype can be determined by two-color coincident fluorescent bursts. Zhang et al. managed multiplexed detection with SMD by combining QD coincidence and QD-FRET [120]. Two fluorophores were coupled to QDs via DNA linkers. The Alexa488 and QD605 pair was simultaneously excited and detected by coincidence through single particle QD-FRET.
Ho et al. developed an imaged based coincidence detection strategy [121]. DNA functionalized QDs hybridized to targets and formed a dual-color labeled sandwich nanoassembly (Fig. 10A). The presence of targets was identified using colorimetric measurements. Because the physical sizes of QDs were much smaller than the diffraction limited resolution, the co-localized QD pair exhibited the combined color of the two QDs (Fig. 10B). Meanwhile, unbound QDs retained their original colors, allowing easy differentiation from the target nanocomplexes. Multiplexed detection was accomplished by tagging 6 DNA probes with 3 different QDs. Each target gene hybridized to two probes and resulted in a unique color combination (Fig. 10C).
Figure 8
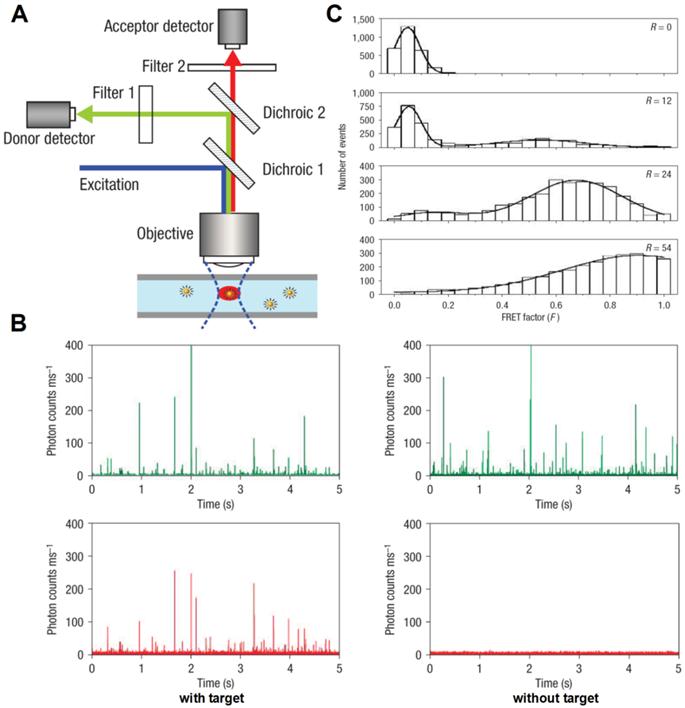
Single quantum dot FRET. A) Schematic illustration of experiment setup. Fluorescent signals are acquired using confocal spectroscopy as the nanocomplexes flow through the microfluidic capillary. B) Representative traces of fluorescent bursts detected with nanosensors. In the presence of targets, fluorescent bursts are detected by both the donor. When targets were absent, fluorescent bursts were only detected by the donor detector but not by the acceptor detector. C) FRET histograms of nanosensor assemblies at different acceptor (Cy5)/donor (QD) ratios (R) ranging from 0 to 54. Reprinted with permission from [52], copyright 2005 Nature Publishing Group.
Figure 9
Conceptual illustration of QD coincidence detection. A) Two QD conjugated probes hybridize to the target and form a dually labeled complex. B) As the complex passes through the detection volume, a pair of coincident fluorescent bursts are observed. C) In the absence of target, QDs travel independently through the detection volume. No coincident fluorescent burst is observed.
Figure 10
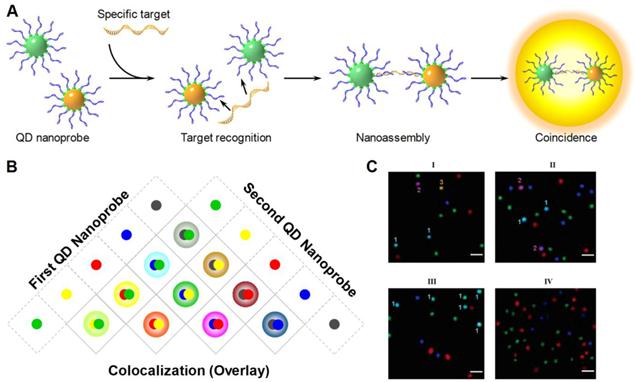
A) QD nanoprobes prepared by surface-functionalizing QDs with target-specific oligonucleotide probes. Two target-specific QD nanoprobes with different emission wavelengths sandwich a target, forming a QD probe-target nanoassembly. The nanoassembly is detected as a blended color due to the colocalization of the both QD nanoprobes. B) The color combination scheme for multiplexed colocalization detection. C) Fluorescent images demonstrate multiplexed detection of 3 targets (I), 2 targets (II) and one target (III) through QD colocalization. Negative control shows no colocalization (IV). Reprinted with permission from [121], copyright 2005 American Chemical Society.
UNCONVENTIONAL SENSING STRATEGEIES
While the majority of research on QDs concentrates on their excellent photoluminescent properties, non-photoluminescent phenomena may also lead to new opportunities for developing QD based molecular assays that conventional approaches are not able to achieve.
In a recent publication, Zhang et al. reported a QD based ultrahigh-resolution DNA quantification technique named quantum dot electrophoretic mobility assay (QEMSA). QEMSA exploits the electrohydrodynamic property of streptavidin coated CdSe QDs [15]. Target DNA molecules were tagged with biotin and self assembled onto QD surfaces (Fig. 11A). The electrophoretic mobility of QDs was precisely modulated by the degree of DNA conjugation. Instead of quantifying based on fluorescent intensities, the amount of target DNA was determined by measuring the relative migration distance of the QD-DNA nanocomplex within a gel (Fig. 11B). An analytical model based on Poisson-Boltzmann equation predicted the migration distance to be proportional to the logarithm of the DNA to QD ratio N (Fig. 11C,D). QEMSA enabled accurate quantification down to 1.1-fold (9%) change in quantity. It had been successfully applied to quantify DNA copy number variation of RSF1/HBXAP in ovarian cancer cell lines and assess DNA methylation levels of p16/CDK2A gene promoter.
Figure 11
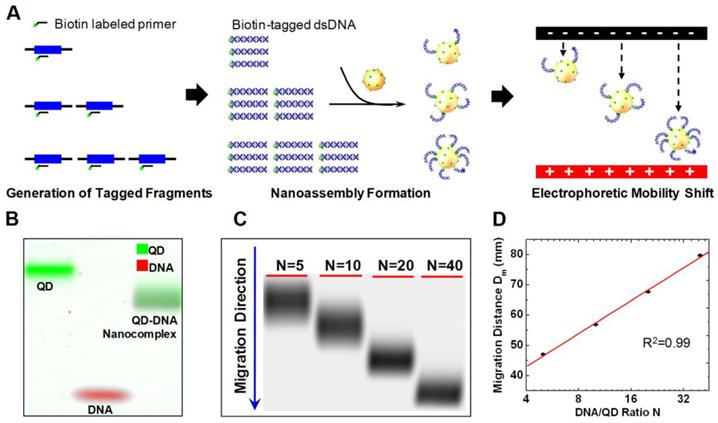
QEMSA working principle. A) Biotin-tagged DNA fragments were generated from genomic DNA targets using biotinylated primers and a limited number of amplification cycles to preserve genomic DNA quantity information. The biotinylated DNA fragments were then mixed with streptavidin-coated QDs, and self-assembly would occur to form nanocomplexes where the resultant DNA:QD ratio, N, was dependent on the amount of input DNA. The electrophoretic mobility of the nanocomplexes increased with the DNA:QD ratio and was used to determine DNA quantity. B) Pseudocolor gel image reveals that the QDDNA nanocomplexes (combined green and red) migrated faster than the naked QDs (green) but slower than the oligonucleotides alone (red). C) Representative gel image of QDDNA nanocomplexes with various N values migrating in an agarose gel. The nanocomplexes with the largest N migrate fastest and vice versa. D) Migration curve was obtained by plotting the migration distance of each gel band against the respective DNA:QD ratio, N. The migration distance was determined by measuring the point at which the leading edge of the electropherogram met the baseline intercept. Reprinted with permission from [15], copyright 2011 American Chemical Society.
Figure 12
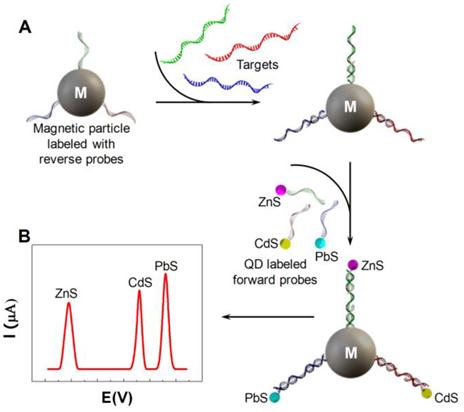
Multi-target electrical DNA detection protocol based on different QD tracers. (A) Process flow: introduction of probe-modified magnetic beads, hybridization with the DNA targets, and second hybridization with the QD-labeled probes. (B) Dissolution of QDs and electrochemical detection. Reprinted with permission from [16], copyright 2003 American Chemical Society.
The electrochemical properties of QDs have gradually attracted more attention. Wang et al. performed sandwich immunoassays with QD conjugated with anti-prostate-specific antigen (PSA) antibodies [122]. The immobilized QDs were dissolved in HCl. Electrochemical stripping analysis of the released cadmium was performed to confirm the presence of PSA. Wang et al. extended the design by introducing three types of QDs made from ZnS, CdS and PbS [16]. Three pairs of probes were designed to detect three distinct targets. Each pair consisted of a forward probe and a reverse probe. Three forward probes were linked to three types of QDs respectively while the three reverse probes were all immobilized to the same magnetic particles (Fig. 12A). Upon hybridization to the target DNA, QDs were extracted from the solution together with the magnetic particles. Electrochemical stripping analysis was subsequently performed to identify heavy metal ions dissolved from the QDs. The stripping peaks of Zn, Cd and Pb ions, each of which indicated the presence of one target, were well separated, providing the opportunity for multiplexed detection (Fig. 12B).
QDs immobilized on electrodes could be detected through photocurrents generated by photoexcited electron-hole pairs. The conduction band electrons were either transferred to electrode, generating anodic photocurrents, or transferred to electron acceptors in solution phase, generating cathodic photocurrents [18, 123]. Making use of the photoelectrical properties, Willner et al. reported a QD based DNA detection array by sensing changes in the photoelectrical currents [20]. Probes were immobilized on the electrodes as well as on the QDs. In the presence of the target, QDs formed a cross linked network on the electrode surface through DNA hybridization. [Ru(NH3)6]3+ which bound to dsDNA by electrostatic force was then added to provide pathways for electrons to enhance the photocurrent. DNA quantification was accomplished by measuring the photocurrent generated in the QD network. The same group also used the QD photochemical sensor to study enzyme inhibitor effects [19]. Acetycholine esterase (AChE) was covalently linked to QDs and immobilized on an Au electrode. The presence of the AChE substrate, acetylthiocholine, activated the photochemistry. The potency of AChE inhibitor was analyzed by measuring changes in photocurrent at various inhibitor concentrations.
Other unconventional properties of QD such as catholuminescence [124], electroluminescence [125] and chemiluminescence [126] have also been studied. However, their biological applications were limited due to incompatible reaction conditions.
CONCLUSION AND FUTURE OUTLOOK
In this review, we have commented on the latest QD based sensing and molecular diagnostic strategies in numerous studies. A summary that lists all the QD applications and their sensing approaches is provided in Table 1.
Since their introduction in biological applications merely a decade ago, QDs have quickly evolved from a generic "passive" fluorescent labels to "smart" nanoprobes that carry additional functions. QDs have made great impact on modern molecular and cellular biology by providing innovative tools to explore new biological events. Their unique optical properties render them valuable for high throughput and multiplexed detection, particularly in -omics studies. QD-FRET based nanosensors have been integrated into a great number of homogeneous molecular assays to detect specific targets and monitor reaction progress. QDs have also proven to be excellent tags for SMD strategies due to their extreme sensitivity. Unconventional non-photoluminescence properties of QDs are already being explored in the hopes of developing new detection methods.
Despite their numerous advantages, it is to be realized that QD is not meant to replace conventional organic fluorophores but rather offer a complement. Both dyes have their benefits as well as drawbacks. The sizes of QDs are considerably larger than typical organic fluorophores, which poses a problem for QD conjugated probes in biochemical reactions. QDs also unsuitable for many enzyme based signal amplification reactions [6]. So far, no practical QD based real time PCR platform has been reported that match conventional organic fluorophore based real time PCR in terms of performance. Concerns are also raised on the cytotoxicity of QD for in vivo studies. The majority of QDs are made from highly toxic semiconductor materials. Even with proper capping and organic functional layers, toxic ions are still believed to escape from the core [127]. Fortunately, the abovementioned issues are already under investigation. Compared to organic fluorophores, more detailed characterization and well established assay protocols are required to promote the commercial availability of QD based analysis systems in order to attract more users.
Table 1
Summary of QD sensing strategies and their applications.
| Subject of Study | Sensing Strategy | Reference |
|---|---|---|
| Detection of Specific Targets | ||
| P53 SNP and single base deletion | QD passive label | Ref.[44, 46] |
| SNP | QD barcode | Ref.[107] |
| KRAS point mutation | single molecule QD-FRET | Ref.[52] |
| KRAS point mutation | single molecule QD burst coincidence | Ref.[118, 119] |
| DNA methylation | methylation specific QD-FRET | Ref.[53, 60] |
| DNA methylation, RSF1 gene copy number variation | quantum dot electrophoretic mobility assay (QEMSA) | Ref.[15] |
| RNAi selection | QD-FRET | Ref.[61] |
| specific DNA/RNA sequence | solid phase QD-FRET | Ref.[62-64] |
| specific DNA/RNA sequence | QD quenching through graphene oxide | Ref.[93] |
| specific DNA/RNA sequence | image based QD single molecule coincidence | Ref.[121] |
| specific DNA/RNA sequence | electrochemical stripping of QD | Ref.[16] |
| specific DNA/RNA sequence | photoelectricity induced by QD | Ref.[20] |
| Western blot | immunoassay with QD passive label | Ref.[40-42] |
| prostate specific antigen | electrochemical stripping of QD | Ref.[122] |
| peptide fragment | immunoassay with QD passive label | Ref.[8] |
| HIV and HIV drug screening | Single molecule QD-FRET | Ref.[115] |
| extracellular signal-regulated kinases | immunoassay with QD passive label | Ref.[37] |
| cholera toxin and staphylococcal enterotoxin B | immunoassay with QD passive label | Ref.[30] |
| Thrombin | QD quenching through FRET | Ref.[92] |
| Thrombin | QD quenching through electron transfer | Ref.[103] |
| adenosine and cocaine | QD quenching through FRET | Ref.[98] |
| cocaine | single molecule QD-FRET | Ref.[114] |
| fatty acids | QD quenching through electron transfer | Ref.[100] |
| maltose | competitive QD-FRET and QD quenching through FRET | Ref.[34, 65] |
| maltose | QD quenching through electron transfer | Ref.[101] |
| TNT | competitive QD-FRET | Ref.[66] |
| Ca2+ | QD-FRET with Ca2+ sensitive acceptor | Ref.[69] |
| ATP, Hg2+ | CRET with QD | Ref.[85] |
| HBV, HCV and HIV | QD barcode | Ref.[108] |
| pH | QD-FRET with pH sensitive acceptor | Ref.[67, 68] |
| pH | QD quenching through electron transfer | Ref.[99] |
| Temperature | QD quenching by temperature | Ref.[104] |
| Exploration of using QD as FRET acceptor with photoexcitation | time resolved QD-FRET | Ref.[86-90] |
| Measurement of Enzyme Activity and Reaction Kinetics | ||
| protease activity (caspase-1, caspase-3, collagenase, chymotrypsin, botulinum neurotoxin, trypsin) | QD-FRET | Ref.[31, 34, 68, 70] |
| protease activity | QD quenching through gold nanoparticles | Ref.[95-97] |
| protease activity (matrix metalloproteinases) | BRET with QD | Ref.[80-82] |
| protein kinase activity (tyrosine kinases Abl and Src) | QD-FRET | Ref.[71] |
| DNAse, Mnase activity | QD-FRET | Ref.[68, 72] |
| polymerase activity (Klenow fragment) | QD-FRET | Ref.[68, 73] |
| telomerase activity | QD-FRET | Ref.[73] |
| inhibition of acetycholine esterase | photoelectricity induced by QD | Ref.[19] |
| MBP binding kinetics | single molecule QD-FRET | Ref.[117] |
| Monitoring of Intracellular Activity | ||
| intracellular gene trafficking | QD-FRET with QD-DNA-polymer micelle, lipoplex and polyplex | Ref.[74-78] |
| intracellular drug (doxorubicin) trafficking | Bi-FRET QD-FRET | Ref.[79] |
| intracellular metabolism monitoring | QD quenching through FRET | Ref.[91] |
Acknowledgements
Authors would like to thank Dr. Suneil Hosmane for helpful discussions and suggestions. Authors also would like to thank funding source from National Institutes of Health (R01CA155305, U54CA151838), National Science Foundation (0546012, 0967375) and Stand Up to Cancer (Epigenetic Dream Team, SU2C-AACR-CT0109).
CONFLICT OF INTEREST
Authors declare no conflict of interest.
References
1. Nirmal M, Brus L. Luminescence photophysics in semiconductor nanocrystals. Accounts of Chemical Research. 1999;32:407-14
2. Alivisatos AP. Semiconductor clusters, nanocrystals, and quantum dots. Science. 1996;271:933-7
3. Norris DJ, Bawendi MG. Measurement and assignment of the size-dependent optical spectrum in CdSe quantum dots. Physical Review B - Condensed Matter and Materials Physics. 1996;53:16338-46
4. Norris DJ, Efros AL, Rosen M, Bawendi MG. Size dependence of exciton fine structure in CdSe quantum dots. Physical Review B - Condensed Matter and Materials Physics. 1996;53:16347-54
5. Norris DJ, Sacra A, Murray CB, Bawendi MG. Measurement of the size dependent hole spectrum in CdSe quantum dots. Physical Review Letters. 1994;72:2612-5
6. Resch-Genger U, Grabolle M, Cavaliere-Jaricot S, Nitschke R, Nann T. Quantum dots versus organic dyes as fluorescent labels. Nature Methods. 2008;5:763-75
7. Bruchez Jr M, Moronne M, Gin P, Weiss S, Alivisatos AP. Semiconductor nanocrystals as fluorescent biological labels. Science. 1998;281:2013-6
8. Chan WCW, Nie S. Quantum dot bioconjugates for ultrasensitive nonisotopic detection. Science. 1998;281:2016-8
9. Yager P, Domingo GJ, Gerdes J. Point-of-care diagnostics for global health. Annual Review of Biomedical Engineering. 2008;10:107-44
10. Farias PMA, Santos BS, Menezes FD, Ferreira R, Fontes A, Carvalho HF. et al. Quantum dots as fluorescent bio-labels in cancer diagnostic. Physica Status Solidi (C) Current Topics in Solid State Physics. 2006;3:4001-8
11. Lakovicz JR. Principles of fluorescence spectroscopy. 3rd ed. New York: Springer Science+Business Media. 2006
12. Mason WT. Fluorescent and luminescent probes for biological activity. 2nd ed. London: Academic Press. 1999
13. Jain KK. Nanodiagnostics: Application of nanotechnology in molecular diagnostics. Expert Review of Molecular Diagnostics. 2003;3:153-61
14. Chen Y, Elangovan M, Periasamy A. FRET data analysis—the algorithm. Molecular Imaging: FRET Microscopy and Spectroscopy. New York: Oxford University Press. 2005:126-45
15. Zhang Y, Liu KJ, Wang T-L, Shih I-M, Wang T-H. Mapping DNA quantity into electrophoretic mobility through quantum dot nanotethers for high-resolution genetic and epigenetic analysis. ACS Nano. 2012;6:858-64
16. Wang J, Liu GD, Merkoci A. Electrochemical coding technology for simultaneous detection of multiple DNA targets. Journal of the American Chemical Society. 2003;125:3214-5
17. Wang J. Nanoparticle-based electrochemical DNA detection. Analytica Chimica Acta. 2003;500:247-57
18. Katz E, Zayats M, Willner I, Lisdat F. Controlling the direction of photocurrents by means of CdS nanoparticles and cytochrome c-mediated biocatalytic cascades. Chemical Communications. 2006:1395-7
19. Pardo-Yissar V, Katz E, Wasserman J, Willner I. Acetylcholine esterase-labeled US nanoparticles on electrodes: Photoelectrochemical sensing of the enzyme inhibitors. Journal of the American Chemical Society. 2003;125:622-3
20. Willner I, Patolsky F, Wasserman J. Photoelectrochemistry with controlled DNA-cross-linked CdS nanoparticle arrays. Angewandte Chemie-International Edition. 2001;40:1861-4
21. Murray CB, Norris DJ, Bawendi MG. Synthesis and characterization of nearly monodisperse CdE (E = S, Se, Te) semiconductor nanocrystallites. Journal of the American Chemical Society. 1993;115:8706-15
22. Crouch D, Norager S, O'Brien P, Park JH, Pickett N, Kelly JM. et al. New synthetic routes for quantum dots. Philosophical Transactions of the Royal Society A: Mathematical, Physical and Engineering Sciences. 2003;361:297-310
23. Bhattacharya P, Ghosh S, Stiff-Roberts AD. Quantum dot opto-electronic devices. Annual Review of Materials Research. 2004:1-40
24. Kortan AR, Hull R, Opila RL, Bawendi MG, Steigerwald ML, Carroll PJ. et al. Nucleation and growth of CdSe on ZnS quantum crystallite seeds, and vice versa, in inverse micelle media. Journal of the American Chemical Society. 1990;112:1327-32
25. Frarias PMA, Santos BS, Fontes A. Semiconductor fluorescent quantum dots: Efficient biolabels in cancer diagnostics. Micro and Nano Technologies in Bioanalysis. 2009:407-19
26. Smith AM, Duan H, Mohs AM, Nie S. Bioconjugated quantum dots for in vivo molecular and cellular imaging. Advanced Drug Delivery Reviews. 2008;60:1226-40
27. Medintz IL, Uyeda HT, Goldman ER, Mattoussi H. Quantum dot bioconjugates for imaging, labelling and sensing. Nature Materials. 2005;4:435-46
28. Gao XH, Yang LL, Petros JA, Marshal FF, Simons JW, Nie SM. In vivo molecular and cellular imaging with quantum dots. Current Opinion in Biotechnology. 2005;16:63-72
29. Xing Y, Rao J. Quantum dot bioconjugates for in vitro diagnostics & in vivo imaging. Cancer Biomarkers. 2008;4:307-19
30. Goldman ER, Balighian ED, Mattoussi H, Kuno MK, Mauro JM, Tran PT. et al. Avidin: A natural bridge for quantum dot-antibody conjugates. Journal of the American Chemical Society. 2002;124:6378-82
31. Boeneman K, Mei BC, Dennis AM, Bao G, Deschamps JR, Mattoussi H. et al. Sensing caspase 3 activity with quantum dot-fluorescent protein assemblies. Journal of the American Chemical Society. 2009;131:3828-29
32. Berti L, D'Agostino PS, Boeneman K, Medintz IL. Improved peptidyl linkers for self-assembly of semiconductor quantum dot bioconjugates. Nano Research. 2009;2:121-9
33. Prasuhn DE, Blanco-Canosa JB, Vora GJ, Delehanty JB, Susumu K, Mei BC. et al. Combining chemoselective ligation with polyhistidine-driven self-assembly for the modular display of biomolecules on quantum dots. Acs Nano. 2010;4:267-78
34. Medintz IL, Clapp AR, Brunel FM, Tiefenbrunn T, Uyeda HT, Chang EL. et al. Proteolytic activity monitored by fluorescence resonance energy transfer through quantum-dot-peptide conjugates. Nature Materials. 2006;5:581-9
35. Sapsford KE, Pons T, Medintz IL, Higashiya S, Brunel FM, Dawson PE. et al. Kinetics of metal-affinity driven self-assembly between proteins or peptides and CdSe-ZnS quantum dots. Journal of Physical Chemistry C. 2007;111:11528-38
36. Han MY, Gao XH, Su JZ, Nie S. Quantum-dot-tagged microbeads for multiplexed optical coding of biomolecules. Nature Biotechnology. 2001;19:631-5
37. Geho D, Lahar N, Gurnani P, Huebschman M, Herrmann P, Espina V. et al. Pegylated, steptavidin-conjugated quantum dots are effective detection elements for reverse-phase protein microarrays. Bioconjugate Chemistry. 2005;16:559-66
38. Goldman ER, Clapp AR, Anderson GP, Uyeda HT, Mauro JM, Medintz IL. et al. Multiplexed toxin analysis using four colors of quantum dot fluororeagents. Analytical Chemistry. 2004;76:684-8
39. Hu M, Yan J, He Y, Lu H, Weng L, Song S. et al. Ultrasensitive, multiplexed detection of cancer biomarkers directly in serum by using a quantum dot-based microfluidic protein chip. Acs Nano. 2009;4:488-94
40. Makrides SC, Gasbarro C, Bello JM. Bioconjugation of quantum dot luminescent probes for Western blot analysis. Biotechniques. 2005;39:501-6
41. Bakalova R, Zhelev Z, Ohba H, Baba Y. Quantum dot-based western blot technology for ultrasensitive detection of tracer proteins. Journal of the American Chemical Society. 2005;127:9328-9
42. Ornberg RL, Harper TF, Liu H. Western blot analysis with quantum dot fluorescence technology: a sensitive and quantitative method for multiplexed proteomics. Nature Methods. 2005;2:79-81
43. Shin S, Kim I-H, Kang W, Yang JK, Hah SS. An alternative to Western blot analysis using RNA aptamer-functionalized quantum dots. Bioorganic & Medicinal Chemistry Letters. 2010;20:3322-5
44. Gerion D, Chen FQ, Kannan B, Fu AH, Parak WJ, Chen DJ. et al. Room-temperature single-nucleotide polymorphism and multiallele DNA detection using fluorescent nanocrystals and microarrays. Analytical Chemistry. 2003;75:4766-72
45. Karlin-Neumann G, Sedova M, Falkowski M, Wang Z, Lin S, Jain M. Application of quantum dots to multicolor microarray experiments: four-color genotyping. Methods in molecular biology (Clifton, NJ). 2007;374:239-51
46. Hardenbol P, Yu FL, Belmont J, MacKenzie J, Bruckner C, Brundage T. et al. Highly multiplexed molecular inversion probe genotyping: Over 10,000 targeted SNPs genotyped in a single tube assay. Genome Research. 2005;15:269-75
47. Robelek R, Niu LF, Schmid EL, Knoll W. Multiplexed hybridization detection of quantum dot-conjugated DNA sequences using surface plasmon enhanced fluorescence microscopy and spectrometry. Analytical Chemistry. 2004;76:6160-5
48. Gryczynski I, Malicka J, Jiang W, Fischer H, Chan WCW, Gryczynski Z. et al. Surface-plasmon-coupled emission of quantum dots. Journal of Physical Chemistry B. 2005;109:1088-93
49. Medintz IL, Konnert JH, Clapp AR, Stanish I, Twigg ME, Mattoussi H. et al. A fluorescence resonance energy transfer-derived structure of a quantum dot-protein bioconjugate nanoassembly. Proceedings of the National Academy of Sciences of the United States of America. 2004;101:9612-7
50. Lunz M, Gerard VA, Gun'ko YK, Lesnyak V, Gaponik N, Susha AS. et al. Surface plasmon enhanced energy transfer between donor and acceptor CdTe nanocrystal quantum dot monolayers. Nano Letters. 2011;11:3341-5
51. Boeneman K, Deschamps JR, Buckhout-White S, Prasuhn DE, Blanco-Canosa JB, Dawson PE. et al. Quantum dot DNA bioconjugates: Attachment chemistry strongly influences the resulting composite architecture. Acs Nano. 2010;4:7253-66
52. Zhang CY, Yeh HC, Kuroki MT, Wang TH. Single-quantum-dot-based DNA nanosensor. Nature Materials. 2005;4:826-31
53. Bailey VJ, Easwaran H, Zhang Y, Griffiths E, Belinsky SA, Herman JG. et al. MS-qFRET: A quantum dot-based method for analysis of DNA methylation. Genome Research. 2009;19:1455-61
54. Jones PA, Laird PW. Cancer epigenetics comes of age. Nature Genetics. 1999;21:163-7
55. Bird A. DNA methylation patterns and epigenetic memory. Genes Dev. 2002;16:6-21
56. Russo VEA, Martienssen RA, Riggs AD. Epigenetic mechanisms of gene regulation. Plainview, NY: Cold Spring Harbor Laboratory Press. 1996
57. Jones PA, Baylin SB. The fundamental role of epigenetic events in cancer. Nat Rev Genet. 2002;3:415-28
58. Herman JG, Baylin SB. Mechanisms of disease: Gene silencing in cancer in association with promoter hypermethylation. New England Journal of Medicine. 2003;349:2042-54
59. Herman JG, Graff JR, Myohanen S, Nelkin BD, Baylin SB. Methylation-specific PCR: A novel PCR assay for methylation status of CpG islands. Proceedings of the National Academy of Sciences of the United States of America. 1996;93:9821-6
60. Bailey VJ, Keeley BP, Zhang Y, Ho Y-P, Easwaran H, Brock MV. et al. Enzymatic incorporation of multiple dyes for increased sensitivity in QD-FRET sensing for DNA methylation detection. Chembiochem. 2010;11:71-4
61. Bakalova R, Zhelev Z, Ohba H, Baba Y. Quantum dot-conjugated hybridization probes for preliminary screening of siRNA sequences. Journal of the American Chemical Society. 2005;127:11328-35
62. Algar WR, Krull UJ. Toward a multiplexed solid-phase nucleic acid hybridization assay using quantum dots as donors in fluorescence resonance energy transfer. Analytical Chemistry. 2009;81:4113-20
63. Algar WR, Krull UJ. Developing mixed films of immobilized oligonucleotides and quantum dots for the multiplexed detection of nucleic acid hybridization using a combination of fluorescence resonance energy transfer and direct excitation of fluorescence. Langmuir. 2009;26:6041-7
64. Algar WR, Krull UJ. Interfacial transduction of nucleic acid hybridization using immobilized quantum dots as donors in fluorescence resonance energy transfer. Langmuir. 2009;25:633-8
65. Medintz IL, Clapp AR, Mattoussi H, Goldman ER, Fisher B, Mauro JM. Self-assembled nanoscale biosensors based on quantum dot FRET donors. Nature Materials. 2003;2:630-8
66. Goldman ER, Medintz IL, Whitley JL, Hayhurst A, Clapp AR, Uyeda HT. et al. A hybrid quantum dot-antibody fragment fluorescence resonance energy transfer-based TNT sensor. Journal of the American Chemical Society. 2005;127:6744-51
67. Snee PT, Somers RC, Nair G, Zimmer JP, Bawendi MG, Nocera DG. A ratiometric CdSe/ZnS nanocrystal pH sensor. Journal of the American Chemical Society. 2006;128:13320-1
68. Suzuki M, Husimi Y, Komatsu H, Suzuki K, Douglas KT. Quantum dot FRET biosensors that respond to pH, to proteolytic or nucleolytic cleavage, to DNA synthesis, or to a multiplexing combination. Journal of the American Chemical Society. 2008;130:5720-5
69. Prasuhn DE, Feltz A, Blanco-Canosa JB, Susumu K, Stewart MH, Mei BC. et al. Quantum dot peptide biosensors for monitoring caspase 3 proteolysis and calcium ions. Acs Nano. 2010;4:5487-97
70. Sapsford KE, Granek J, Deschamps JR, Boeneman K, Blanco-Canosa JB, Dawson PE. et al. Monitoring botulinum neurotoxin a activity with peptide-gunctionalized quantum dot resonance energy transfer sensors. Acs Nano. 2011;5:2687-99
71. Ghadiali JE, Cohen BE, Stevens MM. Protein kinase-actuated resonance energy transfer in quantum dot-peptide conjugates. Acs Nano. 2010;4:4915-9
72. Huang S, Xiao Q, He ZK, Liu Y, Tinnefeld P, Su XR. et al. A high sensitive and specific QDs FRET bioprobe for MNase. Chemical Communications. 2008:5990-2
73. Patolsky F, Gill R, Weizmann Y, Mokari T, Banin U, Willner I. Lighting-up the dynamics of telomerization and DNA replication by CdSe-ZnS quantum dots. Journal of the American Chemical Society. 2003;125:13918-9
74. Ho Y-P, Chen HH, Leong KW, Wang T-H. Evaluating the intracellular stability and unpacking of DNA nanocomplexes by quantum dots-FRET. Journal of Controlled Release. 2006;116:83-9
75. Chen HH, Ho Y-P, Jiang X, Mao H-Q, Wang T-H, Leong KW. Quantitative comparison of intracellular unpacking kinetics of polyplexes by a model constructed from quantum Dot-FRET. Molecular Therapy. 2008;16:324-32
76. Chen HH, Ho Y-P, Jiang X, Mao H-Q, Wang T-H, Leong KW. Simultaneous non-invasive analysis of DNA condensation and stability by two-step QD-FRET. Nano Today. 2009;4:125-34
77. Jiang X, Zheng Y, Chen HH, Leong KW, Wang T-H, Mao H-Q. Dual-sensitive micellar nanoparticles regulate DNA unpacking and enhance hene-delivery efficiency. Advanced Materials. 2010;22:2556-60
78. Wu Y, Ho Y-P, Mao Y, Wang X, Yu B, Leong KW. et al. Uptake and intracellular fate of multifunctional nanoparticles: A comparison between lipoplexes and polyplexes via quantum dot mediated Forster resonance energy transfer. Molecular Pharmaceutics. 2011;8:1662-8
79. Bagalkot V, Zhang L, Levy-Nissenbaum E, Jon S, Kantoff PW, Langer R. et al. Quantum dot - Aptamer conjugates for synchronous cancer imaging, therapy, and sensing of drug delivery based on Bi-fluorescence resonance energy transfer. Nano Letters. 2007;7:3065-70
80. Yao H, Zhang Y, Xiao F, Xia Z, Rao J. Quantum dot/bioluminescence resonance energy transfer based highly sensitive detection of proteases. Angewandte Chemie-International Edition. 2007;46:4346-9
81. So MK, Xu CJ, Loening AM, Gambhir SS, Rao JH. Self-illuminating quantum dot conjugates for in vivo imaging. Nature Biotechnology. 2006;24:339-43
82. So M-K, Loening AM, Gambhir SS, Rao J. Creating self-illuminating quantum dot conjugates. Nature Protocols. 2006;1:1160-4
83. Liu X, Freeman R, Golub E, Willner I. Chemiluminescence and chemiluminescence resonance energy transfer (CRET) aptamer sensors using catalytic hemin/G-quadruplexes. Acs Nano. 2011;5:7648-55
84. Xiao Y, Pavlov V, Niazov T, Dishon A, Kotler M, Willner I. Catalytic beacons for the detection of DNA and telomerase activity. Journal of the American Chemical Society. 2004;126:7430-1
85. Freeman R, Liu X, Winner I. Chemiluminescent and chemiluminescence resonance energy transfer (CRET) detection of DNA, metal ions, and aptamer-substrate complexes using hemin/G-quadruplexes and CdSe/ZnS quantum dots. Journal of the American Chemical Society. 2011;133:11597-604
86. Hildebrandt N, Charbonniere LJ, Loehmannsroeben H-G. Time-resolved analysis of a highly sensitive Forster resonance energy transfer immunoassay using gerbium complexes as donors and quantum dots as acceptors. Journal of Biomedicine and Biotechnology. 2007
87. Charbonniere LJ, Hildebrandt N, Ziessel RF, Loehmannsroeben H-G. Lanthanides to quantum dots resonance energy transfer in time-resolved fluoro-immunoassays and luminescence microscopy. Journal of the American Chemical Society. 2006;128:12800-9
88. Anni M, Manna L, Cingolani R, Valerini D, Creti A, Lomascolo M. Forster energy transfer from blue-emitting polymers to colloidal CdSe/ZnS core shell quantum dots. Applied Physics Letters. 2004;85:4169-71
89. Kagan CR, Murray CB, Nirmal M, Bawendi MG. Electronic energy transfer in CdSe quantum dot solids. Physical Review Letters. 1996;76:1517-20
90. Algar WR, Wegner D, Huston AL, Blanco-Canosa JB, Stewart MH, Armstrong A. et al. Quantum dots as simultaneous acceptors and donors in time-gated forster resonance energy transfer relays: characterization and biosensing. Journal of the American Chemical Society. 2012;134:1876-91
91. Freeman R, Gill R, Shweky I, Kotler M, Banin U, Willner I. Biosensing and Probing of Intracellular Metabolic Pathways by NADH-Sensitive Quantum Dots. Angewandte Chemie-International Edition. 2009;48:309-13
92. Levy M, Cater SF, Ellington AD. Quantum-dot aptamer beacons for the detection of proteins. Chembiochem. 2005;6:2163-6
93. Dong H, Gao W, Yan F, Ji H, Ju H. Fluorescence resonance energy transfer between quantum dots and graphene oxide for sensing biomolecules. Analytical Chemistry. 2010;82:5511-7
94. Pons T, Medintz IL, Sapsford KE, Higashiya S, Grimes AF, English DS. et al. On the quenching of semiconductor quantum dot photoluminescence by proximal gold nanoparticles. Nano Letters. 2007;7:3157-64
95. Chang E, Miller JS, Sun JT, Yu WW, Colvin VL, Drezek R. et al. Protease-activated quantum dot probes. Biochemical and Biophysical Research Communications. 2005;334:1317-21
96. Lowe SB, Dick JAG, Cohen BE, Stevens MM. Multiplex sensing of protease and kinase enzyme activity via orthogonal coupling of quantum dot-peptide conjugates. ACS nano. 2011;6:851-7
97. Kim Y-P, Oh Y-H, Oh E, Ko S, Han M-K, Kim H-S. Energy transfer-based multiplexed assay of proteases by using gold nanoparticle and quantum dot conjugates on a surface. Analytical Chemistry. 2008;80:4634-41
98. Liu J, Lee JH, Lu Y. Quantum dot encoding of aptamer-linked nanostructures for one-pot simultaneous detection of multiple analytes. Analytical Chemistry. 2007;79:4120-5
99. Medintz IL, Stewart MH, Trammell SA, Susumu K, Delehanty JB, Mei BC. et al. Quantum-dot/dopamine bioconjugates function as redox coupled assemblies for in vitro and intracellular pH sensing. Nature Materials. 2010;9:676-84
100. Aryal BP, Benson DE. Electron donor solvent effects provide biosensing with quantum dots. Journal of the American Chemical Society. 2006;128:15986-7
101. Sandros MG, Gao D, Benson DE. A modular nanoparticle-based system for reagentless small molecule biosensing. Journal of the American Chemical Society. 2005;127:12198-9
102. Impellizzeri S, McCaughan B, Callan JF, Raymo FM. Photoinduced enhancement in the luminescence of hydrophilic quantum dots coated with photocleavable ligands. Journal of the American Chemical Society. 2011;134:2276-83
103. Choi JH, Chen KH, Strano MS. Aptamer-capped nanocrystal quantum dots: A new method for label-free protein detection. Journal of the American Chemical Society. 2006;128:15584-5
104. Walker GW, Sundar VC, Rudzinski CM, Wun AW, Bawendi MG, Nocera DG. Quantum-dot optical temperature probes. Applied Physics Letters. 2003;83:3555-7
105. Gao XH, Nie SM. Quantum dot-encoded mesoporous beads with high brightness and uniformity: Rapid readout using flow cytometry. Analytical Chemistry. 2004;76:2406-10
106. Gao XH, Nie SM. Doping mesoporous materials with multicolor quantum dots. Journal of Physical Chemistry B. 2003;107:11575-8
107. Xu HX, Sha MY, Wong EY, Uphoff J, Xu YH, Treadway JA. et al. Multiplexed SNP genotyping using the QbeadTM system: a quantum dot-encoded microsphere-based assay. Nucleic Acids Research. 2003;31:e43
108. Klostranec JM, Xiang Q, Farcas GA, Lee JA, Rhee A, Lafferty EI. et al. Convergence of quantum dot barcodes with microfluidics and signal processing for multiplexed high-throughput infectious disease diagnostics. Nano Letters. 2007;7:2812-8
109. Fournier-Bidoz S, Jennings TL, Klostranec JM, Fung W, Rhee A, Li D. et al. Facile and rapid one-step mass preparation of quantum-dot barcodes. Angewandte Chemie-International Edition. 2008;47:5577-81
110. Zhao Y, Shum HC, Chen H, Adams LLA, Gu Z, Weitz DA. Microfluidic generation of multifunctional quantum dot narcode particles. Journal of the American Chemical Society. 2011;133:8790-3
111. Yeh HC, Chao SY, Ho YP, Wang TH. Single-molecule detection and probe strategies for rapid and ultrasensitive genomic detection. Current Pharmaceutical Biotechnology. 2005;6:453-61
112. Ha T, Zhuang XW, Kim HD, Orr JW, Williamson JR, Chu S. Ligand-induced conformational changes observed in single RNA molecules. Proceedings of the National Academy of Sciences of the United States of America. 1999;96:9077-82
113. Deniz AA, Dahan M, Grunwell JR, Ha TJ, Faulhaber AE, Chemla DS. et al. Single-pair fluorescence resonance energy transfer on freely diffusing molecules: Observation of Forster distance dependence and subpopulations. Proceedings of the National Academy of Sciences of the United States of America. 1999;96:3670-5
114. Zhang C-y, Johnson LW. Single quantum-dot-based aptameric nanosensor for cocaine. Analytical Chemistry. 2009;81:3051-5
115. Zhang C-Y, Johnson LW. Quantifying RNA - Peptide interaction by single-quantum dot-based nanosensor: An approach fair drug screening. Analytical Chemistry. 2007;79:7775-81
116. Zhang CY, Johnson LW. Quantum-dot-based nanosensor for RRE IIB RNA-Rev peptide interaction assay. Journal of the American Chemical Society. 2006;128:5324-5
117. Pons T, Medintz IL, Wang X, English DS, Mattoussi H. Solution-phase single quantum dot fluorescence resonance energy transfer. Journal of the American Chemical Society. 2006;128:15324-31
118. Yeh H-C, Ho Y-P, Wang T-H. Quantum dot-mediated biosensing assays for specific nucleic acid detection. Nanomedicine: nanotechnology, biology, and medicine. 2005;1:115-21
119. Yeh HC, Ho YP, Shih IM, Wang TH. Homogeneous point mutation detection by quantum dot-mediated two-color fluorescence coincidence analysis. Nucleic Acids Research. 2006;34:e35
120. Zhang C-y, Hu J. Single quantum dot-based nanosensor for multiple DNA detection. Analytical Chemistry. 2010;82:1921-7
121. Ho YP, Kung MC, Yang S, Wang TH. Multiplexed hybridization detection with multicolor colocalization of quantum dot nanoprobes. Nano Letters. 2005;5:1693-7
122. Wang J, Liu G, Wu H, Lin Y. Quantum-dot-based electrochemical immunoassay for high-throughput screening of the prostate-specific antigen. Small. 2008;4:82-6
123. Gill R, Zayats M, Willner I. Semiconductor quantum dots for bioanalysis. Angewandte Chemie-International Edition. 2008;47:7602-25
124. RodriguezViejo J, Jensen KF, Mattoussi H, Michel J, Dabbousi BO, Bawendi MG. Cathodoluminescence and photoluminescence of highly luminescent CdSe/ZnS quantum dot composites. Applied Physics Letters. 1997;70:2132-4
125. Bertoncello P. Nanomaterials for biosensing with electrochemiluminescence (ECL) detection. Frontiers in Bioscience-Landmark. 2011;16:1084-108
126. Poznyak SK, Talapin DV, Shevchenko EV, Weller H. Quantum dot chemiluminescence. Nano Letters. 2004;4:693-8
127. Chen N, He Y, Su Y, Li X, Huang Q, Wang H. et al. The cytotoxicity of cadmium-based quantum dots. Biomaterials. 2012;33:1238-44
Author contact
![]() Corresponding author: Dr. Tza-Huei Wang. Address: 3400 North Charles Street, Latrobe 108, Baltimore, MD 21218. Tel: 410-516-7086. Email: thwangedu.
Corresponding author: Dr. Tza-Huei Wang. Address: 3400 North Charles Street, Latrobe 108, Baltimore, MD 21218. Tel: 410-516-7086. Email: thwangedu.
Citation styles
APA
Zhang, Y., Wang, T.H. (2012). Quantum Dot Enabled Molecular Sensing and Diagnostics. Theranostics, 2(7), 631-654. https://doi.org/10.7150/thno.4308.
ACS
Zhang, Y.; Wang, T.H. Quantum Dot Enabled Molecular Sensing and Diagnostics. Theranostics 2012, 2 (7), 631-654. DOI: 10.7150/thno.4308.
NLM
Zhang Y, Wang TH. Quantum Dot Enabled Molecular Sensing and Diagnostics. Theranostics 2012; 2(7):631-654. doi:10.7150/thno.4308. https://www.thno.org/v02p0631.htm
CSE
Zhang Y, Wang TH. 2012. Quantum Dot Enabled Molecular Sensing and Diagnostics. Theranostics. 2(7):631-654.
This is an open access article distributed under the terms of the Creative Commons Attribution (CC BY-NC) License. See http://ivyspring.com/terms for full terms and conditions.