Theranostics
13.3
Impact Factor
 Global reach, higher impact
Theranostics 2012; 2(6):607-617. doi:10.7150/thno.4611 This issue Cite
Research Paper
Site-Specific Labeling of scVEGF with Fluorine-18 for Positron Emission Tomography Imaging
Hui Wang, Haokao Gao, Ning Guo, Gang Niu, Ying Ma, Dale O. Kiesewetter, Xiaoyuan Chen ![]()
Laboratory of Molecular Imaging and Nanomedicine (LOMIN), National Institute of Biomedical Imaging and Bioengineering (NIBIB), National Institutes of Health (NIH), Bethesda, MD 20892, USA
Received 2012-5-17; Accepted 2012-6-1; Published 2012-6-15
Citation:
Wang H, Gao H, Guo N, Niu G, Ma Y, Kiesewetter DO, Chen X. Site-Specific Labeling of scVEGF with Fluorine-18 for Positron Emission Tomography Imaging. Theranostics 2012; 2(6):607-617. doi:10.7150/thno.4611. https://www.thno.org/v02p0607.htm
Other stylesAbstract
Vascular endothelial growth factor (VEGF) is one of the most important mediators of angiogenesis. Single-chain (sc)-VEGF protein containing an N-terminal Cys-tag has been designed for site-specific modification with a variety of imaging and therapeutic moieties. Site-specific labeling of scVEGF with thiol-reactive prosthetic group, N-[2-(4-18F-fluorobenzamido) ethyl] maleimide ([18F]FBEM) for positron emission tomography (PET) imaging of VEFGR may provide a new tracer which has great potential for clinical translation.
Methods: [18F]FBEM-scVEGF was synthesized by site-specific conjugation of 18F-FBEM to a thiol group in Cys-tag of scVEGF at room temperature. The functional activity after labeling was tested by immunofluorescence staining, cellular uptake and efflux. The tumor targeting and in vivo properties were evaluated by biodistribution and microPET studies in tumor-bearing mice.
Results: The radiolabeling yield and specific activity of [18F]FBEM-scVEGF were 20.6 ± 15.1% (based on starting [18F]FBEM, uncorrected, n = 5) and 58.8 ± 12.4 GBq/µmol, respectively. Noninvasive microPET and direct tissue sampling experiments demonstrated that [18F]FBEM-scVEGF had VEGFR specific tumor uptake in MDA-MB-435, U87MG and 4T1 xenograft models. The optimal tumor uptake was achieved at 2 h p.i., which can be partially, but significantly blocked by co-injection of non-labeled scVEGF protein. Overall, [18F]FBEM-scVEGF showed VEGFR specific tumor uptake.
Conclusion: The scVEGF was site-specifically labeled with 18F via [18F]FBEM prosthetic group and the tracer [18F]FBEM-scVEGF exhibited high receptor binding affinity and tumor targeting efficacy. Further study of [18F] FBEM-scVEGF to evaluate angiogenesis in cancer and other disease types is warranted.
Keywords: Site-specific protein labeling, FBEM-scVEGF, PET imaging, VEGFR.
INTRODUCTION
Vascular endothelial growth factors (VEGFs) are the most common cancer causing angiogenic factors, and their receptors (VEGFRs) are overexpressed in tumor-associated endothelial cells [1-3]. VEGFRs are tyrosine kinases that mediate most of the proangiogenic activity of VEGF. The critical role of VEGFRs in tumor angiogenesis and their overexpression on the surface of angiogenic endothelial cells have rendered VEGFRs primary targets for anti-angiogenic therapies. A non-invasive method for assessing the presence, location(s), extent, and intensity of increased VEGF receptor expression would be of clinical value, particularly in cancer. Serial imaging of VEGF receptors expression could also be quite helpful in guiding cancer management.
Over the last several years, significant advances have been achieved in developing novel probes for multimodality molecular imaging of VEGFR expression. VEGF121 based probes have been prepared to monitor the treatment efficacy and to identify patients who may benefit from the VEGF/VEGFRs targeted therapy; for example, 64Cu labeled VEGFR-2 specific VEGF121 mutant and VEGF121/Gelonin fusion protein labeled with 64Cu and MnFe2O4 nanoparticles (VEGF121/rGel-MNPs) have been used for VEGFRs PET and PET/MRI dual modality imaging, respectively [4, 5]. Radiolabeled anti-VEGF/VEGFR antibodies, such as 89Zr-labeled bevacizimab showed the ability to determine VEGF expression levels in xenograft tumors and to predict tumor response to VEGF-targeted anti-angiogenic therapy [6, 7]. Small molecule VEGFR antagonist such as 11C-labeled Vandetanib has been synthesized, although no in vivo PET imaging data was presented [8].
Backer et al. [9] engineered a single chain VEGF (scVEGF), composed of 2 fused 3- to 112- amino acid fragments of VEGF121 and an N-terminal 15-amino acid Cys tag containing a unique cysteine residue for the site-specific attachment of a variety of agents, e.g., 64Cu, 99mTc, 68Ga etc. for PET imaging, Cy5.5 for optical imaging [10], and microbubbles for ultrasound imaging [11]. scVGEF-based tracers bind to and are internalized by VEGFRs, providing information on the prevalence and distribution of active regions of ongoing angiogenesis in vivo.
In this study, our aim is to determine whether 18F-radiolabeled scVEGF-based tracers could be used to image VGEFRs in tumor models. This study is the first attempt to synthesize a novel [18F]FBEM-scVEGF, as well as its in vitro and in vivo characterization. The use of 18F offers a number of advantages as a PET radionuclide, primarily because of its low β+ energy (0.64 Mev), almost 100% positron efficiency; and its physical half-life (t1/2 = 109.7 min) is ideally suited for peptide and some protein labeling and PET imaging [12]. In addition, 18F is routinely applied in clinical oncology in the form of fluorodeoxyglucose (FDG), a Food and Drug Administration (FDA)-approved glucose analog. Therefore, it is widely used and readily available. Despite of many advantages of 18F-labeled molecular imaging probes, most VEGFR imaging radiotracers reported to date are labeled with radiometals, such as 99mTc, 64Cu, or 68Ga. Because the physical properties and labeling strategies of non-metallic radioisotopes, such as 18F, are quite different from those of radiometals, it is worthwhile to explore the feasibility and quality of 18F labeled VEGFR imaging probes.
MATERIALS AND METHODS
General
Unless otherwise specified, all reagents were of analytical grade and were obtained from commercial sources. Lyophilized [C4]-Monothiol Cys-tagged scVEGF and Cy5.5-scVEGF were provided by SibTech Inc. [18F]F- radionuclide was obtained from the NIH clinical center cyclotron facility by proton irradiation of 18O-enriched water. Reversed-phase extraction C18 Sep-Pak cartridges were obtained from Waters Inc. and pretreated with ethanol and water before use. The syringe filter and polyethersulfone membranes (pore size, 0.22 mm; diameter, 13 mm) were obtained from Nalge Nunc International. Analytical reversed-phase high-performance liquid chromatography (RP-HPLC) was performed on a Waters 600 chromatography system with Waters 996 photodiode array detector and Beckman170 radioisotope detector.
Preparation of FBEM-scVEGF
Lyophilized [C4]-Monothiol Cys-tagged scVEGF (MW 28 kDa, SibTech Inc) was reconstituted in phosphate buffered saline (PBS) to a final protein concentration of 1 mg/mL. scVEGF (100 µg, 3.6 nmol) was treated with FBEM (N-[2-(4-fluorobenzamide)ethyl]maleimide) (3 eq.) in 100 µL degassed PBS. The reaction stood at room temperature for 1.25 h. The reaction mixture was loaded onto a NAP-5 (GE) column and after the reaction volume had loaded onto the column and additional 150 µL saline was added. The subsequent aliquots of 250 uL saline were added to elute the product. The fourth fraction contained the highest UV absorbance and was analyzed as the product.
Preparation of 18F-FBEM-scVEGF
[18F]FBEM was prepared as previously described [13]. [18F]FBEM (577 - 1435 MBq) in methylene chloride was transferred to a 1 mL Eppendorf tube and evaporated with argon flow at room temperature. The residual radioactivity was dissolved in 10 µl of ethanol; a solution of scVEGF (100 - 200 µg in 100 µL) PBS was added; and the mixture was allowed to react at room temperature for 30 min. At the end of that time, the reaction mixture was loaded onto a NAP-5 column (GE) prewashed with 10 mL saline; an additional 150 µL saline was added to the column. The product was eluted with saline in 250 µL fractions. The fraction containing the greatest amount of [18F]FBEM-scVEGF (fraction 4, range 87.5 - 283.8 MBq) was used for biological studies.
For quality control purposes, a portion of the product was re-injected onto an analytical Vydac C-4 HPLC column to assay for radiochemical purity. A gradient HPLC method was used that began with 5% B (0.1% TFA in CH3CN) and 95% A (0.1% TFA in water) for 5 min followed by a linear gradient to 65% B at 35 min. The product eluted at about 23 min as a broad tailing peak. Specific activity was estimated from a direct UV measurement of fraction 4.
Cell Culture and Animal Model
All animal studies were conducted in accordance with the principles and procedures outlined in the Guide for the Care and Use of Laboratory Animals and were approved by the Institutional Animal Care and Use Committee of Clinical Center, NIH. Porcine aortic endothelial (PAE) cells overexpressing KDR (PAE/KDR) cells were grown in Ham's F-12 medium containing 10% fetal bovine serum (FBS). The MDA-MB-435 cell line was purchased from the ATCC and grown in Leibovitz's L-15 medium supplemented with 10% (v/v) FBS under a 100% air atmosphere at 37°C. Murine breast cancer cell line 4T1 was grown in RPMI-1640 medium supplemented with 10% FBS. The human glioma U87MG cell line was purchased from ATCC and grown in α-MEM medium supplemented with 10% FBS. 4T1 cells and U87MG cells are grown in a humidified atmosphere containing 5% CO2 at 37°C. The cells were harvested with trypsin/EDTA. The MDA-MB-435 tumor model was developed in 5 to 6-week old female athymic nude mice by injection of 5×10⁶ cells in the front shoulder. The 4T1 tumor model was developed in 5 to 6‑week old female Balb/C mice (Harlan Laboratories) by injection of 2×10⁶ cells in the right front shoulders. For U87MG tumor model, the tumor cells were harvested and resuspended in cold PBS, mixed with an equal volume of cold (4°C) liquid Matrigel and immediately injected subcutaneously into the right lower flank of 5 to 6‑week old female athymic nude mice (Harlan Laboratories). Tumor growth was monitored using caliper measurements of perpendicular axes of the tumor. The tumor volume was estimated by the formula: tumor volume = a×b2/2, where a and b were the tumor length and width, respectively, in millimeters. The mice underwent small-animal PET studies when the tumor volume reached 200-500 mm3 (3-4 weeks after inoculation).
In Vitro Cellular Binding Activity
The cellular binding activity of FBEM-scVEGF was evaluated by competitive binding assay using Cy5.5-scVEGF as probe and FBEM-scVEGF as competitor in PAE/KDR cells. In brief, PAE/KDR cells were typsinized, counted, and 104 cells were seeded into 8-well Lab-Tek® Chamber slides and allowed to grow overnight. Then the cells were fixed with ice-cold acetone for 5 min, washed three times with PBS. Modified PBS supplemented with 1 mM CaCl2, 5 mM MgCl2, 0.5% (w/v) BSA and 0.3 mM NaN3 was used for immunofluorescence staining. In each well, 500 µl modified PBS containing 0.2 µg/ml Cy5.5-scVEGF (7 µM) and various concentrations of scVEGF or FBEM-scVEGF (ranged from 0-100 µg/ml) were added. After 30 min incubation at room temperature, the slides were washed three times with PBS, mounted with medium containing 4',6-diamidino-2-phenylindole (DAPI) and were observed with an epifluorescence microscope (Olympus, X81) equipped with filter sets for both DAPI (excitation, HQ 360 nm; emission, HQ 460 nm) and cyanine 5.5 (Cy5.5, excitation, HQ 675 nm; emission, HQ 694 nm). The images were analyzed with Image J software. RGB images were first split into two grayscale channels, representing blue (DAPI staining) and red (Cy5.5-scVEGF binding), respectively. Then signal intensity was measured for quantification. Since we seeded same number of cells into each well, and the cells were allowed to attach to culture vessels for 12 h, we assumed that the cell numbers at staining time were the same. Therefore, we compared fluorescence intensity of each well as an indirect method to evaluate cellular binding activity of FBEM-scVEGF.
In gel autoradiography
To further confirm the radiolabeling of scVEGF, [18F]FBEM-scVEGF and non-labeled scVEGF protein were mixed with equal volume of 2× NuPAGE® LDS sample buffer, and loaded onto Nu-PAGE 4-12% Bis-Tris gel. After electrophoresis, the separating gel was transferred into a plastic container with lid and rinsed briefly in 50 mM Tris·HCl (pH 7.0) to remove excess running buffer. Two gels were run in parallel. After electrophoresis, one gel was stained with Coomassie Blue to visualize the protein bands, the other gel was placed onto an autoradiography cassette containing a super resolution screen (Packard), read by Storage Phosphor System Cyclone Plus using Image Reader BAS-5000 software.,
Cell Uptake, Internalization, and Efflux Studies
Cell uptake, internalization, and efflux of 18F-FBEM-scVEGF protein were performed in PAE/KDR cells. For cell uptake, PAE/KDR cells were seeded into 24-well plates at a density of 1×10⁵ cells per well and incubated with 18.5 kBq /well (7.5-11 ng) of [18F]FBEM-scVEGF at 37°C for 15, 30, 60, and 120 min with or without an excess amount of 0.1 M scVEGF protein. The cells were then washed three times with chilled PBS and lysed with 200 µL 0.1 M NaOH. For internalization, the percentage of [18F]FBEM-scVEGF activity trapped in the cells was determined after removing [18F]FBEM-scVEGF activity bound to the cell surface by washing three times with an acid buffer (50 mM glycine and 0.1 M NaCl, pH 2.8). For efflux studies, about 18.5 kBq/well of [18F]FBEM-scVEGF were first incubated with PAE/KDR cells in 24-well plates for 2 h at 37°C. The cells were washed three times with chilled PBS and allowed to stand with fresh buffer. At various time points, the medium was removed and the cells washed three times with chilled PBS. The cells were then lysed with 200 µL 0.1 M NaOH. The cell lysate was collected and the remaining radioactivity was measured in a γ counter (Packard, Meriden, CT). The cell uptake, internalization and efflux were expressed as the percentage of the added dose (%AD) after decay correction. All experiments were performed three times with triplicate wells.
MicroPET Imaging
PET scans and image analysis were performed using an Inveon microPET scanner (Siemens Medical Solutions). To determine the optimal timing for PET imaging, about 3.7 MBq [0.05-0.08 nmol of [18F]FBEM-scVEGF] were administered via tail vein injection under isoflurane anesthesia, and 10-min static PET images were acquired at 0.5, 1.0 and 2.0 h post-injection (p.i.; n = 3/group). For VEGFR blocking experiment, 5.4 nmol non-labeled scVEGF protein was co-injected with 3.7 MBq of [18F]FBEM-scVEGF into 4T1 tumor mice and 10-min static PET images were acquired at 2 h time point (n = 3). PET Images were reconstructed by a 3-dimensional ordered-subset expectation maximum (3D OSEM) followed by maximum a posteriori (MAP) algorithm. For each scan, regions of interest (ROIs) were drawn over the tumor and major organs using vendor software (ASI Pro 5.2.4.0) on decay-corrected whole-body coronal images. The radioactivity concentrations (accumulation) within the tumors, muscle, liver, and kidneys were obtained from mean pixel values within the multiple ROI volume and then converted to MBq per milliliter per minute using the calibration factor determined for the Inveon PET system. These values were then divided by the administered activity to obtain (assuming a tissue density of 1 g/ml) an image-ROI-derived percent injected dose per gram (%ID/g).
Biodistribution Studies
For distribution studies, about 3.7 MBq per mouse of [18F]FBEM-scVEGF (n = 6) was injected via the tail vein. For VEGFR blocking experiment, 5.4 nmol non-labeled scVEGF protein was co-injected with 3.7 MBq of [18F]FBEM-scVEGF into tumor mice (n = 4). At 2 h p.i., the animals were sacrificed and dissected. Blood, tumor, major organs and tissues were collected and wet-weighed. The radioactivities in the wet whole tissue were counted in a γ-counter (Wallac Wizard 3, Perkin-Elmer) along with three samples of standard activity (1/100 of injected dose). Results were calculated as the average of percent injected dose per gram of tissue (%ID/g) ± 1 standard deviation of the mean.
Immunohistochemical Staining
Frozen tumor tissue sections (thickness, 5 µm) were fixed with cold acetone for 10 min and air dried for 30 min at room temperature. After being blocked with 2% BSA for 30 min, the sections were incubated with rat anti-VEGFR2 antibody (1:100; Abcam) and rabbit anti-CD31 antibody (1:500; Abcam) for 2 h at r.t. After washing with PBS, the sections were further incubated with FITC-conjugated goat anti-rat secondary antibody and Cy3-conjugated donkey anti-rabbit secondary antibody (1:500; Jackson ImmunoResearch Laboratories, West Grove, PA) for 1 h at r.t. After PBS washing (3×), the slides were mounted with medium containing DAPI and were observed with an epifluorescence microscope (Olympus, X81) equipped with filter sets for both DAPI (excitation, HQ 360 nm; emission, HQ 460 nm), fluorescein isothiocyanate (FITC) (excitation, HQ 488 nm; emission, HQ 520 nm) and Cy3 (excitation, HQ 550 nm; emission, HQ 570 nm).
Data Analysis
Quantitative data are expressed as mean ± SD. Means were analyzed by unpaired, two-tailed t-test using GraphPad Prism (version 4.00 for Windows GraphPad Software, San Diego, CA) in order to determine any significant differences (P < 0.05).
RESULTS
Chemistry and Radiochemistry
scVEGF is a 28 kDa fusion protein containing a cys-tag (KESCAKKFQRQHMDS) at the N-terminus. After preparation and lyophilization, the sulfhydryl functional group remains in a free form and will react with thiol specific functional group, e.g. maleimide. A small quantity of non-radioactive FBEM-scVEGF was prepared and the identity established by ESI-MS. ESI-MS deconvolution m/z is 28072 (Calculated 28086). The radioactive version, [18F]FBEM-scVEGF was prepared in the same manner by using [18F]FBEM in the conjugation reaction. The radiochemical yield based on starting [18F]FBEM was 20.6 ± 15.1% (n = 5, uncorrected) in about 38 min. The radiochemical purity was assessed by radio-HPLC. The peak for the desired product was broad with significant tailing, but no other radiochemical peaks were observed. The specific activity was estimated from the UV absorbance at 280 nm using the absorbance of unmodified scVEGF as the control. The value was 58.8 ± 12.4 GBq/µmol (n = 3) at the end of synthesis.
Characterization of [18F]FBEM-scVEGF
We first evaluated whether FBEM-scVEGF conjugate retained its native affinity for VEGFR-2 using immunofluorescence staining performed with PAE/KDR cells. As shown in Figure 1A, FBEM-scVEGF can effectively inhibit Cy5.5-scVEGF binding to PAE/KDR cells in a dose-dependent manner. The IC50 value of FBEM-scVEGF was 19.98 ± 5.39 µg/mL, which is slightly higher than that of non-labeled scVEGF (13.99 ± 1.80 µg/mL, P = 0.3516) (Figure 1B). The result demonstrated that FBEM conjugation of scVEGF did not significantly affect its binding affinity to VEGFRs.
scVEGF may exist in a mixed form consisting of monomers and dimers. In gel autoradiography result was analyzed by using gel quantification analysis function in Image J. Ten microgram non-labeled scVEGF (Figure 1C, lane a) were consisted of 89.6% monomer and 7.8% dimer, and did not show any signal in the autoradiography (Figure 1C, lane c). After [18F]FBEM labeling, the percentages of monomer were 82.1% and 83.6% as assessed by Coomassie Blue staining (Figure 1C, lane b) and autoradiography (Figure 1C, lane d), respectively. Slightly increased dimer content in the case of autoradiography may be a result of air oxidation of cysteine during radiolabeling procedure.
The cell uptake and efflux of [18F]FBEM-scVEGF were evaluated in PAE/KDR cells. As shown in Figure 1D, uptake of 18F-FBEM-scVEGF by PAE/KDR cells increased with time, which peaked after 60 min incubation. The total cell uptake values of 18F-FBEM-scVEGF were 8.62 ± 0.41, 12.85 ± 0.13, 16.89 ± 0.55, and 13.51 ± 0.51 percent of added dose (%AD) after 15, 30, 60, and 120 min incubation, respectively. [18F]FBEM-scVEGF also showed a relatively high level of internalization, with 8.46 ± 0.63, 12.73 ± 0.28, 15.38 ± 0.89, and 12.34 ± 0.38 %AD radioactivity internalized after 15, 30, 60, and 120 min incubation, respectively (Figure 1D, internalization). Complete inhibition of cell uptake was observed with the presence of 100 µg/ml scVEGF protein, confirming the specificity of VEGFR2 mediated cell uptake (Figure 1D, Block). When the labeled cells were incubated in serum-free medium devoid of radioactivity, [18F]FBEM-scVEGF showed efflux from the cells with time (Figure 1E). After 1 h, approximately 50% of the radioactivity was dissociated from the cells.
Serial PET imaging Studies With [18F]FBEM-scVEGF
To determine the in vivo kinetics, [18F]FBEM-scVEGF was injected intravenously into MDA-MB-435 tumor bearing mice and microPET scans were carried out at various time points p.i. Representative coronal slices that contained the tumor were shown in Figure 2. The tumor uptake of [18F]FBEM-scVEGF was 0.64 ± 0.14, 1.41 ± 0.53, and 1.38 ± 0.38 %ID/g at 0.5, 1.0, and 2.0 h p.i., respectively. Although the tumor uptake was comparable at 1.0 h and 2.0 h p.i., the tumor-to-background ratio increased over time. Tumor-to-muscle ratio was increased by 63.8% from 1.06 ± 0.14 at 0.5 h p.i. to 1.74 ± 0.29 at 2.0 h; tumor-to-kidney ratio was increased by 1.96-fold from 0.056 ± 0.124 at 0.5 h p.i. to 0.166 ± 0.023 at 2 h p.i. Tumor-to-organ ratios are essential as they determine imaging contrast and sensitivity; therefore, we choose 2 h time point for other experiments.
[18F]FBEM-scVEGF PET Imaging in U87MG Tumor Model
The data concerning in vivo distribution of [18F]FBEM-scVEGF in U87MG tumor-bearing athymic nude mice were presented in Figure 3. Kidney uptake of [18F]FBEM-scVEGF in these U87MG tumor mice was relatively high with 27.2 ± 4.9 %ID/g at 2 h p.i. (n = 5). The tumor uptake of [18F]FBEM-scVEGF at 2 h time point was 0.340 ± 0.03 %ID/g, at which the muscle uptake of [18F]FBEM-scVEGF was 0.22 ± 0.04 %ID/g. Tumor-to-muscle ratio was 1.78 ± 0.25. Therefore, [18F]FBEM-scVEGF PET images provided reasonably good signal-to-noise ratio. Pre-saturation of the receptor by excess amount of non-labeled scVEGF protein (150 µg/mouse) resulted in 36.05% decrease (n = 3, P = 0.0003) of radioactivity accumulation as compared with non-blocking group (Fig. 4C), which demonstrated that tumor uptake of [18F]FBEM-scVEGF was VEGFR specific.
Figure 1
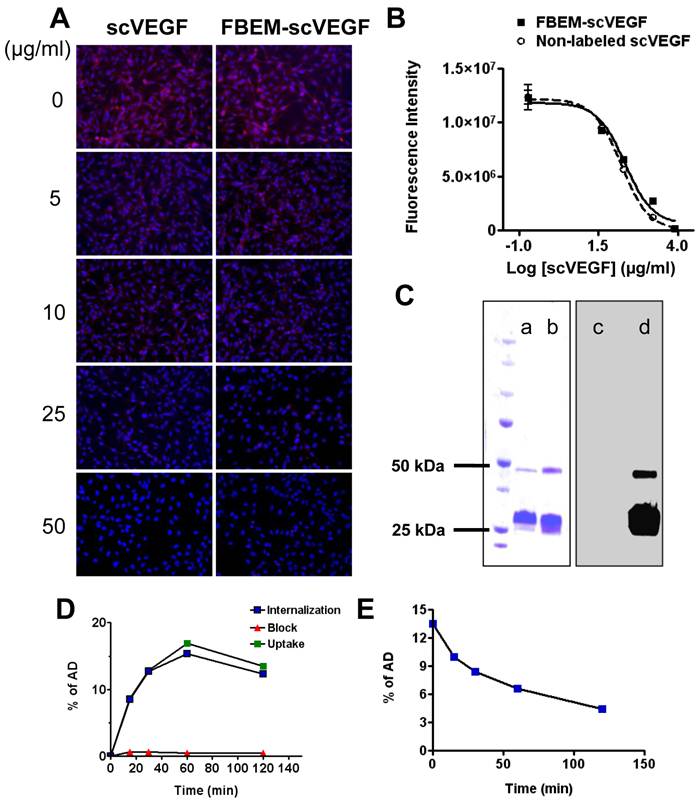
Characterization of FBEM-scVEGF conjugates and [18F]FBEM-scVEGF. (A) Inhibition of Cy5.5-scVEGF (Red) binding to VEGFR2 overexpressed on PAE/KDR cells by different concentrations of non-labeled scVEGF and FBEM-conjugated scVEGF. (B) The IC50 values were 19.98±5.39 µg/ml and 13.99±1.80 µg/ml for FBEM-scVEGF and scVEGF, respectively as determined by relative fluorescence units derived from images in (A) by Image J software. (C) In gel autoradiography showed that 18F-FBEM-scVEGF existed as a mixture of monomer and dimer. (a-d) showed scVEGF protein and [18F]FBEM-scVEGF stained with Coomassie blue (a and b, respectively), or autoradiography (c and d, respectively). (D) Cell uptake, internalization and efflux (E) assay of [18F]FBEM-scVEGF on PAE/KDR cells. Data were from 2 experiments with triplicate samples and are expressed as mean ± SD. AD, total added dose.
Figure 2
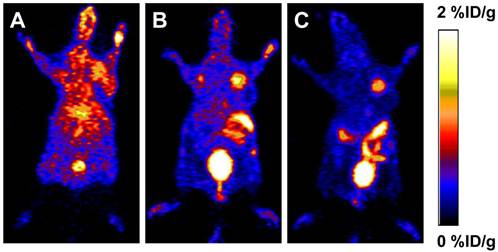
PET study in MDA-MB-435 tumor-bearing mice. Decay-corrected whole-body coronal microPET images of athymic female nude mice bearing MDA-MB-435 tumor at 0.5 h (A), 1 h (B) and 2 h (C) after injection of [18F]FBEM-scVEGF (3.7MBq).
Figure 3
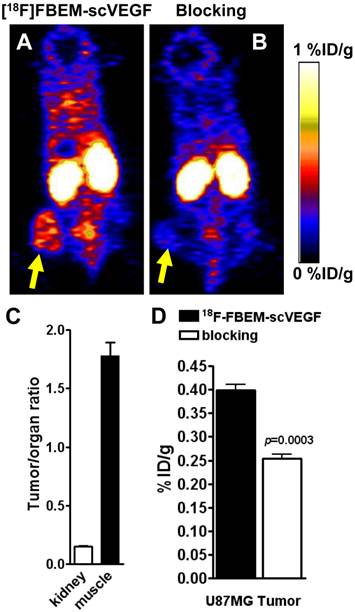
PET study in U87MG tumor-bearing mice. Decay-corrected whole-body coronal microPET images of athymic nude mice bearing U87MG tumors at 2 h p.i. of [18F]FBEM-scVEGF (3.7MBq), unblocked (A) and blocked (B). (C) Tumor-to-kidney and tumor-to-muscle ratios at 2 h p.i. of [18F]FBEM-scVEGF. (D) Uptake values at 2 h p.i. in the U87MG tumor in the presence or absence of scVEGF protein.
Figure 4
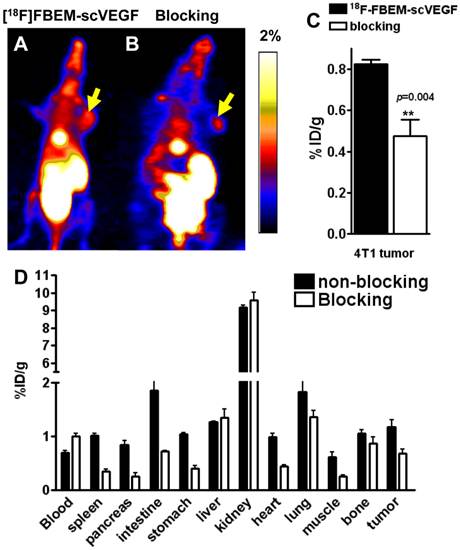
PET study in 4T1 tumor-bearing mice. Decay-corrected whole-body coronal microPET images of Balb/C mice bearing 4T1 tumors at 2 h p.i. of [18F]-FBEM-scVEGF (3.7MBq), unblocked (A) and blocked (B). (C) Uptake values at 2 h p.i. in the 4T1 tumor in the presence or absence of scVEGF protein. (D) Biodistribution of [18F]FBEM-scVEGF in Balb/C mice bearing subcutaneous 4T1 tumors after microPET imaging at 2 h time point (n = 6).
[18F]FBEM-scVEGF PET Imaging and Biodistribution in 4T1 Tumor Model
Furthermore, we performed microPET imaging of [18F]FBEM-scVEGF in 4T1 tumor-bearing Balb/C mice. Representative coronal images were shown in Figure 4A and 4B. The tumor uptake of [18F]FBEM-scVEGF was 0.82 ± 0.04 %ID/g at 2 h p.i. (Fig. 4A). Pre-saturation of the receptors by excess amount of non-labeled scVEGF protein (150 µg/mouse) resulted in 48.02% decrease (P = 0.004) of radioactivity accumulation as compared with non-blocking group (Fig. 4C).
The accuracy of PET imaging quantification was further confirmed by biodistribution study of [18F]FBEM-scVEGF in 4T1 tumor mice immediately after PET imaging. Besides the kidneys, the lung and intestine also had significant tracer uptake. The lung has been reported to express both VEGFR-1 and VEGFR-2 [14, 15], and significant uptake in the lung was also observed in previous reports of VEGF-based tracers [10, 16]. The tumor/muscle ratio was 2.19 ± 0.54 at 2 h time point. The quantification results obtained from biodistribution studies and PET scans were similar for the 4T1 tumor and most organs, confirming that quantitative ROI analysis of noninvasive microPET scans truly reflects the biodistribution of [18F]FBEM-scVEGF in vivo.
To confirm the VEGFR specificity of 18F-FBEM-scVEGF in vivo, blocking experiments were carried out where 150 µg of scVEGF was co-injected with [18F]FBEM-scVEGF into 4T1 tumor-bearing mice. The tumor uptake was significantly reduced to 0.68 ± 0.15 %ID/g, confirming VEGFR specificity of the tracer (Fig. 4D).
Figure 5
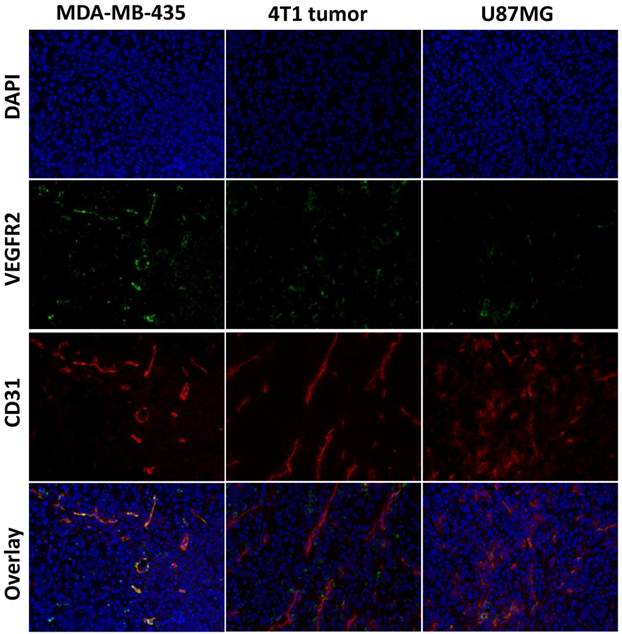
Immunofluorescence staining of VEGFR2 and CD31 for MDA-MB-435, U87MG, and 4T1 tumors. The tissue sections were stained with anti-VEGFR2 antibody (green) to identify VEGFR2 expression, anti-CD31 antibody (red) to identify vasculature, and DAPI (blue) to identify nuclei.
Immunofluorescence Staining
To evaluate VEGFR expression in each tumor tissue, immunofluorescence staining was carried out, and representative images of CD31 and VEGFR-2 staining of MDA-MB-435, U87MG and 4T1 tumor tissue slices were shown in Figure 5. The results showed strong VEGFR-2 staining in both MDA-MB-435 and 4T1 tumors, and relatively weaker staining in U87MG tumors, which was consistent with the PET imaging results that MDA-MB-435 tumors and 4T1 tumors have higher tumor uptake than U87MG tumors.
DISCUSSION
An accurate assessment of VEGFR expression is crucial for the selection of patients that may benefit from VEGFR-targeted therapies. Currently, ex vivo techniques, such as immunohistochemistry and fluorescence in situ hybridization, are used to estimate VEGFR expression before recommending VEGFR-targeted molecular therapies. Downstream effects of VEGFR-directed therapy are imaged in the clinic by computed tomography (CT) and dynamic contrast-enhanced magnetic resonance imaging (DCE-MRI). However, molecular imaging of the drug target itself, such as VEGFRs, provides critical information on the target prevalence, opening opportunities for treatment management and optimization. The high resolution, sensitivity, and quantitative nature of PET imaging offer an ideal method for assessing VEGFR expression status. Radiotracers suitable for non-invasive imaging of VEGFRs in vivo have been previously reported. Different fragments of VEGF labeled with 64Cu have been used for VEGFR imaging, such as 64Cu-DOTA-VEGF121/rGel [4], 64Cu-DOTA-VEGF121, 64Cu-DOTA-VEGFDEE, etc. [17]; small molecules inhibitors acting on the intracellular TK domain of the VEGF receptors has been labeled with shorter-lived radioisotopes to image VEGF receptors more frequently throughout a therapeutic protocol [18]. scVEGF has been labeled in a site-specific manner with a variety of agents for VEGFR imaging. For example, 68Ga-N,N'-bis[2-hydroxy-5-(carboxyethyl)benzyl]ethylenediamine-N,N'-diacetic acid-PEG-scVEGF (68Ga-HBED-CC-PEG-scVEGF) [19], 68Ga-1,4,7-triazacyclononane-1,4,7-triacetic acid-PEG-scVEGF (68Ga-NOTA-PEG-scVEGF) [19]; 64Cu-DOTA-scVEGF and 99mTc-hydrazinonicotinic acid (HYNIC)-scVEGF (99mTc-HYNIC-scVEGF) [10], etc.
This article has described the synthesis of 18F-labeled scVEGF at pre-designed C4-cysteine residue to allow radiolabeling with the thiol-specific prosthetic group, FBEM. Our data showed that FBEM conjugation of scVEGF doesn't affect binding affinity of scVEGF protein. [18F]FBEM-scVEGF can be specifically internalized into VEGFR2 overexpressing PAE/KDR cells. In vivo PET imaging demonstrated VEGFR-mediated [18F]FBEM-scVEGF uptake in several xenograft models.
Modification of a targeting ligand for imaging applications should always be performed with utmost caution, since in many cases non-specific conjugation of chelators (for radiometal labeling) or other prosthetic groups (e.g. for 11C/18F-labeling) may affect the target binding affinity/specificity of the ligand. scVEGF is an engineered 28 kDa single-chain VEGF, consisting of two 3-112 fragments of human VEGF121 cloned head-to-tail and fused to an N-terminal Cys-tag with C4-thiol group. The available free thiol of the C-4 thiol group reacted specifically with the maleimide of FBEM to provide the site-specifically labeled [18F]FBEM-scVEGF. Site-specific conjugation of the prosthetic group FBEM did not affect its VEGFR-2 binding affinity as indicated by competitive binding assay. The variability in both the yield and the specific activity of the obtained product was due to variation in the stoichiometry of the reaction and the input amount of scVEGF protein. In one case, we attempted to increase the yield of product by doubling the amount of substrate protein used. This resulted in a dramatic increase in the radiochemical yield but no real change in the specific activity of the resulting product. The specific activity of the prosthetic [18F]FBEM was not measured, but historically was observed to be in the range between 180 and 350 GBq/µmol at the end of bombardment [20]. This specific activity is subject to the cyclotron irradiation parameters and the time of the synthesis. Thus at time of synthesis for the protein, the lowest radioactivity that we used (577.2 MBq) led to the lowest specific activity of 90 GBq/µmol (correction of 180 GBq/µmol by one half-life) would mean that we added 6.4 nmol FBEM. The amount of protein used for the synthesis was 3.6 nmol or in one case 7.2 nmol. Therefore the protein was in molar deficiency in most cases. This explains the relatively low yield and the large yield increase when the amount of protein was doubled.
[18F]FBEM-scVEGF showed favorable in vivo distribution. First, kidney accumulation of [18F]FBEM-scVEGF is lower than other radiometal labeled scVEGF probes. The average kidney uptakes of 68Ga-labeled scVEGF at 2 h p.i. were 179.0 ± 20.0 and 118.5 ± 3.6 %ID/g for scVEGF-PEG-HBEM-CC and scVEGF-PEG-NOTA, respectively [19]. [18F]FBEM-scVEGF proved to be efficient in decreasing nonspecific renal uptake, which was only 9.17 ± 0.25 %ID/g in 4T1 tumor-bearing Balb/C mice. In addition, the liver uptake of [18F]FBEM-scVEGF was 1.31 ± 0.18 %ID/g, lower than that reported for 68Ga-labeled scVEGF (3.62 ± 1.11 and 5.43 ± 0.76 %ID/g for scVEGF-PEG-HBEM-CC and scVEGF-PEG-NOTA), 99mTc-labeled scVEGF (around 6 %ID/g) and 64Cu-labeled scVEGF (7-8%ID/g).
The absolute tumor uptake of [18F]FBEM-scVEGF is low compared to other reports using radiometal labeled VEGFR targeting PET tracers. For example, tumor uptake of 64Cu-DOTA-VEGF121 was 4.6 ± 0.5 %ID/g at 4 h p.i. in 4T1 tumor models [21], whereas that of [18F]FBEM-scVEGF at 2 h was 0.82 ± 0.04 %ID/g. However, due to different properties of each radionuclide and radiochemistry applied during labeling procedure, direct literature data comparison is insufficient to draw a conclusion concerning the advantages and disadvantages of particular formats of imaging agents. Furthermore, from coronal PET images shown in Figure 4A, we can see a hot spot in the upper abdomen which suggested gallbladder accumulation of radioactivity, which may be explained by the fact that [18F]FBEM-scVEGF is not very stable in vivo and the hydrophobic group in the tracer was chopped off and accumulated in the gallbladder. We will further modify radiochemistry strategy to increase the stability of 18F-labeled scVEGF, increase tumor uptake and decrease the tracer accumulation in other organs.
CONCLUSION
The new tracer [18F]FBEM-scVEGF was synthesized with reasonably high specific activity via [18F]FBEM and the tracer exhibited high receptor binding affinity, tumor targeting efficacy, and favorable in vivo distribution for imaging contrast, although at a cost of lower tumor uptake and weaker signal from tumors. This tracer is expected to have potential for noninvasive PET imaging of VEGFR expression for tumor diagnosis and prediction of cancer treatment response.
Acknowledgements
This work was supported by the Intramural Research Program (IRP) of the National Institute of Biomedical Imaging and Bioengineering (NIBIB), National Institute of Health (NIH). H.W. holds an Imaging Science Training Fellowship, which is jointly supported by the Radiology and Imaging Sciences Department, NIH Clinical Center and the Intramural Research Program, NIBIB, NIH. We acknowledged the NIH/CC cyclotron facility for isotope production.
Competing Interests
The author has declared that no competing interest exists.
References
1. Carmeliet P. Angiogenesis in life, disease and medicine. Nature. 2005;438:932-6
2. St Croix B, Rago C, Velculescu V, Traverso G, Romans KE, Montgomery E. et al. Genes expressed in human tumor endothelium. Science. 2000;289:1197-202
3. Zou L, Lai H, Zhou Q, Xiao F. Lasting controversy on ranibizumab and bevacizumab. Theranostics. 2011;1:395-402
4. Hsu AR, Cai W, Veeravagu A, Mohamedali KA, Chen K, Kim S. et al. Multimodality molecular imaging of glioblastoma growth inhibition with vasculature-targeting fusion toxin VEGF121/rGel. J Nucl Med. 2007;48:445-54
5. Jang B, Choi Y. Photosensitizer-conjugated gold nanorods for enzyme-activatable fluorescence imaging and photodynamic therapy. Theranostics. 2012;2:190-7
6. Nagengast WB, de Vries EG, Hospers GA, Mulder NH, de Jong JR, Hollema H. et al. In vivo VEGF imaging with radiolabeled bevacizumab in a human ovarian tumor xenograft. J Nucl Med. 2007;48:1313-9
7. Nagengast WB, Lub-de Hooge MN, Oosting SF, den Dunnen WF, Warnders FJ, Brouwers AH. et al. VEGF-PET imaging is a noninvasive biomarker showing differential changes in the tumor during sunitinib treatment. Cancer Res. 2011;71:143-53
8. Gao M, Lola CM, Wang M, Miller KD, Sledge GW, Zheng QH. Radiosynthesis of [11C]Vandetanib and [11C]chloro-Vandetanib as new potential PET agents for imaging of VEGFR in cancer. Bioorg Med Chem Lett. 2011;21:3222-6
9. Backer MV, Patel V, Jehning BT, Claffey KP, Backer JM. Surface immobilization of active vascular endothelial growth factor via a cysteine-containing tag. Biomaterials. 2006;27:5452-8
10. Backer MV, Levashova Z, Patel V, Jehning BT, Claffey K, Blankenberg FG. et al. Molecular imaging of VEGF receptors in angiogenic vasculature with single-chain VEGF-based probes. Nat Med. 2007;13:504-9
11. Anderson CR, Rychak JJ, Backer M, Backer J, Ley K, Klibanov AL. scVEGF microbubble ultrasound contrast agents: a novel probe for ultrasound molecular imaging of tumor angiogenesis. Invest. Radiology. 2010;45:579-85
12. Yang M, Gao H, Zhou Y, Ma Y, Quan Q, Lang L. et al. 18F-Labeled GRPR Agonists and Antagonists: A Comparative Study in Prostate Cancer Imaging. Theranostics. 2011;1:220-9
13. Kiesewetter DO, Jacobson O, Lang L, Chen X. Automated radiochemical synthesis of [18F]FBEM: a thiol reactive synthon for radiofluorination of peptides and proteins. Appl Radiat Isot. 2011;69:410-4
14. Jiang W, Zhang YJ, Kahn SM, Hollstein MC, Santella RM, Lu SH. et al. Altered expression of the cyclin D1 and retinoblastoma genes in human esophageal cancer. Proc Natl Acad Sci U S A. 1993;90:9026-30
15. Shibuya M, Yamaguchi S, Yamane A, Ikeda T, Tojo A, Matsushime H. et al. Nucleotide sequence and expression of a novel human receptor-type tyrosine kinase gene (flt) closely related to the fms family. Oncogene. 1990;5:519-24
16. Yoshimoto M, Kinuya S, Kawashima A, Nishii R, Yokoyama K, Kawai K. Radioiodinated VEGF to image tumor angiogenesis in a LS180 tumor xenograft model. Nucl Med Biol. 2006;33:963-9
17. Wang H, Cai W, Chen K, Li ZB, Kashefi A, He L. et al. A new PET tracer specific for vascular endothelial growth factor receptor 2. Eur J Nucl Med Mol Imaging. 2007;34:2001-10
18. Samen E, Thorell JO, Lu L, Tegnebratt T, Holmgren L, Stone-Elander S. Synthesis and preclinical evaluation of [11C]PAQ as a PET imaging tracer for VEGFR-2. Eur J Nucl Med Mol Imaging. 2009;36:1283-95
19. Eder M, Krivoshein AV, Backer M, Backer JM, Haberkorn U, Eisenhut M. ScVEGF-PEG-HBED-CC and scVEGF-PEG-NOTA conjugates: comparison of easy-to-label recombinant proteins for [68Ga]PET imaging of VEGF receptors in angiogenic vasculature. Nucl Med Biol. 2010;37:405-12
20. Kiesewetter DO, Jacobson O, Lang L, Chen X. Automated radiochemical synthesis of [18F]FBEM: a thiol reactive synthon for radiofluorination of peptides and proteins. Appl Radiat Isot. 2011;69:410-4
21. Chen K, Cai W, Li ZB, Wang H, Chen X. Quantitative PET imaging of VEGF receptor expression. Mol Imaging Biol. 2009;11:15-22
Author contact
![]() Corresponding author: Dr. Xiaoyuan Chen, Laboratory of Molecular Imaging and Nanomedicine (LOMIN), National Institute of Biomedical Imaging and Bioengineering (NIBIB), National Institutes of Health (NIH), 31 Center Drive, Suite 1C14, Bethesda, MD 20892-2281. Email: shawn.chengov.
Corresponding author: Dr. Xiaoyuan Chen, Laboratory of Molecular Imaging and Nanomedicine (LOMIN), National Institute of Biomedical Imaging and Bioengineering (NIBIB), National Institutes of Health (NIH), 31 Center Drive, Suite 1C14, Bethesda, MD 20892-2281. Email: shawn.chengov.
Citation styles
APA
Wang, H., Gao, H., Guo, N., Niu, G., Ma, Y., Kiesewetter, D.O., Chen, X. (2012). Site-Specific Labeling of scVEGF with Fluorine-18 for Positron Emission Tomography Imaging. Theranostics, 2(6), 607-617. https://doi.org/10.7150/thno.4611.
ACS
Wang, H.; Gao, H.; Guo, N.; Niu, G.; Ma, Y.; Kiesewetter, D.O.; Chen, X. Site-Specific Labeling of scVEGF with Fluorine-18 for Positron Emission Tomography Imaging. Theranostics 2012, 2 (6), 607-617. DOI: 10.7150/thno.4611.
NLM
Wang H, Gao H, Guo N, Niu G, Ma Y, Kiesewetter DO, Chen X. Site-Specific Labeling of scVEGF with Fluorine-18 for Positron Emission Tomography Imaging. Theranostics 2012; 2(6):607-617. doi:10.7150/thno.4611. https://www.thno.org/v02p0607.htm
CSE
Wang H, Gao H, Guo N, Niu G, Ma Y, Kiesewetter DO, Chen X. 2012. Site-Specific Labeling of scVEGF with Fluorine-18 for Positron Emission Tomography Imaging. Theranostics. 2(6):607-617.
This is an open access article distributed under the terms of the Creative Commons Attribution (CC BY-NC) License. See http://ivyspring.com/terms for full terms and conditions.