13.3
Impact Factor
Theranostics 2012; 2(2):215-226. doi:10.7150/thno.3885 This issue Cite
Research Paper
FLIM-FRET Imaging of Caspase-3 Activity in Live Cells Using Pair of Red Fluorescent Proteins
1. A.N.Bach Institute of Biochemistry of the Russian Academy of Science, Moscow 119071, Russia;
2. Evrogen JSC, Miklukho-Maklaya 16/10, Moscow, 117420, Russia;
3. Department of Chemistry, M.V. Lomonosov Moscow State University, Moscow 119991, Russia;
4. N.M. Emanuel Institute of Biochemical Physics, Russian Academy of Sciences, Moscow 119334, Russia.
Received 2011-12-30; Accepted 2012-1-18; Published 2012-2-15
Abstract
We report a new technique to detect enzyme activity inside cells. The method based on Fluorescence Lifetime Imaging (FLIM) technology allows one to follow sensor cleavage by proteolytic enzyme caspase-3. Specifically, we use the FLIM FRET of living cells via the confocal fluorescence microscopy. A specially designed lentivector pLVT with the DNA fragment of TagRFP-23-KFP was applied for transduction of A549 cell lines. Computer simulations are carried out to estimate FRET efficiency and to analyze possible steric restrictions of the reaction between the substrate TagRFP-23-KFP and caspase-3 dimer. Successful use of the fuse protein TagRFP-23-KFP to register the caspase-3 activation based on average life-time measurements is demonstrated. We show that the average life-time distribution is dramatically changed for cells with the modified morphology that is typical for apoptosis. Namely, the short-lived component at 1.8-2.1 ns completely disappears and the long-lived component appears at 2.4-2.6 ns. The latter is a fingerprint of the TagRFP molecule released after cleavage of the TagRFP-23-KFP complex by caspase-3. Analysis of life-time distributions for population of cells allows us to discriminate apoptotic and surviving cells within single frame and to peform statistical analysis of drug efficiency. This system can be adjusted for HTS by using special readers oriented on measurements of fluorescence life-time.
Keywords: FRET, FLIM, red fluorescent proteins (RFP), caspase, molecular dynamics (MD), lentiviral vector.
INTRODUCTION
Fluorescence imaging and spectroscopy is a powerful tool for visualizing dynamic processes in living cells at different levels of temporal and spatial resolution, from individual molecules to entire organisms [1]. Fluorescent proteins (FPs) are widely used as noninvasive fluorescence markers for gene expression and protein localization in cellular and molecular biology as well as efficient biosensors [2,3,4,5,6,7,8]. Linking them to proteins of interest usually results in weak or negligible effects on the native properties of these proteins [5].
Numerous molecular and cellular processes in cells and intact living organisms can be traced by using fluorescent proteins as in vivo markers for continuous visual monitoring [1,9,10,11,12]; and heterologous expression of FPs can be accomplished in cells and organisms of any type. We select proteolytic enzyme caspase-3 because of its importance for caspase-dependent activation of programming cell death – apoptosis. Several mechanisms of apoptosis induction through mitochondria or outer membrane receptors are known. All corresponding pathways are crossed at the step of caspase-3 activation and measurement of caspase-3 activity what is vitally essential for drug design and screening [13].
A key issue for imaging deeper into tissue is to use red excitation light because of the reduced absorption, scattering, and autofluorescence at these wavelengths [14,15]. Application of FPs with the emission spectrum in the orange/red region permits to increase the penetration depth of fluorescence imaging [6,16,17]. The greatest advantage of orange and red fluorescent proteins is due to their perspectives in translation of future cell sensors for small laboratory animals.
An important application of FPs is the Förster Resonance Energy Transfer or FRET. Employing FRET between two fluorescent proteins opens new perspectives for using fluorescent proteins as the live-cell markers for monitoring biological and physiological mechanisms. They can be constructed by using simple genetic manipulations, and these biosensors can be targeted to organelles or tissues, that permits monitoring not only of organelles and individual cells but also of entire organisms [10]. The sensors on caspase-3 described in literature usually employ either the BFG-GFP pair, which is excited by the UV light toxic for living cells, or the GFP-YFP pair. In both cases stationary fluorescence is measured within the very narrow range because of spectral overlap of donor and acceptor, and as a result, simultaneous excitation of donor and acceptor occurs [18]. One of the most precise methods for FRET measurements is the Fluorescence Life-time Imaging Microscopy (FLIM) [19,20]. The use of FLIM allows one to improve precision of measurement of energy transfer; however, the dynamic range of measurements remains fairly narrow even upon measuring distributions of average life-times [21] and it does not take into account influence of fairly high autofluorescence in the blue-cyan spectral range on accuracy of measurements. When using the TagGFP-TagRFP pair, primary spectral measurements are performed at the emission wavelength of TagGFP [22]; therefore, the dynamical range of measurements is also affected by high autofluorescence in blue-cyan spectral range.
Red FP’s (RFP) are promising acceptors in prospective FRET pairs [23,24,25,26,27,28]. Using RFPs is especially promising to achieve better separation of emission peaks, to decrease auto-fluorescence of tissues, and to increase penetration of light deeper into tissue. Additionally, the excitation light for RFPs is significantly less phototoxic to cells.
To achieve efficient energy transfer, a favorable spectral overlap between donor and acceptor is required, and the spectra of donor and acceptor should be sufficiently distinct from each other, in particular to suppress spectral bleed-through and direct acceptor excitation. Usually FRET pairs compromise between these two requirements (spectral overlap and distinct spectra), which decreases the maximal achievable sensitivity of FRET. This problem can be solved by using non-fluorescent proteins. Construction of EYFP mutants with Y145W and Y145W/H148V substitutions led to the REACh1 and REACh2 dark proteins. Fluorescence lifetime of these mutant proteins was significantly lower (~320 ps) as compared with EYFP (~2.9 ns). Such fast decay of fluorescence decreases the amount of acceptor bleaching during FRET [29].
Recently we reported construction of the FRET pair based on red proteins with the practically non-fluorescent chromoprotein KFP as the acceptor [33]. KFP derived from the chromoproteins asCP from the sea anemone Anemonia sulcata is characterized by unique spectral properties [30,31,32]. At low light intensities, the wild-type protein is weakly fluorescent with a very low quantum yield of φFl < 0.001, which depends on the specific arrangement of amino acid residues in the chromophore’s environment. However, high intensity irradiation with green light leads to a nonlinear dependence of the fluorescence intensity on excitation energy [30] and a drastic increase of φFl. This phenomenon, termed fluorescence ‘‘kindling’’, is reversible since upon blue light illumination or in the dark, the protein returns to its initial non-fluorescent state. The kindling properties of asCP can be optimized by the inclusion of the mutation Ala143Gly to produce the variant called KFP (kindling FP) [31]. The effect of “fluorescence kindling” is observed at high power density of exciting light source [32] which is not achieved at our device. Therefore, in these experiments KFP may be considered as non-fluorescent, or in other words, in these conditions, KFP fluorescence is not compatible with TagRFP fluorescence. Proteatic cleavage of the linker between brightly fluorescent donor TagRFP and dark acceptor KFP resulted in substantial increase of donor fluorescence intensity and lifetime [33,34]. Moreover, the use of dark acceptors opens the corresponding part of the spectrum for additional fluorescent labels, which is an additional advantage of such FRET pairs. Fuse protein TagRFP-23-KFP contains the caspase-3 recognition site DEVD which is cleaved upon caspase-3 activation. Upon such cleavage, the life-time is changed from the two exponential decay (0.93 ns and 2.35 ns) to single exponential decay 2.42 ns which is typical for free TagRFP molecule.
Here we report the use of the fuse protein TagRFP-23-KFP to register the caspase-3 activation based on average life-time measurements. A specially designed lentivector pLVT with the DNA fragment of TagRFP-23-KFP was applied for transduction of A549 cell lines. Computer simulations are carried out to estimate FRET efficiency and to analyze possible steric restrictions of the reaction between the substrate TagRFP-23-KFP and caspase-3 dimer.
MATERIALS AND METHODS
Lentiviral vectors
The pLVT-GFP transfer vector was originally derived from the pRRLsin.cPPT.PGK.GFP.Wpre vector kindly provided by Prof. D. Trono (Lausanne, Switzerland) by replacing the PGK promoter by the intron-less version of the human elongation factor 1-α (EF1-α) promoter. The DNA fragment of TagRFP from the pTagRFP-N expression vector (Evrogen, Russia) or TagRFP-23-KFP (TR23K) was inserted into pLVT-GFP vector between BamH1 и Sal1 restriction sites instead of GFP encoding fragment generating pLVT-TagRFP or pLVT-TR23K transfer vectors. The insert sequence was verified by JSC Evrogen (Moscow, Russia).
The production of lentivirus particles were performed in the HEK 293Т cell line according to the method [35] with minor modifications. The HEK 293Т cells were cultured in DMEM (Paneco, Russia), supplemented with 10% FBS (PAA, Austria) and antibiotics (50 U/ml penicillin G and 50 mg/ml streptomycin) (Paneco, Russia). 293T cells were transiently transfected with FuGene 6 transfection reagent (Roche, France) with a transfer vector construct along with the packaging construct and the VSV-G coding envelope construct. 6-8 hours post transfection the growth medium was exchanged and vector-containing supernatants were harvested 48 hs post transfection. Supernatants were clarified 1 000 rpm for 10 min, filtered through 0.45 µm filters (Corning) and concentrated on Amicon Ultracel-100K filter units (Millipore) if required. The lentivirus titers were determined on HeLa cells and adjusted toeHela 105 TU/ml.
Cell culture, in vitro transduction
The A549 lung adenocarcinoma cell line was cultured in RPMI1640 (Paneco), supplemented with 10% heat inactivated FBS (Bioclot) and antibiotics (50 U/ml penicillin G and 50 mg/ml streptomycin (Paneco). Cells were dissociated in Trypsin-EDTA (Paneco), washed with Dulbecco’s PBS (Paneco) and plated on 6-well plates in density 2*104 cells per well in RPMI1640 (Paneco), supplemented with 5% FBS (Bioclot) (hereinafter complete medium). After 24 h of cell culture growth lentiviral particles were added. For maximal transduction efficiency three-fold excess of lentiviral particles were used (300 µl). After 24 h the medium was changed. After 48 h fluorescence signal was examined by fluorescence microscopy (Nikon Eclipse TE2000-U, Japan). Transduced cells A549-TagRFP and A549-TR23K were propagated in 5-8 passage.
Detecting of caspase-3 activation
A549-TR23K were seeded on 6-well plates in density 5*105 cells per well in complete medium. Apoptosis was induced in A549-TR23K monolayer by adding of 0.5 ng/ml of staurosporine in complete media. After 2 h of incubation cells were imaged by fluorescence microscopy.
After 3 h of incubation the medium from every well was collected carefully. Cells on the plate were dissociated in Trypsin-EDTA (Paneco), combined with recollected medium, washed with Dulbecco’s PBS (Paneco) by centrifugation. Every 5*105 of cells were tested in parallel for viability and activation of caspase-3 by fluorescence plate reader Labsystems Fluoroscan II. Cells viability was detected with fluorescein diacetate test [36].
Caspase activity was analyzed with DEVD-FITC Caspase-3 Detection Kit (Calbiochem) according to protocol and by measuring change in intensity of TagRFP’s fluorescence.
FLIM
A549-TR23K and A549- TagRFP were seeded on square glasses of 20 mm x 20 mm size in density 5*105 cells per well of 6-well plates in complete medium. After 48 h of cells growth apoptosis was induced by adding of 0,8mM H2O2 in complete medium. Detection of caspase-3 activation was performed 2, 6, 24 h post-induction.
Fluorescence lifetime measurements were performed using the time-resolved fluorescence confocal microscope MicroTime 200 (PicoQuant GmbH, Berlin), with excitation by 532 nm pulsed laser. Emission was detected using a narrow 580/14-25 nm filter (Semrock).
Computational Protocol
The full-atom 3D structures of TagRFP-23-KFP tetramer were modeled by using ZDOCK program package [37] (http://zdock.bu.edu/). The tetramer of KFP obtained from the crystal structure (PDB ID: 1XQM) [38] was used as a receptor in the docking procedure and the monomer of TagRFP (PDB ID: 3M22) [39] as a ligand. Four best candidates obtained in molecular docking were used to construct the entire system consisting of four monomers of TagRFP and four monomers of KFP. Linkers were manually added to this structure to construct the TagRFP-23-KFP tetramer. The system obtained was then refined in molecular dynamics (MD) simulations. The protein was solvated in a rectangular box of TIP3P water molecules of size 177 × 131 × 116 Å3, and the charge was neutralized by adding 24 sodium ions. Calculations of MD trajectories were performed using the NAMD 2.6 software suite [40] freely available at http://www.ks.uiuc.edu/Research/namd/. The CHARMM force field parameters [41] (http://mackerell.umaryland.edu/CHARMM_ff_params.html) for the protein atoms, chromophores and Na+, and the TIP3P model parameters for all water molecules were employed. The 2300 ps MD simulation was carried out with a 1 fs integration step following initial 20000 step energy minimization. To analyze the equilibrium geometry parameters, the system was gradually heated during 300 ps to 300K, executed for 500 ps at 300K and cooled down to 0 K during 1500 ps with the subsequent 5000 step minimization. No restrictions were imposed on coordinates of all atoms in trajectory or geometry optimization calculations. The VMD program [42] was used for visualization (http://www.ks.uiuc.edu/Research/vmd/). The structure corresponding to the enzyme substrate complex (caspase-3 and TagRFP-23-KFP) was obtained by manual alignment of the DEVD motif of the TagRFP-23-KFP linker with the inhibitor carbodezoxy-Asp-Glu-Val-Asp-chloromethylketone from the crystal structure of the caspase-3 dimer (PDB ID: 2DKO) [43].
Results and Discussion
Calculated FRET efficiency and steric restrictions
According to dynamic light scattering data the fuse protein TagRFP-23-KFP is best characterized as a tetramer [33]. Figure 1 shows the model system mimicking tetramer of TagRFP-23-KFP.
TagRFP-23-KFP tetramer. The monomers are shown in red, orange, green and violet. The inset shows the distances (in angstroms) between bridge carbon atoms of the chromophore groups of TagRFP (shown in sticks) and KFP (shown in balls and sticks). Here, carbon, oxygen, nitrogen, hydrogen and sulfur atoms are shown in green, red, blue, white and yellow respectively.
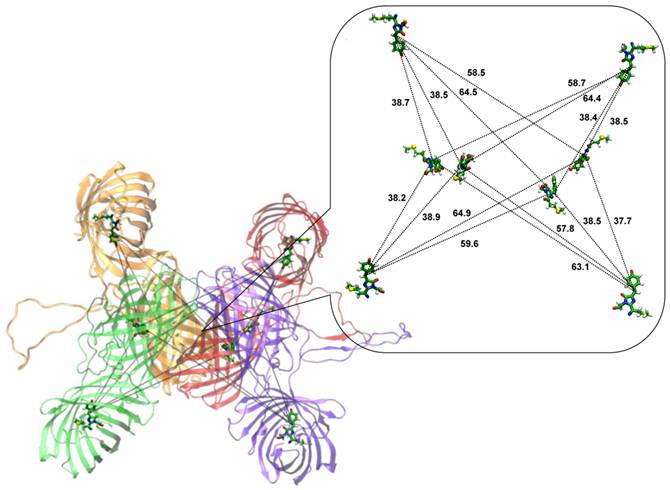
It comprises tetramer of KFP as the core of the structure and four barrels of TagRFP at the periphery. Each monomer of TagRFP-23-KFP has a linker which is supposed to be in the solvent-exposed conformation. One of the reasons of such assumption is that the linker does not contain vast amount of hydrophobic residues and therefore may be exposed to the solution. Another reason comes from the application of this FRET-sensor measuring caspase-3 activity [33]. Since caspase-3 can hydrolyze specific DEVD motif of the TagRFP-23-KFP linker, it means that the linker is available for the intermolecular interactions. The inset of Figure 1 shows the distances between bridge carbon atoms of chromophore groups of TagRFP and KFP. Distances between donors and acceptors can be clustered into three groups:
- The closest neighboring donors and acceptors with the distances around 38 Å;
- Medium neighbors with the distances around 58 Å;
- The well separated groups with the distances between donors and acceptors about 64 Å.
This distance distribution shows a high degree of symmetry of the TagRFP-23-KFP tetramer.
It is known that the efficiency of Förster resonance energy transfer depends on several factors: spectral overlap between emission band of the donor and absorption band of the acceptor, quantum yield of donor, relative orientation of transition dipole moments and distances between donor and acceptor [44]. First two factors depend on the donor and acceptor types, in our system; those are TagRFP as a donor and KFP as an acceptor. Third and fourth factors depend on the relative orientation of donor and acceptor. Correspondingly, FRET efficiency can be determined as
where const incorporates first two factors, namely, spectral overlap between emission band of the donor and absorption band of the acceptor and quantum yield of donor. The value of const (1.6∙1010 Å6 ) can be estimated from the experimental results presented in Ref. [33]. The distance r between donor and acceptor molecules can be determined from the model system refined in MD simulation. Additional calculations are needed to evaluate the value of the orientation factor κ2. Herein we use κ2=2/3 which is appropriate for dynamic random averaging of the donor and acceptor orientations. We also assume that the resonance energy transfer can occur with the same probability between any donor and acceptor pair; therefore, we can use an average distance r=49.9 Å by analyzing data shown in the inset of Fig. 1. The value of the FRET efficiency at this level is 46.9 % that is comparable with the experimentally observed value of 51.1 %. Calculated value of the Förster radius is 49.6 Å that is close to the value of 47 Å reported in Ref. [33]. Encouraged by a favorable consistency of the experimental and theoretical data (Table 1) we conclude that this model tetramer structure can be used to analyze the enzyme substrate complex between caspase-3 and TagRFP-23-KFP.
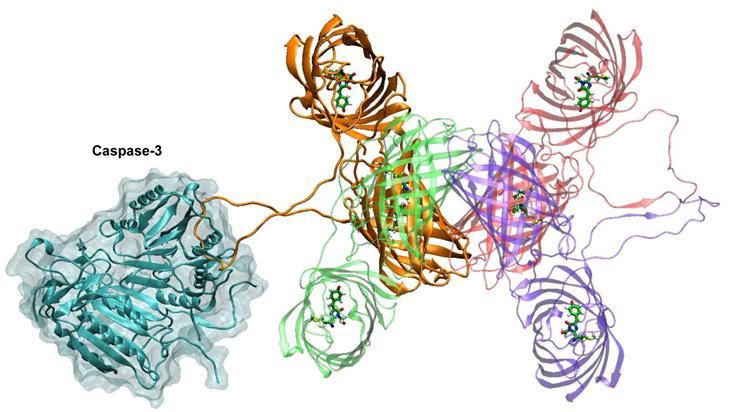
Figure 2 shows the complex of caspase-3 dimer with the tetramer of TagRFP-23-KFP. This complex is constructed by alignment of DEVD motif of the TagRFP-23-KFP linker with DEV motif of the inhibitor presented in the crystal structure. One can find that caspase-3 does not have any steric difficulties when interacting with the loop as this linker is exposed to the solution and is long enough to keep DEVD motif apart from the barrels of TagRFP and KFP. In case of citoplasmic localization of substrate its tetramerization is not essential for determination of enzymatic activity. It is important that the tetramer does not create steric hindrance for interactions with the caspase-3 dimer. Tetramerization of KFP, which is an acceptor, leads to substantial efficiency of energy transfer up to 51% (if the simplest approximation is used) due to substantial increase of extinction coefficient of the acceptor.
Comparison of FRET-biosensor parameters obtained in Ref. [33] for the value of orientation factor κ2 = 2/3 and in model system presented in this work.
| Experimental values | Theoretical results | |
|---|---|---|
| FRET efficiency (%) | 51.1 | 46.9 |
| Distance between donor and acceptor (Å) | 45 | 49.9 |
| Förster radius (Å) | 47 | 49.6 |
Complex of caspase-3 dimer (shown in cyan) and TagRFP-23-KFP (colors are the same with those from the figure 1). Monomer of TagRFP-23-KFP that forms the complex with caspase-3 is shown in orange.
Lentiviral transduction
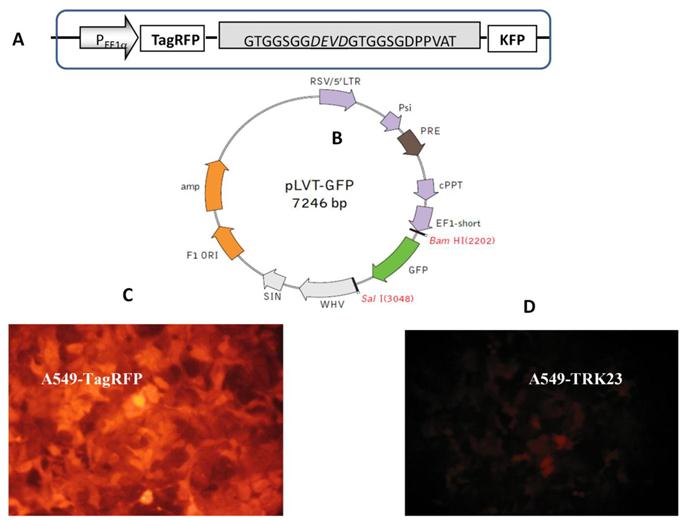
Lentiviral transduction allows us to obtain a large amount of gene copies. Lentiviruses, such as the human immunodeficiency virus, constitute a part of the retrovirus family. Unlike retroviruses, lentiviruses have special machinery for nuclear targeting, which allows the lentivirus to infect both the dividing and the non-dividing cells [45]. These properties of lentiviral vectors make them ideal tools for developing of fluorescent cell lines. For our purpose the important feature is the high yield of transductants. It allows one to avoid cloning procedure (cf lipofection) which might change cell morphology. By using such methodology highly fluorescent cells A549-TagRFP and A549-TR23K were obtained. A549-TR23K emits weak fluorescence signal due to the quenching of Tag RFP emission by the FRET mechanism (Fig. 3).
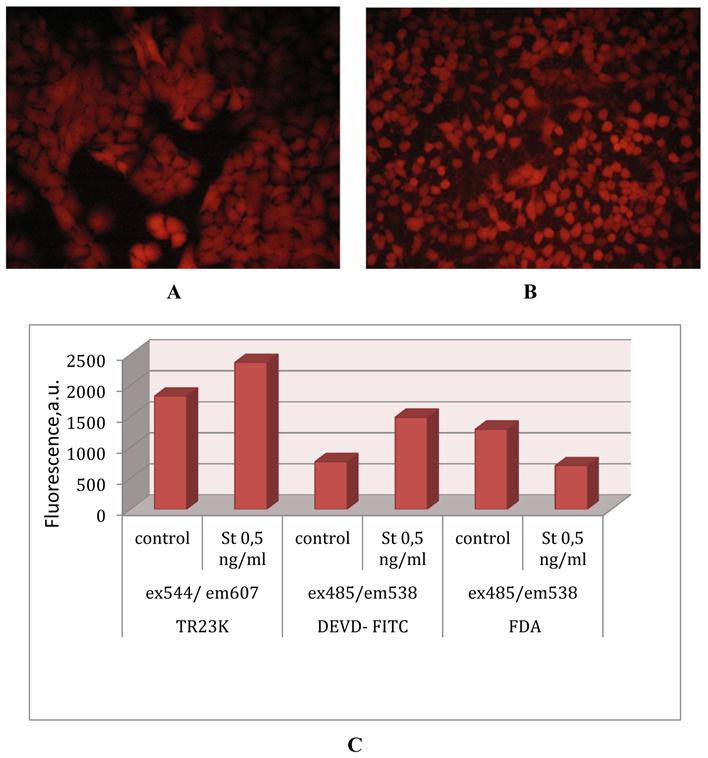
Upon A549-TR23K cultivation the fluorescent signal is continuously growing (Fig. 4А) what is explained by high level of fuse protein expression under the EF1alpha promoter. Induction of apoptosis by staurosporine leads to morphological changes of cells (Fig. 4B) and to increase in intensity of fluorescence by 20-25% from the initial intensity level (Fig. 4C). Activation of caspase-3 is confirmed in independent experiments with the DEVD-FITC test (Fig. 4C). Vitality test with fluorescein diacetate shows that no more than 50% of cells survive (Fig. 4C).
FLIM FRET Imaging of caspase-3 activity
This particular FRET pair is being developed for specific detection of caspase-3 activity under the life time mode of measurements in cancer cells which are characterized by increased red fluorescence because of fairly high concentration of porphyrins. The life-time of porphyrins (greater than 10 ns) differs considerably from that of TagRFP; therefore, unlike stationary state measurements of fluorescence shown in Fig.4, measurements of mean life-time are characterized by very high contrast which is illustrated in Figs. 5 and 6.
For average life-time measurements the apoptosis of A549 lung adenocarcinoma cells expressed TagRFP-23-KFP was induced by H2O2.
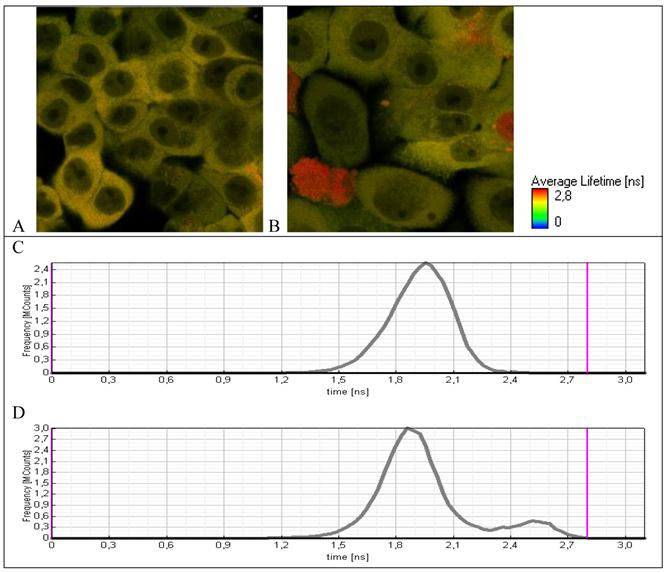
Initially, cell line А549–TR23K is characterized by a narrow life-time distribution in the range of 1.8-2.1 ns (Fig. 5A). Incubation of the cells with hydrogen peroxide with the concentration 800 μM during 24 hours leads to the morphological changes of some cells (Fig. 5B), as well as to the increase in the life-time. Life-time distribution became bimodal and in addition to narrow population with life-time 1.8-2.1 ns a new small fraction with life-time in the range of 2.4-2.6 ns appeared that is typical for free TagRFP. These data provide a direct evidence of caspase-3 activation and cleavage of fuse protein TagRFP-23-KFP to two separate proteins TagRFP and KFP.
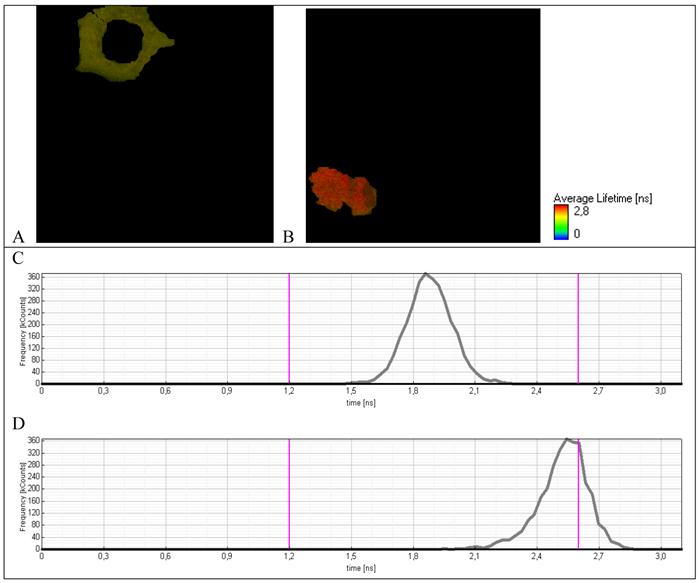
To verify the origin of fluorescence with the long life-time, an average life-time was measured for separate cells treated by hydrogen peroxide. For cells with normal morphology (Fig. 6A) an average life-time (Fig. 6C) is practically the same as for initial cells not treated by hydrogen peroxide (Fig. 5C). For cells with the modified morphology that is typical for apoptosis (Fig. 6B), an average life-time distribution is dramatically changed. Namely, the short-lived component 1.8-2.1 ns completely disappeared and the long-lived component 2.4-2.6 ns that is typical for separate molecule of TagRFP due to cleavage of TagRFP-23-KFP by caspase-3 appeared.
Lentiviral transduction of lung adenocarcinoma A549. (A) Genetically encoded caspase-3 sensor TagRFP-23aa-KFP (TR23K) based on red fluorescent proteins TagRFP and KFP linked by 23 a.a. with DEVD, site specific for cleavage by caspase-3. (B) Lentivector pLVT-GFP (www.evrogen.ru). The DNA fragment of TagRFP or TagRFP-23aa-KFP (TR23K) was inserted into pLVT-GFP between BamH1 и Sal1 restriction sites after GFP encoding fragment deleting. (C) Lung adenocarcinoma А549, transduced with lentivector pLVT–TagRFP, 7 passage. Nikon Eclipse TE2000-U, 20х. (D) Lung adenocarcinoma А549, transduced with lentivector pLVT –TR23K, 7 passage. Nikon Eclipse TE2000-U, 20х.
Detecting of caspase-3 activation. (A)Lung adenocarcinoma А549–TR23K, 14 passage. Nikon Eclipse TE2000-U, 20х. (B) Lung adenocarcinoma А549–TR23K, 14 passage, after induction of apoptosis with staurosporine 0,5 ng/ml for 2 h. Nikon Eclipse TE2000-U, 20х. (C) Every 5x10⁵ of cells were tested in parallel for viability and activation of caspase-3 by fluorescence plate reader Labsystems Fluoroscan II. Caspase activity was analyzed by measuring change in intensity of TagRFP’s fluorescence with excitation filter 544 nm and emission filter 607nm. Caspase activity was analyzed with Caspase -3 Detection Kit (Calbiochem) by measuring FITС (fluorescein isothiocyanate) with excitation filter 485 nm and emission filter 538 nm. Cells viability was detected by FDA (fluorescein diacetate) test with excitation filter 485 nm and emission filter 538 nm.
Fluorescence lifetime images of A549 cells expressing TagRFP-23-KFP (A) before and (B) after incubation with H2O2. Lifetime distribution over the whole detecting area (C) before and (D) after incubation with H2O2.
Fluorescence lifetime images of A549 cells expressing TagRFP-23-KFP (A) nonapoptotic and (B) apoptotic cell. Lifetime distribution of (C) nonapoptotic and (D) apoptotic cell.
Conclusions
Computer simulations of the 3D structure of the TagRFP-23-KFP complex clearly show that it is suitable for efficient energy transfer. Conformation of TagRFP-23-KFP has no steric restrictions for interaction with the dimer of caspase-3. FRET efficiency for TagRFP-23-KFP determined from the model system refined in MD simulations correlates well with the experimental data published in Ref. [33].
Lentiviral transduction relies on active transport of the pre-integration complex and allows nuclear targeting both the dividing and the non-dividing cells that makes this method the ideal tool for fast developing of fluorescent cell lines.
Analysis of an average life-time distribution for population of cells allows us to discriminate apoptotic and surviving cells within single frame and to make a statistical analysis of drug efficiency. We ascribe the main advantages of life –time mode of FRET efficiency measurement to such features as independence on fluorophore concentration, excitation wavelength, exposure time and power of light illumination. All these features allow one to exclude calibration procedure from the protocol of FRET efficiency measurements. This system can be adjusted for high-throughput screening (HTS) using special readers oriented on measurements of fluorescence life-time as described in [46] and can be translated on small laboratory animals as shown in [33].
Acknowledgements
This study was supported by RAS Presidium program on Molecular and Cell Biology, State contract 16.512.11.2137, and partly by the grants from Russian Foundation for Basic Research (10-03-00085, 11-03-01214). We acknowledge using supercomputer resources of the M.V. Lomonosov Moscow State University.
Conflict of Interest
The authors have declared that no conflict of interest exists.
References
1. Giepmans BN, Adams SR, Ellisman MH, Tsien RY. The fluorescent toolbox for assessing protein location and function. Science. 2006;312:217-24
2. Tsien RY. The green fluorescent protein. Annu Rev Biochem. 1998;67:509-44
3. Remington SJ. Structural basis for understanding spectral variations in green fluorescent protein. Biolumin Chemilumin C. 2000;305:196-211
4. Zimmer M. Green fluorescent protein (GFP): applications, structure, and related photophysical behavior. Chem Rev. 2002;102:759-81
5. Du W, Wang Y, Luo Q, Liu BF. Optical molecular imaging for systems biology: from molecule to organism. Anal Bioanal Chem. 2006;386:444-57
6. Li IT, Pham E, Truong K. Protein biosensors based on the principle of fluorescence resonance energy transfer for monitoring cellular dynamics. Biotechnol Lett. 2006;28:1971-82
7. Zubova N.N., Savitsky A.P. Molecular cellular sensors, based on fluorescent proteins. I. pH, Cl-, Са2+, Zn2+, Cu2+ sensors. Usp Biol Khim. 2005;45:391-454
8. Rusanov AL, Savitsky AP. Fluorescence resonance energy transfer between fluorescent proteins as powerful toolkits for in vivo studies. Las Phys Lett. 2011;8:91-102
9. Yang M, Baranov E, Jiang P, Sun FX, Li XM, Li L, Hasegawa S, Bouvet M, Al-Tuwaijri M, Chishima T, Shimada H, Moossa AR, Penman S, Hoffman RM. Whole-body optical imaging of green fluorescent protein-expressing tumors and metastases. Proc Natl Acad Sci U S A. 2000;97:1206-11
10. Truong K, Ikura M. The use of FRET imaging microscopy to detect protein-protein interactions and protein conformational changes in vivo. Curr Opin Struct Biol. 2001;11:573-8
11. Hoffman RM. The multiple uses of fluorescent proteins to visualize cancer in vivo. Nat Rev Cancer. 2005;5:796-806
12. Yang M, Jiang P, Hoffman RM. Whole-body subcellular multicolor imaging of tumor-host interaction and drug response in real time. Cancer Res. 2007;67:5195-200
13. Chen Y, Periasamy A. Characterization of two-photon excitation fluorescence lifetime imaging microscopy for protein localization. Microsc Res Tech. 2004;63:72-80
14. Weissleder R, Ntziachristos V. Shedding light onto live molecular targets. Nat Med. 2003;9:123-8
15. Ntziachristos V, Schellenberger EA, Ripoll J, Yessayan D, Graves E, Bogdanov A Jr, Josephson L, Weissleder R. Visualization of antitumor treatment by means of fluorescence molecular tomography with an annexin V-Cy5.5 conjugate. Proc Natl Acad Sci U S A. 2004;101:12294-9
16. Tsien RY. Imagining imaging's future. Nat Rev Mol Cell Biol. 2003(Suppl):SS16-21
17. Pletnev S, Shcherbo D, Chudakov DM, Pletneva N, Merzlyak EM, Wlodawer A, Dauter Z, Pletnev V. A crystallographic study of bright far-red fluorescent protein mKate reveals pH-induced cis-trans isomerization of the chromophore. J Biol Chem. 2008;283:28980-7
18. Neefjes J, Dantuma N P. Fluorescent probes for proteolysis: tools for drug discovery. Nature Revs. Drug Discovery. 2004;3:58-69
19. Kennedy GT, Manning HB, Elson DS, Neil MA, Stamp GW, Viellerobe B, Lacombe F, Dunsby C, French PM. A fluorescence lifetime imaging scanning confocal endomicroscope. J Biophotonics. 2010;3:103-7
20. McGinty J, Stuckey DW, Soloviev VY, Laine R, Wylezinska-Arridge M, Wells DJ, Arridge SR, French PM, Hajnal JV, Sardini A. In vivo fluorescence lifetime tomography of a FRET probe expressed in mouse. Biomed Opt Express. 2011;2:1907-17
21. Harpur AG, Wouters FS, Bastiaens PI. Imaging. FRET between spectrally similar GFP molecules in single cells. Nature Biotechnol. 2001;19:167-169
22. Shcherbo D, Souslova E.A, Goedhart J, Chepurnykh T.V, Gaintzeva A, Shemiakina Ir.I, Gadella T.WJ, Lukyanov S.and Chudakov D.M. Practical and reliable FRET/FLIM pair of fluorescent proteins. BMC Biotechnology. 2009;9:24
23. Campbell RE, Tour O, Palmer AE, Steinbach PA, Baird GS, Zacharias DA, Tsien RY. A monomeric red fluorescent protein. Proc Natl Acad Sci U S A. 2002;99:7877-82
24. Müller-Taubenberger A, Anderson KI. Recent advances using green and red fluorescent protein variants. Appl Microbiol Biotechnol. 2007;77:1-12
25. Mizuno H, Sawano A, Eli P, Hama H, Miyawaki A. Red fluorescent protein from Discosoma as a fusion tag and a partner for fluorescence resonance energy transfer. Biochemistry. 2001;40:2502-23
26. Gurskaya NG, Fradkov AF, Terskikh A, Matz MV, Labas YA, Martynov VI, Yanushevich YG, Lukyanov KA, Lukyanov SA. GFP-like chromoproteins as a source of far-red fluorescent proteins. FEBS Lett. 2001;507:16-20
27. Steinmeyer R, Noskov A, Krasel C, Weber I, Dees C, Harms GS. Improved fluorescent proteins for single-molecule research in molecular tracking and co-localization. J Fluoresc. 2005;15:707-21
28. Strack RL, Hein B, Bhattacharyya D, Hell SW, Keenan RJ, Glick BS. A rapidly maturing far-red derivative of DsRed-Express2 for whole-cell labeling. Biochemistry. 2009;48:8279-81
29. Ganesan S, Ameer-Beg SM, Ng TT, Vojnovic B, Wouters FS. A dark yellow fluorescent protein (YFP)-based Resonance Energy-Accepting Chromoprotein (REACh) for Förster resonance energy transfer with GFP. Proc Natl Acad Sci U S A. 2006;103:4089-94
30. Lukyanov KA, Fradkov AF, Gurskaya NG, Matz MV, Labas YA, Savitsky AP, Markelov ML, Zaraisky AG, Zhao X, Fang Y, Tan W, Lukyanov SA. Natural animal coloration can Be determined by a nonfluorescent green fluorescent protein homolog. J Biol Chem. 2000;275:25879-82
31. Chudakov DM, Feofanov AV, Mudrik NN, Lukyanov S, Lukyanov KA. Chromophore environment provides clue to "kindling fluorescent protein" riddle. J Biol Chem. 2003;278:7215-9
32. Schüttrigkeit TA, von Feilitzsch T, Kompa C, Lukyanov KA, Savitsky AP, Voityuk AA, Michel-Beyerle ME. Femtosecond study of light-induced fluorescence increase of the dark chromoprotein asFP595. Chem Phys. 2006;323:149-60
33. Rusanov AL, Ivashina TV, Vinokurov LM, Fiks II, Orlova AG, Turchin IV, Meerovich IG, Zherdeva VV, Savitsky AP. Lifetime imaging of FRET between red fluorescent proteins. J Biophotonics. 2010;3:774-83
34. Rusanov AL, Ivashina TV, Vinokurov LM, Goryashenko AS, Zherdeva VV, Savitsky AP. FRET-sensor for imaging with lifetime resolution. Proc SPIE. 2010;7376:737611.1.6
35. Bovia F, Salmon P, Matthes T, Kvell K, Nguyen TH, Werner-Favre C, Barnet M, Nagy M, Leuba F, Arrighi JF, Piguet V, Trono D, Zubler RH. Efficient transduction of primary human B lymphocytes and nondividing myeloma B cells with HIV-1-derived lentiviral vectors. Blood. 2003;101:1727-33
36. Riordan HD, Riordan NH, Meng X, Zhong J, Jackson JA. Improved microplate fluorometer counting of viable tumor and normal cells. Anticancer Res. 1994;14:927-31
37. Mintseris J, Pierce B, Wiehe K, Anderson R, Chen R, Weng Z. Integrating statistical pair potentials into protein complex prediction. Proteins. 2007;69:511-20
38. Wilmann PG, Petersen J, Devenish RJ, Prescott M, Rossjohn J. Variations on the GFP chromophore: A polypeptide fragmentation within the chromophore revealed in the 2.1-A crystal structure of a nonfluorescent chromoprotein from Anemonia sulcata. J Biol Chem. 2005;280:2401-4
39. Malashkevich VN, Subach OM, Almo SC, Verkhusha VV. Crystal structure of TagRFP fluorescent protein. 2012; DOI:10.2210/pdb3m22/pdb.
40. Phillips JC, Braun R, Wei Wang, James Gumbart, Emad Tajkhorshid, Elizabeth Villa, Christophe Chipot, Robert D. Skeel, Laxmikant Kale, and Klaus Schulten. Scalable molecular dynamics with NAMD. J Comp Chem. 2005;26:1781-1802
41. MacKerell Jr AD, Bashford D, Bellott M, Dunbrack Jr RL, Evanseck JD, Field MJ, Fischer S, Gao J, Guo H, Ha S, Joseph-McCarthy D, Kuchnir L, Kuczera K, Lau FTK, Mattos C, Michnick S, Ngo T, Nguyen DT, Prodhom B, Reiher III WE, Roux B, Schlenkrich M, Smith JC, Stote R, Straub J, Watanabe M, Wiorkiewicz-Kuczera J, Yin D, Karplus M. All-atom empirical potential for molecular modeling and dynamics Studies of proteins. J Phys Chem B. 1998;102:3586-3616
42. Humphrey W, Dalke A, Schulten K. VMD: visual molecular dynamics. J Mol Graph. 1996;14:33-8
43. Ganesan R, Mittl P.R.E, Jelakovic S, Grutter M.G. Extended substrate recognition in caspase-3 revealed by high resolution X-ray structure analysis. J Mol Biol. 2006;359:1378-88
44. Lakowicz JR. Principles of fluorescence spectroscopy. New York, USA: Springer Science+Business Media. 2006
45. Yamashita M, Emerman M. Retroviral infection of non-dividing cells: Old and new perspectives. Virology. 2005;344:88-93
46. Talbot C.B, McGinty J, Grant D.M. et al. High speed unsupervised fluorescence lifetime imaging confocal multiwell plate reader for high content analysis. J. Biophoton. 2008;1:514-521
Author contact
![]() Corresponding author: Tel: +7(495)9546512; Fax: +7(495)9548725; E-mail: apsavitskyras.ru.
Corresponding author: Tel: +7(495)9546512; Fax: +7(495)9548725; E-mail: apsavitskyras.ru.
 Global reach, higher impact
