Theranostics
13.3
Impact Factor
- Current Issue
- Advance Articles
- Volume 16; 2026
- Volume 15; 2025
- Volume 14; 2024
- Volume 13; 2023
- Volume 12; 2022
- Archive
- Cover Images
- Cover Suggestion
- Special Issues
Top
INTRODUCTION
MATERIALS AND METHODS
RESULTS AND DISCUSSION
CONCLUSION
Supplementary Material
Acknowledgements
References
INTRODUCTION
MATERIALS AND METHODS
RESULTS AND DISCUSSION
CONCLUSION
Supplementary Material
Acknowledgements
References
International Journal of Biological Sciences
International Journal of Medical Sciences
 Global reach, higher impact

Theranostics 2011; 1:310-321. doi:10.7150/thno/v01p0310 This volume Cite
Research Paper
Combining Portable Raman Probes with Nanotubes for Theranostic Applications
Ashwinkumar A. Bhirde1, Gang Liu1, Albert Jin2, Ramiro Iglesias-Bartolome3, Alioscka A. Sousa2, Richard D. Leapman2, J. Silvio Gutkind3, Seulki Lee1, Xiaoyuan Chen1, ![]()
1. Laboratory of Molecular Imaging and Nanomedicine, National Institute of Biomedical Imaging and Bioengineering (NIBIB), National Institutes of Health (NIH), Bethesda, Maryland 20892, USA
2. Laboratory of Cellular Imaging and Macromolecular Biophysics, NIBIB, NIH, Bethesda, Maryland 20982, USA
3. Oral and Pharyngeal Cancer Branch, National Institute of Dental and Craniofacial Research (NIDCR), NIH, Bethesda, Maryland 20892, USA
Received 2011-6-13; Accepted 2011-7-4; Published 2011-7-4
Citation:
Bhirde AA, Liu G, Jin A, Iglesias-Bartolome R, Sousa AA, Leapman RD, Gutkind JS, Lee S, Chen X. Combining Portable Raman Probes with Nanotubes for Theranostic Applications. Theranostics 2011; 1:310-321. doi:10.7150/thno/v01p0310. https://www.thno.org/v01p0310.htm
Other stylesAbstract

Recently portable Raman probes have emerged along with a variety of applications, including carbon nanotube (CNT) characterization. Aqueous dispersed CNTs have shown promise for biomedical applications such as drug/gene delivery vectors, photo-thermal therapy, and photoacoustic imaging. In this study we report the simultaneous detection and irradiation of carbon nanotubes in 2D monolayers of cancer cells and in 3D spheroids using a portable Raman probe. A portable handheld Raman instrument was utilized for dual purposes: as a CNT detector and as an irradiating laser source. Single-walled carbon nanotubes (SWCNTs) and multi-walled carbon nanotubes (MWCNTs) were dispersed aqueously using a lipid-polymer (LP) coating, which formed highly stable dispersions both in buffer and cell media. The LP coated SWCNT and MWCNT aqueous dispersions were characterized by atomic force microscopy, transmission electron microscopy, dynamic light scattering, Fourier transform infrared spectroscopy and Raman spectroscopy. The cellular uptake of the LP-dispersed SWCNTs and MWCNTs was observed using confocal microscopy, and fluorescein isothiocyanate (FITC)-nanotube conjugates were found to be internalized by ovarian cancer cells by using Z-stack fluorescence confocal imaging. Biocompatibility of SWCNTs and MWCNTs was assessed using a cell viability MTT assay, which showed that the nanotube dispersions did not hinder the proliferation of ovarian cancer cells at the dosage tested. Ovarian cancer cells treated with SWCNTs and MWCNTs were simultaneously detected and irradiated live in 2D layers of cancer cells and in 3D environments using the portable Raman probe. An apoptotic terminal deoxynucleotidyl transferase dUTP nick end labeling (TUNEL) assay carried out after laser irradiation confirmed that cell death occurred only in the presence of nanotube dispersions. We show for the first time that both SWCNTs and MWCNTs can be selectively irradiated and detected in cancer cells using a simple handheld Raman instrument. This approach could potentially be used to treat various diseases, including cancer.
Keywords: Irradiation, Raman, photothermal, multi-walled carbon nanotube (MWCNT), single-walled carbon nanotube (SWCNT), 3D cell culture.
INTRODUCTION
Portable Raman probes have made their way into the basic science laboratory through their use to detect and identify specific biological markers and organic molecules [1-2], but so far their usefulness has not been tested for pre-clinical theranostic applications. Herein we have studied the applicability of portable Raman probes in combination with nanomaterials for theranostics platforms. With the advent of nanotechnology, nanomaterials have provided a variety of options for biomedical applications [3-5]. Carbon based nanomaterials, in particular, are of great interest internationally, because of their applicability to biomedicine [6]. Among the carbon based nanomaterials, carbon nanotubes (CNTs) have excellent electro-optical properties, high tensile strength, and a high surface area-to volume ratio that facilitates surface functionalization [7]. CNTs comprise single-walled carbon nanotubes (SWCNTs), double-walled carbon nanotubes, and multi-walled carbon nanotubes (MWCNTs) [8-10]. The above mentioned physical properties have enabled tailor-made CNT conjugates, such as drug delivery vehicles [11] suitable for loading of various chemotherapeutic drugs (e.g. cisplatin [12], doxorubicin [13], paclitaxel [14]), and gene delivery vectors [15-16] (such as siRNA) for gene therapy. The toxicity of pristine CNT aggregates can be ameliorated by adding a designer coat of biocompatible material to make the nanotubes highly dispersible in aqueous solution [17-18]. Various oligonucleotide sequences, surfactants and polymers can be employed to render CNTs dispersible [19-21]. The most common of these dispersants is polyethylene glycol (PEG), an FDA approved polymer used in the pharmaceutical industry [22-23]. Several recent publications [24-26] have found PEGylated CNTs to be non-cytotoxic.
Raman spectroscopy, which determines the vibrational, rotational, and other lower frequency modes of a nanosystem, has been one of the key tools for characterizing CNTs [27-28]. Raman spectra give unique signature peaks that can identify the CNTs, such as the radial breathing mode (RBM) in which all the carbon atoms are moving in-phase in the radial direction. Depending on the CNT diameter, the intensity could be strong or weak [29]. The RBM band is detected at wave numbers of around 200 - 330 cm-1, and the Raman signal strength depends on the CNT diameter. In graphitic material, there is another specific spectral feature, known as the graphene peak or G band, which arises from neighboring atoms moving in opposite directions along the surface of the tube, as well as a second-order related harmonic G' band [30]. The G band peak occurs around 1500 - 1600 cm-1 and the G' is visible around 2600 - 2700 cm-1. The synthesis of CNTs using metal catalysts gives rise to structural defects producing a dispersive disorder induced peak in the Raman spectrum. This defect peak or D band occurs at wave numbers around 1300 cm-1 [31]. These spectral features enable the identification of different types of CNTs. Recently Raman spectroscopy has also been used to track CNTs both in vitro and in vivo, giving rise to a new non-invasive imaging mode to track these nanomaterials [24, 32-34].
In this study we made combined use of the unique features of portable Raman probes and CNTs to create a theranostic platform for ovarian cancer [35]. Ovarian cancer has a very high mortality rate for women around the world [36]. Therapies based on CNTs have shown promising results in pre-clinical experiments by acting as vehicles to deliver drugs and genes to cancer tumor cells both in vitro and in vivo [37]. CNTs have also been used for pre-clinical photothermal therapy of breast cancer [38-41]. In this study we report a unique way of combining CNTs and portable Raman probes to effect simultaneous detection and photothermal ablation of ovarian cancer cells (Supplementary Material: Figure S1). Tissue exhibits a deep penetrability with very low absorption of near-infrared (NIR) photons in the wavelength range of 700 to 1100 nm [42-43]. In our study we utilized SWCNTs and MWCNTs to kill ovarian cancer cells in vitro by selectively detecting and irradiating the CNTs both in 2D cell culture and 3D spheroids by deploying a portable Raman detector together with a handheld Raman laser probe. This study suggests that handheld portable devices used with specially designed theranostic nanomaterials could potentially lead to low cost therapies.
MATERIALS AND METHODS
Functionalization of Carbon nanotubes. SWCNTs (Aldrich, MO) and MWCNTs (Helix, TX) were coated with phospholipid polyethylene glycol amine (LP) (1,2-distearoyl-sn-glycero-3-phosphoethanolmine-N-[amino(polyethyleneglycol)-2000] (ammonium salt) from Avanti Polar Lipids, Inc., AL) to render CNTs dispersible in aqueous medium. To accomplish this SWCNTs (1 mg) or MWCNTs (1 mg) were added to an aqueous solution of LP (1 mg ml-1) and sonication was carried out with the help of an ultra sonicator (Qsonica, CT) for 3 h. This process resulted in aqueous dispersed CNTs. To remove any uncoated SWCNTs or MWCNTs, the LP coated CNTs were centrifuged for 2 h at 10,000 rpm. After the centrifugation the bare uncoated nanotubes settled at the bottom of the vial. The supernatant was recovered, and unreacted LP was removed using a 5K MW centricon filter and stored for later use.
FTIR of Functionalized CNTs. Fourier transform infrared (FTIR) spectroscopy of LP coated SWCNT and MWCNT nanoconjugates, and of pristine SWCNT and MWCNT controls, was done using KBr pellets of each. The wave numbers of the transmittance of each sample were recorded using a Perkin-Elmer spectrum GX spectrophotometer.
Fluorescence Spectrometry. Fluorescence spectrometer was used to assess the presence of FITC on the LP coated SWCNTs or MWCNTs. For this fluorescence spectra of FITC conjugated to LP coated SWCNTs or MWCNTs (with pristine SWCNTs and MWCNTs as controls) were obtained using a Perkin-Elmer LS55 fluorescence spectrometer.
Atomic Force Microscope analysis of CNT nanoconjugates. Samples for AFM were prepared and analyzed as described with modifications [44-45]. Briefly, biological AFM imaging of the carbon nanotube samples was carried out under a range of deposition conditions in fluid, rinsed with deionized water and dried under a gentle flow of N2 or Ar gas, using a gentle tapping-mode on a PicoForce Multimode AFM (Bruker, CA) consisting of a Nanoscope® V controller, a type E scanner head, and a sharpened TESP-SS (Bruker, CA), OMCL (Bruker, CA), or similar AFM cantilever. For either SWCNT or MWCNT sample visualization, suitable surface attachment of the respective sample was achieved readily by 5 min incubation of 20 μL of the fluid suspension on freshly-peeled mica disks of 12 mm diameters. The excess fluid was blown away by an inert gas gust, or blotted with filter paper, followed by two rinses each with 30 μL of deionized water to remove salt deposits and by a complete drying of the sample surface under gentler gas flow. The sample was then sealed into the instrument compartment (dehumidified by Drierite® particles) and imaged via standard optimizations. AFM images were evaluated within the Nanoscope software (version 7.2, Bruker), and exported to Image J (version 1.4x, NIH, Bethesda, MD) for further analyses and display.
Zeta Potential. To find the surface charge of LP coated SWCNTs and MWCNTs, zeta potential analysis was carried-out using a Zetasizer Nano series (Zen3600) from Malvern with Zetasizer software 6.0 as the interface.
Raman analysis of CNT nanoconjugates. Raman characterization was used for the analysis of the functionalized LP coated SWCNT and MWCNT samples for specific signature peaks along with controls consisting of pristine SWCNTs and MWCNTs. Raman characterization of aqueous dispersed CNTs was done by using characteristic SWCNT/MWCNT Raman signature peaks (G and D bands). Raman spectra were recorded on an iRaman 785 (B&W Tek, Inc, DE) spectrometer equipped with a microscope attachment, and laser spot size was focused to 1 μm diameter (×100 objective), with a power output of 35 mW. The excitation source was an argon ion laser, 785 nm.
2D and 3D cell culture. For 2D cell culture, OVCAR8 ovarian cancer cells were cultured in RPMI (Invitrogen) supplemented with 10% fetal bovine serum (FBS) at 37°C in 95% air/5% CO2. Freshly plated cells were grown overnight, to 50-70% confluency prior to incubation for 3 hrs with 200 μL RPMI containing either LP coated SWCNTs or MWCNTs, and after 3 washes with PBS the treated cells were incubated further in fresh RPMI containing serum and carefully monitored microscopically (Axiovert 200m; Carl Zeiss). For 3D cell cultures, OVCAR8 cells were trypsinized, collected, mixed with matrigel, and plated in 8 well chambered cultured slides, which had been previously coated with a thin layer of matrigel. The matrigel mixed cells were observed for the spheroid formation.
Cell proliferation (MTT) assay. Cells were grown to 50-70% confluency overnight in 96 well plates. Next, the media was aspirated and the cells incubated with fresh media containing either LP coated SWCNTs or MWCNTs at various concentrations along with control cells for 48 h. Post treatment the cells were washed 2 times in PBS, and then incubated for an additional 24 h in fresh media. MTT was assessed using a CellTiter 96 AQ One Solution Cell Proliferation Assay kit (Promega, WI), and measured optically at 570 nm.
TUNEL assay. An APO-BrdU TUNEL (Terminal transferase dUTP nick end labeling) assay kit (Invitrogen, CA) was used to detect cells undergoing apoptosis. Briefly, cells were grown onto 8 well chambered cell culture slides until 50-70% confluent, followed by treatment with either SWCNTs or MWCNTs. Control cells were grown in the absence of CNTs. After treatment, the cells were washed in PBS (3x for 2 min each) and incubated in fresh media for 1 h. Next, cells were fixed in 3.5 % PBS-formaldehyde for 15 min at RT, rinsed in PBS (3x) and permeabilized in 0.5 % PBS-Tween 20 for 5 min at RT followed by DNA end-labeling for 1 h at 37 °C. Then, the labeled cells were washed, and incubated further with 95 μL antibody staining solution (AlexaFluor 488-conjugated anti-BrdU) for 30 min at 37 °C, followed by additional washes (3x). Fluorescence image acquisitions were performed with an Axioplan 2 (Carl Zeiss).
Confocal microscopy. OVCAR8 ovarian cancer cells were grown 50-70% confluent on 8-well chambered LabTek II coverglass, treated with either FITC or Qdot conjugated LP coated SWCNTs or MWCNTs, as described above and, incubated for 3 h. Cells were next washed with PBS (3x) and resuspended in fresh media. Live cell imaging was performed using an inverted Zeiss LSM 700 confocal microscope equipped with a CO2 module, heating unit and heating plate, using a 40x/0.75 M27 EC Plan-Neofluar objective. Imaging was carried out at 37°C in 5% CO2 with cells plated in LabTek II coverglass (Nalge Nunc International, NY). Images were acquired and processed with the Zeiss Zen 2009 image software. The fluorescence micrographs shown are representative of at least three independent experiments. Average fluorescence intensity was quantified using Zen 2009 software.
Transmission electron microscope imaging of SWCNTs/MWCNTs. A specimen of LP-coated SWCNTs or MWCNTs for TEM imaging was prepared by depositing a 3 μL droplet from the aqueous solution onto a Quantifoil grid and letting it dry in air. After adsorption for 3 min, the excess solution was blotted with filter paper, washed with a few 3-μl droplets of de-ionized water in order to remove any dirt, and left to dry. Transmission electron micrographs were recorded by means of a Tecnai TF30 TEM (FEI, Hillsboro, OR) equipped with a Gatan Ultrascan 1000 CCD camera (Gatan, Pleasaton, CA).
RESULTS AND DISCUSSION
Preparation and characterization of CNT nanoconjugates. To enable CNTs to be used for photothermal therapy it is essential to preserve their structural integrity and, thus, the spectral response of the nanomaterial. The SWCNTs and MWCNTs were dispersed in a phospholipid-polyethyelene glycol (LP) containing a terminal amine functional group. LP-coated CNTs obtained by sonication in aqueous medium were a highly water dispersible CNT suspension without any strong visual aggregation. The CNT suspension was stable for at least two weeks, which can be attributed to the strong adsorption of the lipid moieties to the surface of the CNTs. The CNT nanoconjugates were characterized by atomic force microscope (AFM, Figure 1A&B) and transmission electron microscope (TEM, Figure 1C&D) for length and diameter distribution. AFM data showed that the SWCNTs were 50 - 500 nm in length with a few over 1000 nm and 0.5 - 1.5 nm in diameter, whereas MWCNTs were somewhat shorter in the similar range of the length but about 10 - 30 nm in diameter indicating a higher degree of CNT dispersion apart from a few smaller CNT bundles. Similar data resulted from the TEM analysis with SWCNTs having diameters of 0.5 - 1.5 nm and MWCNTs having diameters of 10 - 30 nm, supporting the fact that the LP coating yielded mostly debundled individual SWCNTs and MWCNTs. To make sure that the intrinsic electronic and spectroscopic properties of SWCNTs and MWCNTs were not significantly affected by the LP coating, a Raman spectroscopic analysis was carried out (Figure 1E&F). Raman spectra of LP coated SWCNTs and MWCNTs were recorded using a handheld portable iRaman 785 (B&W Tek, Inc, DE) laser probe (Supplementary Material: Figure S2). SWCNTs showed well resolved G and G' band peaks at 1590 cm-1 and ~2600 cm-1, respectively, and an RBM band was visible at 390 cm-1 together with a D band at ~1420 cm-1. The Raman spectra clearly show that the fundamental signature peaks of SWNCTs were preserved after the coating. MWCNTs also showed a G band at ~1590 cm-1 and G' band at ~2600 cm-1, although it should be noted that the Raman intensity was weak compared to that from SWCNTs at 785-nm laser excitation, as has been reported previously [46].
To evaluate the CNT nanoconjugates further with regard to their surface charges and functional groups, zeta potential analysis and Fourier transform infrared (FTIR) spectroscopy were carried out. FTIR spectra indicated the presence of the LP coat (Figure 2A). LP coated SWCNTs and MWCNTs were further conjugated with a fluorescent dye, fluorescein isothiocyanate (FITC), and characterized by spectrofluorometry (Figure 2B). The spectrum showed a peak at 521 nm, which is the emission maximum for the unconjugated control FITC; the dye-labeled SWCNTs and MWCNTs also showed the peak at 521 nm, whereas control SWCNTs and MWCNTs lacking the dye did not show any peak in this spectral region. The data clearly showed that CNTs were labeled with FITC, which was later used to observe the cellular uptake of the CNT nanoconjuagtes. The zeta potential analysis gave us an indication of the extent of positive charge on the surface of the SWCNTs (18.5 mV) and MWCNTs (5 mV) (Figure 2C). The data also point towards a 2-fold higher coating of LP on the SWCNTs compared to that on the MWCNTs, suggesting that a higher molecular weight LP coating could yield still better CNT dispersions, especially for MWCNTs.
Cellular uptake and cell proliferation studies of LP coated SWCNTs and MWCNTs in ovarian cancer cells. Most previous studies involving CNTs as delivery vehicles have utilized targeting moieties that could help take up nanoconjugates into cells. However, in the present studies we kept the nanoformulation in its simplest form and used dispersed, LP-coated CNT nanoconjugates directly to treat the cancer cells. We first tested cellular uptake of the CNT nanoconjugates by using confocal fluorescence microscopy. OVCAR8 [47] ovarian cancer cells were first cultured in 8-well chambered culture slides, and after reaching 70% cell confluency the cells were treated with either LP-coated SWCNTs or LP-coated MWCNTs, both of which had been labeled with FITC for an hour, after which the cells were washed twice with PBS. Fresh medium was added after the washing, and confocal Z-stack imaging was performed (Figure 3A&B). The Z-stack confocal fluorescence imaging clearly showed cellular uptake of SWCNTs and MWCNTs as evidenced by the green emission from the FITC dye at a wavelength of 520 nm. This result indicated that SWCNTs and MWCNTs could diffuse through the cell membrane and that the positive charge on the CNT surface mediated their cellular uptake, as had been observed in a previous report [48].
Once the cellular uptake of LP-coated SWCNTs and MWCNTs was determined, the effect of CNT nanoconjugates on the proliferation of OVCAR8 cells was tested. Cells were cultured in 96-well plates in triplicates, and when the cells were 70% confluent, they were treated with a range of doses of LP-coated aqueous dispersed SWCNTs or MWCNTs. After 48 hrs of treatment the cells were analyzed by an MTT cell proliferation assay to compare the proliferation of the cells alone (as a control) to the proliferation of cells treated with various doses of SWCNTs and MWCNTs ranging from 2 to 100 µg/mL-1. As shown in the plot in Figure 3C, the LP-coated SWCNTs and MWCNTs did not hinder proliferation of the OVCAR8 cells at the tested dosages. Higher doses of CNTs were found to be toxic (data not shown). To investigate irradiation of the OVACAR ovarian cancer cells we employed the highest dosage of the SWCNTs and MWCNTs that did not hinder the cell proliferation.
Figure 1
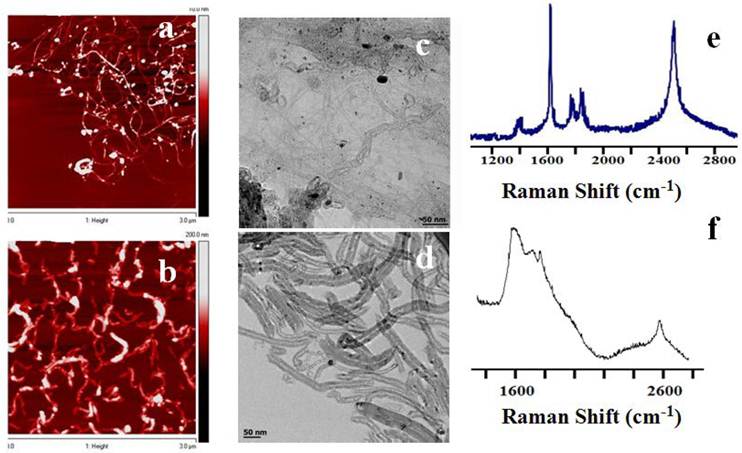
AFM, TEM and Raman analysis of SWCNTs/MWCNTs dispersed in PL-PEG-NH2. AFM imaging of SWCNT (A) and MWCNT (B) samples on freshly peeled Mica surface. The 300 nm XY scale bar applies to both A and B, and the gray scales for topological height are 0 - 7 nm for A and 0 - 100 nm for B, respectively. The tube height in the SWCNT sample ranges from 0.7 to 1.5 nm. In contrast, the cross section heights in the MWCNT sample range from 10 to 30 nm. Whereas some SWCNTs are longer than 1 μm in length, MWCNTs are somewhat shorter. (C, D) TEM images of the SWCNTs/MWCNTs show well dispersed nanotubes. (E, F) Raman spectroscopic analysis of the LP dispersed SWCNTs and MWCNTs at a laser excitation of 785 nm. Raman spectra of LP dispersed SWCNTs (left) show the signature G band at ~1590 cm-1 and G' band at ~ 2600 cm-1 which are used to detect the nanotubes in the cells. Raman spectra of LP dispersed MWCNTs also show the respective G and G' peaks (right).
Figure 2
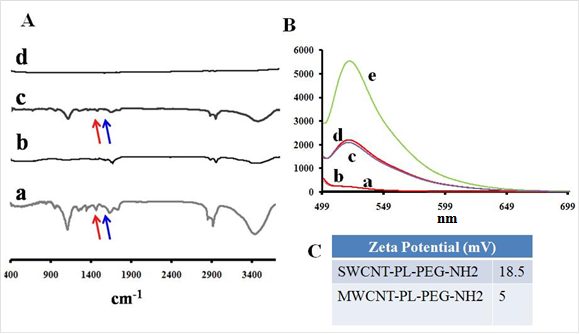
FTIR and fluorescence spectroscopic characterization and surface charge analysis of PL-PEG-NH2 dispersed SWCNTs/MWCNTs. FTIR spectra on the left show the spectral changes occurring to pristine SWCNTs (Ab) and MWCNTs (Ad) after treatment with phospholipid-PEG (LP) dispersant. SWCNTs (Aa) and MWCNTs (Ac) show the amine peaks (C=O, red and N-H, blue) at around ~1500 - 1700 cm-1. Fluorescence spectra of LP dispersed SWCNTs (Ba) and MWCNTs (Bb) do not show any fluorescence while FITC labeled SWCNTs (Bc) and MWCNTs (Bd) fluoresce at 520 nm along with control FTIC alone (Be). Zeta potential analysis shows a positive surface on LP dispersed nanotubes (C).
Figure 3
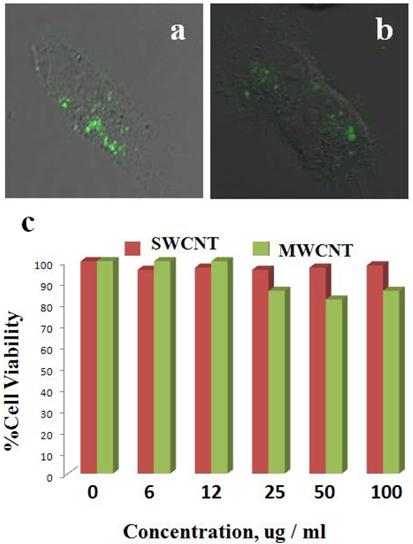
Cellular uptake and biocompatibility of SWCNTs and MWCNTs in vitro. OVCAR8 ovarian cancer cells treated with SWCNTs (A) and MWCNTs (B) dispersed in PL-PEG-NH2 and labeled with FITC were imaged using confocal fluorescence microscope. The green fluorescence clearly shows that the carbon nanotubes were taken up by the cancer cells 2 h post treatment. (C) OVCAR8 ovarian cancer cells were treated with SWCNT s/ MWCNTs dispersed in PL-PEG-NH2 to test cellular toxicity and evaluated using cell proliferation colorimetric MTT assay.
Live cellular detection of CNTs nanoconjugates using a portable Raman probe. For live cellular detection of SWCNTs and MWCNTs, a handheld portable iRaman instrument with a 785-nm laser source was utilized. Cultured OVCAR8 cells were first probed with a 785-nm laser using the iRaman laser probe, and the resulting spectrum did not show any peaks attributable to CNTs (Figure 4A). Next the OVCAR8 cells were treated with either LP-coated SWCNTs or LP-coated MWCNTs and the laser irradiation was applied to the ovarian cancer cells. Distinct carbon nanotube peaks were observed in the Raman spectra (Figure 4B&C). The CNT Raman signals tended to decrease and disappear over time at certain spots in the culture well, whereas signals were retained for longer periods of time in other regions of the culture well. Possible explanations for this behavior are that the cells might be in dynamic motion within the culture well, or that SWCNTs/MWCNTs might be internalized by the cancer cells, thus giving more continuous signals than the signals from the non-internalized nanoparticles. To confirm this behavior we washed the cells with buffer, resuspended them in media, and probed them under the 785-nm laser light to see if we could obtain any CNT Raman signal. Indeed we observed Raman signals that were of lower intensity. Raman signals were also observed in the washing solution suggesting that unbound nanotubes that did not internalize were washed away. Clear MWCNT Raman peaks were hard to detect in vitro with the 785-nm laser light, because of the very low signal intensity. The observation that Raman signals were only detected when the laser probe traversed CNTs, and never in the absence of CNTs, showed the advantage of using a portable handheld device in combination with nanomaterials.
Figure 4
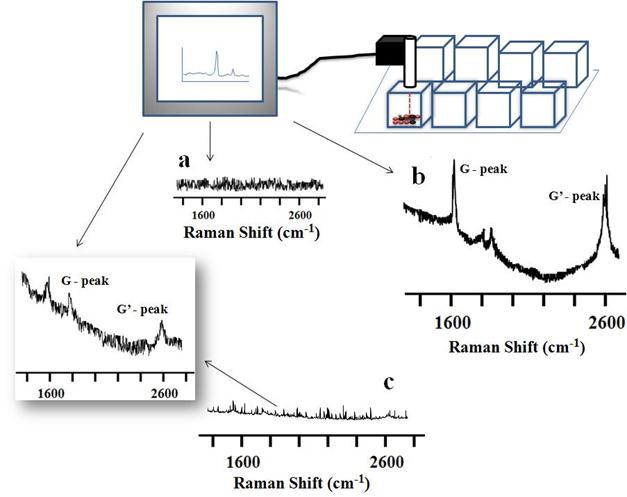
Raman spectra of SWCNT-PL-PEG-NH2 and MWCNT-PL-PEG-NH2 in 2D cell culture in vitro. OVCAR8 ovarian cancer cells treated with LP dispersed SWCNTs and MWCNTs for 3 hrs and washed were subjected to Raman analysis to detect the presence of nanotubes using a handheld portable iRaman spectrometer with a 785 nm laser source. (A) Untreated cells, serving as controls, did not show any characteristic CNT peaks. The SWCNTs (B) and MWCNTs (C) treated cells indeed showed the characteristic G peaks.
Live cellular simultaneous detection and irradiation of CNT nanoconjugates. For simultaneous detection and irradiation of the CNTs in vitro, a thermal profile of the nanotubes was first carried out (Supplementary Material: Figure S3). To achieve this, a k-type thermocouple was used to measure the temperature levels of the irradiated CNTs at different time intervals. SWCNTs/MWCNTs were introduced into the cell culture wells in the absence of cells. Raman laser light was shone onto the CNTs continuously using the 785-nm portable handheld iRaman laser probe. The temperature of the LP-coated SWCNTs/MWCNTs rose sharply to around 43 °C after 3 to 15 min, depending on the concentration of CNTs. We also found that the rise in temperature of MWCNTs was faster than that of SWCNTs. Cells treated with MWCNTs at the highest concentration that didn't show cytotoxicity in the cell viability assay reached a temperature of 32 °C after just 100 seconds of NIR irradiation. This compared to the 180 seconds that cells treated with SWCNTs took to reach the same temperature. OVCAR8 cells were treated for 3 hrs at this optimal dosage with LP-coated SWCNTs/MWCNTs and were then subjected to NIR laser irradiation in regions where the CNTs were traced with the 785-nm iRaman laser probe. Change in temperature of the cell media was recorded using the thermocouple which reached around 43 oC. After NIR laser irradiation the cells were fixed and stained for analysis using a TUNEL assay. Cells irradiated in the absence of CNTs showed neither the CNT peaks nor signs of apoptosis (Figure 5A&B), whereas LP-coated SWCNTs and MWCNTs both showed apoptosis induced by laser irradiation of the OVCAR8 ovarian cancer cells (Figure 5C-F). Interestingly, not only could we detect the CNTs in vitro, but we could also kill the cancer cells by prolonged irradiation of the SWCNTs/MWCNTs. TUNNEL staining of cells treated with CNTs in absence of laser did not show any signs of apoptosis (Supplementary Material: Figure S4). These results show promise for the use of portable handheld devices in combination with nanomaterials for detecting, thermally irradiating and killing cancer cells with minimal dosages of nanomaterials.
Figure 5
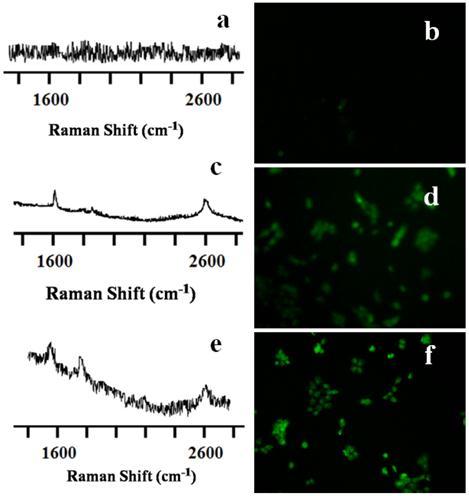
Raman spectra and TUNEL staining of SWCNT-PL-PEG-NH2 and MWCNT-PL-PEG-NH2 in 2D cell culture in vitro. OVCAR8 ovarian cancer cells treated with LP dispersed SWCNTs and MWCNTs for 3 hrs were subjected to Raman analysis to detect the presence of nanotubes using a handheld portable iRaman spectrometer with a 785 nm laser source. The untreated control well (A) did not show any nanotube peak while SWCNTs (C) and MWCNTs (E) treated cells indeed showed the characteristic G peaks. TUNEL staining was done on irradiated cells in the presence and absence of CNTs to detect apoptosis. Control cells (B) did not show any green fluorescence indicating that the irradiation did not prompt apoptosis. While cells irradiated in the presence of both SWCNT-PL-PEG-NH2 (D) and MWCNT-PL-PEG-NH2 (F) showed green fluorescence indicating the presence of apoptosis.
Simultaneous detection and irradiation of CNT nanoconjugates in a 3D environment. With the encouraging results from 2D cell cultures next we considered whether similar results could be obtained from 3D cell cultures, which would provide a more realistic model for the in vivo environment. OVCAR8 ovarian cancer cells were cultured in standard matrigel where the cancer cells grew in a three-dimensional geometry (Figure 6). 3D uptake of QSA580 (Ocean Nano Tech, LLC, AK)-labeled CNTs was assessed using Z-stack confocal imaging (Figure 6A). OVACAR8 cell spheroids were treated with LP-coated SWCNTs/MWCNTs for 3 hrs and then the spheroids were irradiated using the iRaman 785-nm laser probe. A strong SWCNT signal was detected, whereas the MWCNT signal was very weak and difficult to detect. Continuous irradiation showed a temperature rise that was detectable by a thermocouple. After irradiation cells were stained for TUNEL assay. Control spheroids that were irradiated in the absence of CNTs did not show green fluorescence. NIR laser on its own did not harm the cancer cells (Figure 7A&B). Cellular TUNEL staining indicated which cells were undergoing apoptosis (Figure 7C-F) following treatment with LP-coated SWCNT or MWCNTs and laser light. The intense signal of the SWCNTs could be due to more nanotubes being accumulated in the three-dimensional cellular structure than in the single layers of cells in the 2D culture. Although MWCNTs are also effective at killing cancer cells these nanoparticles are difficult to track with Raman probes. These results strongly suggest the advantage of using SWCNTs for simultaneous detection and killing of cancer cells using portable Raman probes. Addition of a targeting ligand onto the nanotubes would increase the target specificity.
Figure 6
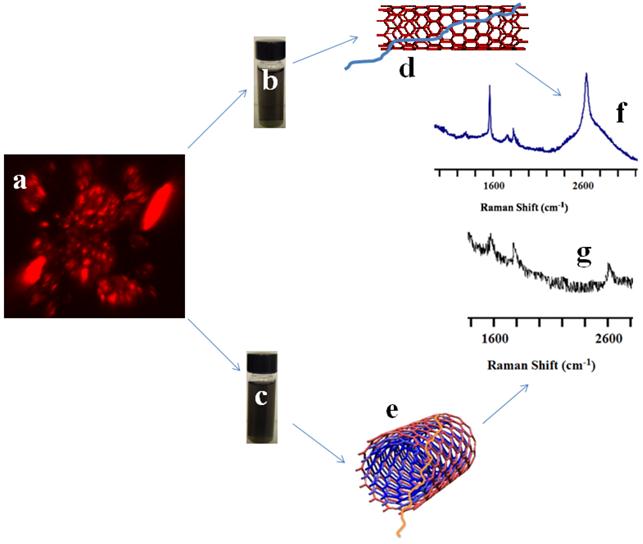
Raman probing of SWCNT-PL-PEG-NH2 and MWCNT-PL-PEG-NH2 in 3D spheroids. OVCAR8 ovarian cancer cell spheroids (A, Z-stack image) treated with LP dispersed SWCNTs (B, D) and MWCNTs (C, E) labeled with Qdots (red), for 3 h and washed were subjected to Raman analysis to detect the presence of nanotubes using a handheld portable iRaman spectrometer with a 785 nm laser source. The SWCNTs (F) and MWCNTs (G) treated cells indeed showed the characteristic G peaks.
Figure 7
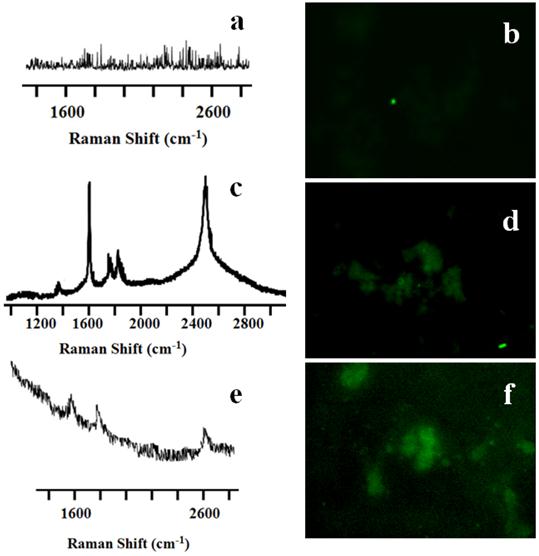
Raman spectra and TUNEL staining of SWCNT-PL-PEG-NH2 and MWCNT-PL-PEG-NH2 in 3D spheroids. The untreated control well (A) did not show any nanotube peaks, while SWCNTs (C) and MWCNTs (E) treated cells indeed showed the characteristic G peaks. TUNEL staining was done on irradiated cells in the presence and absence of CNTs to detect apoptosis. Control cells (B) did not show any green fluorescence, indicating that the irradiation did not prompt apoptosis. While cells irradiated in the presence of both SWCNT-PL-PEG-NH2 (D) and MWCNT-PL-PEG-NH2 (F) showed green fluorescence indicating apoptosis.
CONCLUSION
Carbon based nanomaterials show a strong potential for biomedical applications, and carbon nanotubes are effective as drug and gene delivery vehicles. Nanotubes themselves can be used as “heat bombs” to kill cancer cells. Here, we have shown how the unique Raman properties of SWCNTs/MWCNTs in combination with a portable handheld device can be employed to kill cancer cells simultaneously by means of thermal irradiation. SWCNTs/MWCNTs can diffuse into and be taken up by cancer cells grown in a three-dimensional environment. Our results indicate that MWCNTs have a higher thermal generation capacity but are harder to detect because of the low Raman signal intensity at a wavelength of 785 nm. We have found that the SWCNTs provide a more suitable platform, because —in addition to being able to raise cellular temperatures—they can be detected easily.
Supplementary Material
Figure S1-S4.
Acknowledgements
This research was supported by the Intramural Research Program (IRP) of the National Institute of Biomedical Imaging and Bioengineering (NIBIB), National Institutes of Health (NIH).
Conflict of Interest
The authors have declared that no conflict of interest exists.
References
1. Culka A, Jehlicka J, Vandenabeele P, Edwards HG. The detection of biomarkers in evaporite matrices using a portable Raman instrument under Alpine conditions. Spectrochim Acta A Mol Biomol Spectrosc. 2010 [Epub ahead of print]
2. Jehlicka J, Edwards HG, Culka A. Using portable Raman spectrometers for the identification of organic compounds at low temperatures and high altitudes: exobiological applications. Philos Transact A Math Phys Eng Sci. 2010;368:3109-25
3. Ferrari M. Cancer nanotechnology: opportunities and challenges. Nat Rev Cancer. 2005;5:161-71
4. Bhirde A, Xie J, Swierczewska M, Chen X. Nanoparticles for cell labeling. Nanoscale. 2011;3:142-53
5. Wang H, Chen X. Applications for site-directed molecular imaging agents coupled with drug delivery potential. Expert Opin Drug Deliv. 2009;6:745-68
6. Bianco A, Kostarelos K, Prato M. Opportunities and challenges of carbon-based nanomaterials for cancer therapy. Expert Opin Drug Deliv. 2008;5:331-42
7. Kostarelos K, Bianco A, Prato M. Promises, facts and challenges for carbon nanotubes in imaging and therapeutics. Nat Nanotechnol. 2009;4:627-33
8. Hersam MC. Progress towards monodisperse single-walled carbon nanotubes. Nat Nanotechnol. 2008;3:387-94
9. Yamada T, Namai T, Hata K, Futaba DN, Mizuno K, Fan J. et al. Size-selective growth of double-walled carbon nanotube forests from engineered iron catalysts. Nat Nanotechnol. 2006;1:131-6
10. Podesta JE, Al-Jamal KT, Herrero MA, Tian B, Ali-Boucetta H, Hegde V. et al. Antitumor activity and prolonged survival by carbon-nanotube-mediated therapeutic siRNA silencing in a human lung xenograft model. Small. 2009;5:1176-85
11. Bhirde AA, Patel V, Gavard J, Zhang G, Sousa AA, Masedunskas A. et al. Targeted killing of cancer cells in vivo and in vitro with EGF-directed carbon nanotube-based drug delivery. ACS Nano. 2009;3:307-16
12. Bhirde AA, Sousa AA, Patel V, Azari AA, Gutkind JS, Leapman RD. et al. Imaging the distribution of individual platinum-based anticancer drug molecules attached to single-wall carbon nanotubes. Nanomedicine (Lond). 2009;4:763-72
13. Liu Z, Fan AC, Rakhra K, Sherlock S, Goodwin A, Chen X. et al. Supramolecular stacking of doxorubicin on carbon nanotubes for in vivo cancer therapy. Angew Chem Int Ed Engl. 2009;48:7668-72
14. Liu Z, Chen K, Davis C, Sherlock S, Cao Q, Chen X. et al. Drug delivery with carbon nanotubes for in vivo cancer treatment. Cancer Res. 2008;68:6652-60
15. Liu Z, Winters M, Holodniy M, Dai H. siRNA delivery into human T cells and primary cells with carbon-nanotube transporters. Angew Chem Int Ed Engl. 2007;46:2023-7
16. Herrero MA, Toma FM, Al-Jamal KT, Kostarelos K, Bianco A, Da Ros T. et al. Synthesis and characterization of a carbon nanotube-dendron series for efficient siRNA delivery. J Am Chem Soc. 2009;131:9843-8
17. Kostarelos K. The long and short of carbon nanotube toxicity. Nat Biotechnol. 2008;26:774-6
18. Liu Z, Sun X, Nakayama-Ratchford N, Dai H. Supramolecular chemistry on water-soluble carbon nanotubes for drug loading and delivery. ACS Nano. 2007;1:50-6
19. Zheng M, Jagota A, Semke ED, Diner BA, McLean RS, Lustig SR. et al. DNA-assisted dispersion and separation of carbon nanotubes. Nat Mater. 2003;2:338-42
20. Haggenmueller R, Rahatekar SS, Fagan JA, Chun J, Becker ML, Naik RR. et al. Comparison of the quality of aqueous dispersions of single wall carbon nanotubes using surfactants and biomolecules. Langmuir. 2008;24:5070-8
21. Nish A, Hwang JY, Doig J, Nicholas RJ. Highly selective dispersion of single-walled carbon nanotubes using aromatic polymers. Nat Nanotechnol. 2007;2:640-6
22. Veronese FM, Pasut G. PEGylation, successful approach to drug delivery. Drug Discov Today. 2005;10:1451-8
23. Prencipe G, Tabakman SM, Welsher K, Liu Z, Goodwin AP, Zhang L. et al. PEG branched polymer for functionalization of nanomaterials with ultralong blood circulation. J Am Chem Soc. 2009;131:4783-7
24. Liu Z, Davis C, Cai W, He L, Chen X, Dai H. Circulation and long-term fate of functionalized, biocompatible single-walled carbon nanotubes in mice probed by Raman spectroscopy. Proc Natl Acad Sci U S A. 2008;105:1410-5
25. Liu Z, Tabakman SM, Chen Z, Dai H. Preparation of carbon nanotube bioconjugates for biomedical applications. Nat Protoc. 2009;4:1372-82
26. Bhirde AA, Patel S, Sousa AA, Patel V, Molinolo AA, Ji Y. et al. Distribution and clearance of PEG-single-walled carbon nanotube cancer drug delivery vehicles in mice. Nanomedicine (Lond). 2010;5:1535-46
27. Dresselhaus MS, Dresselhaus G, Jorio A, Souza Filho AG, Samsonidze GG, Saito R. Science and applications of single-nanotube Raman spectroscopy. J Nanosci Nanotechnol. 2003;3:19-37
28. Stiles PL, Dieringer JA, Shah NC, Van Duyne RP. Surface-enhanced Raman spectroscopy. Annu Rev Anal Chem (Palo Alto Calif). 2008;1:601-26
29. Duan X, Son H, Gao B, Zhang J, Wu T, Samsonidze GG. et al. Resonant Raman spectroscopy of individual strained single-wall carbon nanotubes. Nano Lett. 2007;7:2116-21
30. Kalbac M, Hsieh YP, Farhat H, Kavan L, Hofmann M, Kong J. et al. Defects in individual semiconducting single wall carbon nanotubes: Raman spectroscopic and in situ Raman spectroelectrochemical study. Nano Lett. 2010;10:4619-26
31. Dillon AC, Yudasaka M, Dresselhaus MS. Employing Raman spectroscopy to qualitatively evaluate the purity of carbon single-wall nanotube materials. J Nanosci Nanotechnol. 2004;4:691-703
32. Liang F, Chen B. A review on biomedical applications of single-walled carbon nanotubes. Curr Med Chem. 2010;17:10-24
33. Keren S, Zavaleta C, Cheng Z, de la Zerda A, Gheysens O, Gambhir SS. Noninvasive molecular imaging of small living subjects using Raman spectroscopy. Proc Natl Acad Sci U S A. 2008;105:5844-9
34. Zavaleta C, de la Zerda A, Liu Z, Keren S, Cheng Z, Schipper M. et al. Noninvasive Raman spectroscopy in living mice for evaluation of tumor targeting with carbon nanotubes. Nano Lett. 2008;8:2800-5
35. Sessa C, Del Conte G. Targeted therapies: tailored treatment for ovarian cancer: are we there yet? Nat Rev Clin Oncol. 2010;7:80-2
36. Bast RCJr, Hennessy B, Mills GB. The biology of ovarian cancer: new opportunities for translation. Nat Rev Cancer. 2009;9:415-28
37. Liu Z, Tabakman S, Welsher K, Dai H. Carbon Nanotubes in Biology and Medicine: In vitro and in vivo detection, imaging and drug delivery. Nano Res. 2009;2:85-120
38. Xiao Y, Gao X, Taratula O, Treado S, Urbas A, Holbrook RD. et al. Anti-HER2 IgY antibody-functionalized single-walled carbon nanotubes for detection and selective destruction of breast cancer cells. BMC Cancer. 2009;9:351
39. Zhou F, Xing D, Ou Z, Wu B, Resasco DE, Chen WR. Cancer photothermal therapy in the near-infrared region by using single-walled carbon nanotubes. J Biomed Opt. 2009;14:021009
40. Levi-Polyachenko NH, Merkel EJ, Jones BT, Carroll DL, Stewart JHt. Rapid photothermal intracellular drug delivery using multiwalled carbon nanotubes. Mol Pharm. 2009;6:1092-9
41. Torti SV, Byrne F, Whelan O, Levi N, Ucer B, Schmid M. et al. Thermal ablation therapeutics based on CN(x) multi-walled nanotubes. Int J Nanomedicine. 2007;2:707-14
42. Chen WR, Adams RL, Heaton S, Dickey DT, Bartels KE, Nordquist RE. Chromophore-enhanced laser-tumor tissue photothermal interaction using an 808-nm diode laser. Cancer Lett. 1995;88:15-9
43. Huang X, Jain PK, El-Sayed IH, El-Sayed MA. Plasmonic photothermal therapy (PPTT) using gold nanoparticles. Lasers Med Sci. 2008;23:217-28
44. Costa S, Borowiak-Palen E, Kruszynsk M, Bachmatiuk A, Kalenczuk RJ. Characterization of carbon nanotubes by Raman spectroscopy. Mater Sci-Poland. 2008;26:233-441
45. Creighton CJ, Fountain MD, Yu Z, Nagaraja AK, Zhu H, Khan M. et al. Molecular profiling uncovers a p53-associated role for microRNA-31 in inhibiting the proliferation of serous ovarian carcinomas and other cancers. Cancer Res. 2010;70:1906-15
46. Kostarelos K, Lacerda L, Pastorin G, Wu W, Wieckowski S, Luangsivilay J. et al. Cellular uptake of functionalized carbon nanotubes is independent of functional group and cell type. Nat Nanotechnol. 2007;2:108-13
47. Kotova S, Prasad K, Smith PD, Lafer EM, Nossal R, Jin AJ. AFM visualization of clathrin triskelia under fluid and in air. FEBS Lett. 2010;584:44-8
48. Plassmeyer ML, Reiter K, Shimp RLJr, Kotova S, Smith PD, Hurt DE. et al. Structure of the Plasmodium falciparum circumsporozoite protein, a leading malaria vaccine candidate. J Biol Chem. 2009;284:26951-63
Author contact
![]() Corresponding author: Dr. Xiaoyuan Chen, 31 Center Dr 1C22, Bethesda, Maryland 20892-2281. Email: Shawn.Chengov
Corresponding author: Dr. Xiaoyuan Chen, 31 Center Dr 1C22, Bethesda, Maryland 20892-2281. Email: Shawn.Chengov
Citation styles
APA
Bhirde, A.A., Liu, G., Jin, A., Iglesias-Bartolome, R., Sousa, A.A., Leapman, R.D., Gutkind, J.S., Lee, S., Chen, X. (2011). Combining Portable Raman Probes with Nanotubes for Theranostic Applications. Theranostics, 1, 310-321. https://doi.org/10.7150/thno/v01p0310.
ACS
Bhirde, A.A.; Liu, G.; Jin, A.; Iglesias-Bartolome, R.; Sousa, A.A.; Leapman, R.D.; Gutkind, J.S.; Lee, S.; Chen, X. Combining Portable Raman Probes with Nanotubes for Theranostic Applications. Theranostics 2011, 1, 310-321. DOI: 10.7150/thno/v01p0310.
NLM
Bhirde AA, Liu G, Jin A, Iglesias-Bartolome R, Sousa AA, Leapman RD, Gutkind JS, Lee S, Chen X. Combining Portable Raman Probes with Nanotubes for Theranostic Applications. Theranostics 2011; 1:310-321. doi:10.7150/thno/v01p0310. https://www.thno.org/v01p0310.htm
CSE
Bhirde AA, Liu G, Jin A, Iglesias-Bartolome R, Sousa AA, Leapman RD, Gutkind JS, Lee S, Chen X. 2011. Combining Portable Raman Probes with Nanotubes for Theranostic Applications. Theranostics. 1:310-321.
This is an open access article distributed under the terms of the Creative Commons Attribution (CC BY-NC) License. See http://ivyspring.com/terms for full terms and conditions.